Admin
-
Posts
9,302 -
Joined
-
Last visited
-
Days Won
109
Content Type
Profiles
Forums
Gallery
Downloads
Blogs
Events
Store
Aircraft
Resources
Tutorials
Articles
Classifieds
Movies
Books
Community Map
Quizzes
Videos Directory
Everything posted by Admin
-
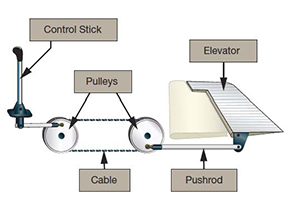 One of my early instructors was a highly pessimistic individual, always muttering about 'What if this bit fell off, how would you cope with it?" and other such comments full of joy. Over the years however, I have come across a number of incidents where things have fallen off, with widely differing results. A few years ago a gliding friend suffered a failure of an aileron quick-release control rod which caused the free aileron to flutter. An uncomfortable but still somewhat controllable situation. Unfortunately when she tried to turn the glider the loose end of the rod jammed in the structure and resulted in a high speed fatal descent. Another friend found himself at the top of a glider winch launch with no elevator control and escaped by parachute from only 600 feet. A third gliding friend flying a Nimbus 3 (an 87 feet span monster with several flap/aileron sections) aero tow-launched after a servicing during which the controls 'adjusted'. The test flight revealed the glider would only circle to the left despite full right aileron and rudder. After an interesting launch, where the tug pilot managed to turn and climb at the best rate for the glider, he was dropped off tow high enough to bale out. By experimenting with various speeds, flap and airbrake settings he managed to control it just enough to return to the airfield. By having a sound knowledge of the aircraft and approaching the problem in a calm efficient manner this pilot recovered a situation which might have ended very differently. The aim of this article is to encourage pilots to think about how they might cope with a control problem, and what aspects of the aircraft behaviour might be of assistance. While most control failure problems can be avoided by suitable maintenance there is always the possibility that one day you may find yourself with such a challenge. The key to surviving such an experience is a thorough knowledge of the handling characteristics of the aircraft, particularly the secondary effects of controls. Control failure modes Control failures, be they caused by mechanical failure, collision or structural failure will probably result in one or more of the following: restricted or no movement of the control surface surface floating free and probably fluttering to some extent surface missing completely, or connected by control cables and probably flailing around behind the aircraft major application of one or more controls to remain in a desired attitude/heading. Pitch control Perhaps the most critical control and also the one with most options, as most aircraft can be controlled in pitch in a number of ways. Adjusting the power setting will usually result in a trim change. Coarse or gentle applications of power may have different effects on attitude, descent rate and the all-important airspeed. Varying the power will also adjust torque and slipstream effect, thus assisting, to a small degree, with roll control. Aerodynamic trim tabs (those that sit on the trailing edge of the elevator) may be of some use. If the surface is jammed the tab will work like a small, albeit not very effective, elevator, although the lever must be moved the opposite way to the control column. (Trim lever forward will raise the nose). If the elevator is floating free (and not fluttering) the trim lever may be used in the same sense as the control column. Bank angle is an effective way of controlling pitch. We all know that as we enter a turn the nose tends to drop unless we counter it. It is possible to use bank angle to lower the nose and hence control the speed. You will of course be in some sort of (probably descending) turn but the turn will be partially controlled and that is better than spinning or stalling. The steeper the bank, the more the nose pitches down. By adding pro-turn or anti-turn rudder more control is available. This method gives you a reasonable degree of control over speed, in return for some height loss and the increased risk of a cross-controlled stall. Centre of gravity. If your aircraft has more than one tank and you can transfer fuel you may be able to adjust the attitude by moving fuel. Even leaning forward or back will have some effect. It's not much but it's better than nothing. A Miles Messenger escaping to England during WW2 lost its entire engine after one propeller blade was shot away while crossing the Channel. The family aboard all piled into the front seats and the aircraft glided just above the stall to shore and a successful landing! Several aircraft have approach control devices such as flaps or spoilers. These controls usually have some sort of trim change associated with their operation. Some higher performance gliders use flap settings even more than the elevator for controlling pitch, relegating the elevator to little more than a trimming device for much of the time. Roll control In the event of loss of the ailerons some degree of roll control is available by using the secondary effect of rudder. While not an efficient way to turn the aircraft you should have at least some directional control. Short or rapid bursts of power may increase the effectiveness of the rudder to some degree. Power, in the form of torque and slipstream effect may also be of use. Yaw control Loss of the rudder, as long as the aircraft is kept away from a stall/spin poses the fewest problems as long as the effects of power and adverse yaw are understood. Bank angle can be used to counter any yaw tendency (from torque or a damaged fin while in flight) and care must be taken to allow for adverse yaw when entering or exiting any turns. Effect of airspeed The various trim changes associated with controlling the aircraft change with the airspeed. Adverse yaw for example, decreases with an increase in airspeed. The aircraft should be flown at a speed safely above the stall but no faster, unless the increase in speed provides more control. If a control surface is floating free it will tend to flutter and the violence of the flutter will increase with speed. Other methods Some aircraft have doors or canopies fitted which if opened in flight may well provide some sort of trim change. It may or may not be of use but it is worth considering. If the aircraft is approved, the manufacturer may be able to supply information on what happens when a door is opened in flight. Unless the door is approved for opening in flight it should not be practised, but in an emergency ... Control on the ground If possible try to find somewhere to land which is large, long and flat, and as into wind as possible. On the ground the ailerons (or more accurately, adverse yaw) can be used to aid in directional control. (Use left aileron to turn right). Those with differential brakes can make use of them for some directional control. As many of us fly taildraggers with single brake controls, use brakes only gently and while travelling straight. Heavy braking when the aircraft is starting to swing will accelerate the impending ground loop. Considerations When faced with some control problem you should endeavour to place the aircraft in a reasonable attitude with sufficient speed for normal flight or as near as possible to it. Assess the failure as to what type (whether the failure is a structural or mechanical one and whether the surface is still there, fluttering etc.), which control(s) are affected and the various secondary effects that can be used to help. In the event of a structural failure or collision the airframe integrity will already have been compromised and so the aircraft should be landed as soon as possible, once some manner of control has been established. Extending flaps or spoilers, or opening doors on a damaged airframe may compromise the structure further so, unless control is inadequate, leave flaps where they are. If the control surface or the structure is fluttering, once again, land as soon as control is established. Flutter can be very violent and destructive, and will increase dramatically with airspeed, so aim to fly at the minimum speed where you still retain sufficient control. If the control failure is a restriction or loss of movement and you have the aircraft under sufficient control, it may be flown to a more suitable area for landing. However, continue to monitor the problem and be prepared to land immediately if there is any sign of the problem compounding. All of the above methods of alternative control, even those that only provide a small measure of assistance, may well add up to the difference between surviving a control problem or not. Even if you never have a control failure, considering the above methods will hopefully make you more aware of the aircraft's habits and so improve your flying skills. Many of these methods may be practised safely at a suitable height. For example, trim the aircraft to fly "hands off' and try a number of climbing and descending turns, rolling out onto specific headings, using rudder and effects of power. With an aircraft as responsive to secondary effects as a Drifter it is possible to fly entire circuits without touching the stick, but it is best to practise this with an instructor. Hopefully none of us will ever have to cope with a control failure but it would be nice to know how the aircraft (and the pilot) might react to one. After all none of us want to have an engine failure but we all practise in case we get one (don't we ... ?). Read the article 'Rooted' in the May – June 2004 issue of CASA's Flight Safety Australia magazine.
 -
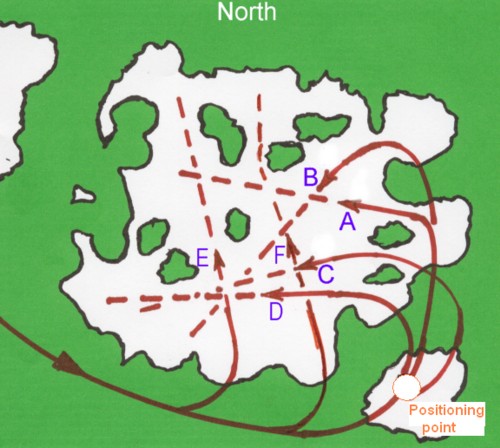 7.2.1 Maintaining preparedness Flight planning When planning a cross-country flight some essential actions are required to minimise both the possibility of power loss and the consequences of such: Construct a safe route. Calculate the fuel needs. If using a GPS in flight planning be aware the GPS does not take into account the type of terrain or the height of terrain — the GPS indicated route might be over 'tiger country' (e.g. heavily wooded) or straight through a mountain. Warning: the GPS 'GO TO' function is an emergency use feature only — it should not be used as a substitute for proper route planning. Prior to take-off I suggest you review the groundschool module 'Take-off considerations' before continuing with this section. Check the stopping distance required. The pilot should know the distance required to reach flight speed and then bring the aircraft to a halt. It may be necessary to abandon the take-off shortly after lift-off, due to power failure or just doubtful engine performance or other event — this is particularly important in short field or 'hot and high' take-offs. If take-off and landing distance (over a 50 foot screen) charts are available then the total distance needed to take off, abort at 50 foot, land and bring the aircraft to a halt is just the sum of the charted density altitude take-off and landing distances required. If the distance available is insufficient to take off, reach 50 feet, land and safely bring the aircraft to a halt at the departure, destination and en route airfields, then maybe the planned flight is really not a good idea. Before taxiing ensure all extraneous objects in the aircraft are secured adequately so that they cannot foul the control lines or rudder pedals or become missiles in the event of an emergency landing. In addition you must ensure there is no possibility of anything becoming loose and wrapping around the tailplane, or passing through the propeller disc of a pusher-engined aircraft. Always check the fuel tanks for water, don't change tanks just before take-off, and taxi out and take off on the fullest tank. Always do an engine run-up before take-off which, as well as the usual engine checks, is of sufficient duration to ensure fuel is flowing properly throughout the system. Always plan to gain greatest altitude possible before reaching the airfield boundary, so take off into wind; don't do an intersection take-off; use all the distance available — runway behind you at the start of take-off is an asset stupidly thrown away. If the area outside the airfield boundary is rough, plan to climb out at Vx rather than Vy, and maintain full power until a good height and cruise speed is reached. The extra height gained with distance flown may be very handy if the engine fails. Whether operating from a familiar or unfamiliar airfield, you must have some knowledge of the terrain surrounding the airfield and the position, slope and condition of likely forced landing sites plus associated hazards. If the airfield is unfamiliar then you must ascertain escape routes, potential forced landing sites and hazards during the initial overflight or by ground inspection. After completing your take-off engine and cockpit checks, have a good look at the take-off path and rehearse your emergency procedure for any situation that may occur before you are established at a safe height. 7.2.2 Engine failure after take-off or a go-around Pilots should always be prepared for the possibility that the engine will lose partial or total power during the take-off and climb-out; or, for that matter, at any other time during flight. But, if there is even a suspicion something is not quite right during the initial ground run, the take-off should be abandoned immediately and the aircraft returned to the hangar area for a ground check. It is most unwise to continue the take-off if the engine falters and then picks up, or even if you are just not fully confident about its behaviour. When total or near-total power loss occurs after lift-off the cardinal rule is to 'fly the aeroplane!'; i.e. maintain control of the aircraft. This initially implies quickly getting the aircraft into the right glide attitude and waiting until the speed rebuilds to the appropriate glide speed, then fine trimming. (When changing from climb to glide attitude, the nose has to be pushed down through quite a few degrees, which might feel excessive — particularly if the aircraft was not trimmed to the climb speed.) In circumstances like this, some say the second and third edicts should also be 'fly the aeroplane!' and 'fly the aeroplane!'. During the climb-out the aircraft is at a high aoa, producing very high induced drag — particularly so if climbing at Vx — and when the engine fails, speed decays very quickly, and even more so if the aircraft has a high parasitic drag. The pilot may take three to four seconds to react and move the control column forward, and the aircraft will then take a few seconds to rebuild a safe speed. During these periods the aircraft will be sinking, and if height and airspeed are insufficient the pilot is locked into an immediate and probably very heavy 'landing'. More turn-back information can be read in 'The turn back: possible or impossible — or just unwise?'; also read Mike Valentine's article 'The turn-back following engine failure'. On-field landing If the aircraft is very low when the engine fails the only option is to keep the wings level and land more or less straight ahead — which is no problem if the airfield area ahead is clear. There is little time to do anything but fly the aircraft and close the throttle and also switch off the ignition and electrics. Airspeed is likely to be very low so keep the nose down and the wings level during the descent, using gentle control movements if necessary to change direction slightly. Lower full flap but be prepared for the associated attitude change. You must avoid the possibility of a wingtip striking an airfield marker, fence post or other obstruction — or getting caught in long grass — and causing the aircraft to 'cartwheel'; also the possibility of wheelbarrowing is high. You must also avoid tripping over the boundary fence while airborne, so just get it down (not nosewheel first) and use whatever reasonable means is available to decelerate. Long grass will help slow the aircraft but if necessary, groundloop it to avoid major or expensive obstructions, like a row of parked aircraft. The groundloop is induced by booting in full rudder (and brake) on the side to which you want to swing and will probably result in some wing tip, undercarriage and propeller damage, unless you impact something other than the ground. Off-field landing If some height has been gained but there is no possibility of landing on the airfield then an off-field landing is mandatory. Look for somewhere to put it down but don't immediately fix on the first likely landing site spotted straight ahead of you; there may be a more suitable site off to the side. You have to rapidly assess your height, airspeed (i.e. your energy level) and the turn possibilities available at that height; i.e. can you safely turn through 30° or 45° perhaps even 60° using moderate bank angles and still make it to that much better looking site? Will the wind assist or hinder? It has to be a quick decision because at best you have just a few seconds available to plan the approach. If any doubt, go for 'into wind'. Do not choose the site at marginal distance, even if it's perfect. Close by is better because the height in hand can be used for manoeuvring the aircraft into the best approach position. Because you have no power available you must always have an adequate height margin to allow for your misjudgements, adverse wind shifts, sinking air, vertical gusts and other unforeseen events — and you can dump excess height quickly by sideslipping. Remember that the rate of sink whilst sideslipping is high and the slip must be arrested before the flare. Apart from being clearly within range the choice of landing site is affected by: wind strength and direction ground run availability and direction; a short into-wind site may be preferable to a longer but crosswind/downwind site for an aircraft with a slow stall speed; the reverse applies for an aircraft with a high stall speed. It all relates to kinetic energy and stopping distance approach obstructions; final approach may require some diversion around/over trees, under/over power-lines plus avoidance of other obstructions. Can the near-ground turns be handled safely? Is there sufficient margin for misjudgement and/or wind gusts? ground surface and obstructions, including livestock, during the ground roll. Can you steer to avoid them? Are livestock or kangaroos likely to take fright and run into your path? the energy absorbing properties of the vegetation ground slope: the possibilities of landing downslope may range from difficult to impossible; moderate upslope is good if the pre-touchdown flare is well judged. There is a much greater change in the flight path during the flare; for example, if the upslope has a one in six gradient (about 15°) and the aircraft's glide slope is 10° then the flight path has to be altered by 25° so that the aircraft is flying parallel to the upslope surface before final touchdown. A higher approach speed is needed because the increased wing loading during the flare (a turn in the vertical plane) increases stall speed. If the wind is upslope then a crosswind landing may be feasible if a rural road is chosen can you avoid traffic, wires and poles, particularly in a crosswind situation? a final approach into a low sun should be avoided so that vision is not obscured. All of this is impossible to assess in the few seconds available, hence the need for prior knowledge of the airfield environs and a pre-established emergency procedure for any situation that may occur before you are established at a safe height. As height increases, the options increase for turning towards and reaching more suitable landing areas, making a short distress call and doing some quick trouble shooting. Trouble-shooting When trouble-shooting full or partial power loss remember the first edict — constantly 'fly the aeroplane!'. If the engine is running very roughly or died quietly (i.e. without obviously discordant sounds associated with mechanical failure) and time is available, then apart from the engine gauges, the obvious things to check or do are: Fuel supply: switch tanks (making sure you haven't inadvertently switched to the 'fuel off' position), fuel booster pump on, check engine primer closed. Air supply/mixture: throttle position and friction nut, throttle linkage connection and mixture control position. Apply and maintain carburettor heat (while engine is still warm), setting the throttle opening at the normal starting position. Apply carburettor heat or select alternate air to bypass the air intake filter — which could be blocked by grass seeds or a bird strike. Ignition: position of ignition switches — and try alternating switches in case one magneto is operating out of synchronisation. Or: reverse the last thing you did before the engine packed up. And then: try a restart. There is no point in continuing with a forced landing if the engine is really okay. Cockpit check prior to touchdown Pilot and passenger harnesses must be tight and maybe remove eyeglasses. Seats should be slid back and re-locked in place (if that is possible without adding to the risk) but be aware of the cg movement. Advise the passenger of intentions, warn to brace for impact and advise evacuation actions after coming to a halt. Unlatch the doors so that they will not jam shut on impact. If the aircraft has a canopy or hatch take similar safety action, if that is possible without the canopy affecting controllability or detaching and damaging the empennage. If equipped with a retractable undercarriage, leave the wheels down unless surface conditions indicate otherwise. To minimise fire risk turn the ignition, fuel and electrics off. Handling the approach Once the landing site is decided then choose the ground path for the landing run and select an initial aiming point up to halfway along it. (Once it is clear that the aircraft will reach or overshoot that safety point, then a second point located between the aircraft and that initial aiming point will become the touchdown target with the application of flaps/sideslip.) Continue tracking down the approach path, whilst correcting for any crosswind component, and watching the position and apparent movement of the aiming point relative to the windscreen. Avoid premature use of flaps — although partial flap does help low-speed manoeuvrability and reduces stall speed at the expense of a steeper descent path. At each stage of the approach the aircraft should be re-trimmed to maintain the desired airspeed — and keep it balanced. Watch the top of the highest obstacle along the approach path. If the vertical distance in the windscreen between the top of the obstacle and the aiming point is widening you should clear the obstacle, if it is narrowing you may not. You then have to decide whether you can: (a) accept to hit that obstacle; or (b) safely turn a little onto another landing path; or (c) lower full flap and/or start a full sideslip so that touchdown is made before the obstacle and into vegetation with more suitable energy-absorbing properties. Be aware that dead trees poking above the general tree level may be very difficult to see, particularly if the sun is in an unfavourable position. If the aiming point appears to be moving down the screen you are overshooting (too high) and will touchdown past the target. Lower first-stage flap or start a gentle sideslip and check the result. If you are still overshooting and will safely clear the approach obstacles use second-stage or full flap, or full sideslip (or both if necessary) to steepen the descent path. Prepare for flare and touchdown. If the aiming point appears to be motionless in the screen, the approach slope is good and touchdown would be close to the initial aiming point. At an appropriate position lower full flap, and prepare for flare and touchdown prior to the initial aiming point. If the aiming point appears to be moving up the windscreen you are undershooting (too low) and will touchdown before the initial aiming point. This is no problem if it appears that the touchdown point will still be within the target area — just continue the approach and lower full flap prior to touchdown. If, however, it appears that touchdown will occur before the target area, then lower full flap and head towards the softest vegetation or the most unobstructed area. Whatever you do you must hold the glide attitude. Do not raise the nose until rounding out and never think you can 'stretch the glide'; although ground effect (or water effect) can stretch the float a little. Make a firm touchdown to avoid floating and after touchdown keep the control column fully back. Very severe jolting will make it difficult to hold the feet on the rudder bar but try to maintain steerability, using rudder and brakes, to avoid the worst obstacles and preserve the occupant zone. If appropriate use maximum braking — but avoid locking a wheel — it may not ride over the smaller obstructions. Be prepared to evacuate the aircraft quickly and to grab the fire extinguisher. After evacuation keep well away from the aircraft until any fire risk has abated. If you have a handheld transceiver, broadcast that you are safe or need assistance. Activate your distress beacon if considered appropriate. Partial power loss 1. If loss of thrust is accompanied by extreme vibration or massive shaking of the aircraft (probably due to a propeller blade failure) it is important to immediately shut down the engine to avoid it departing from its mountings. 2. If the engine does not fail completely but is producing sufficient power to enable level flight at a safe speed, then it may be possible to return to the airfield. Make gentle turns, maintaining height if possible without the airspeed decaying, and choose a route that provides some potential landing sites in case the engine loses further power. It's a judgement call whether you should take advantage of a possible landing site along the way because the off-field landing is almost certainly going to damage the aircraft and possibly injure the occupants. But that must be weighed against the chance of further power loss before reaching the airfield, producing a much more hazardous situation; it is usually considered best to put the aircraft down at the first reasonable site. If there is insufficient power to maintain height then you must set up an off-field landing. Read the article 'Piper Worrier' in the January–February 2003 issue of Flight Safety Australia. 3. If the engine is producing intermittent power it is probably best to use that intermittent availability to get to a position where a glide approach can be made to a reasonable off-airfield site. Intermittent power negates the ability to conduct a controlled approach and could get you into a dangerous situation. So having achieved a position where you can start the final approach then shut down the engine by switching off fuel and ignition or, at least, fully close the throttle. Fully shutting the engine down early means the engine will be cold at touchdown, which reduces fire risk. 7.2.3 En route emergency procedure While en route at an appropriate cruising altitude you must maintain the habit of continually assessing wind velocity at cruising altitude and the best general areas for possible landing sites — taking into account the wind and glide distance and not forgetting to take note of what is right below. If the engine should fail, or give concern, first head directly to that general area at Vbg; or if it is very close then use Vmd and aim to make a spiral descent over that area. Trim to the chosen speed and maintain balanced flight; slip/skid increases drag. If you are more than 2500 feet agl you will have ample time available to make choices and the following procedures may be appropriate: Do the troubleshoot checks described above and configure the aircraft for minimum drag, i.e. flaps and wheels up. Ease the nose down a little when selecting flaps up to avoid stalling the aircraft. Try to stop a windmilling propeller, but if you don't succeed with the first attempt forget it. Change to fully coarse pitch (the minimum rpm position) if the propeller is adjustable in flight. Make a distress or urgency call and, if equipped, set the transponder to squawk 7700. Pick a first choice landing zone: something large, flat and firm, with few obstructions (which allows a circling approach and a multiple choice of landing runs) would be ideal. You will have to consider many factors and combinations thereof; for example, a site that provides a long ground run but which entails a downwind landing compared with a shorter, into wind and downsloping landing path, or an obstructed approach but clear landing path compared to a clear approach but obstructed surface. If you have been caught out in heavily treed hilly country the only options may be to: (a) land in a creek bed; (b) land along a ridge top; or (c) fly along a valley line then turn to land upslope onto the tree tops. In the latter case the airspeed would need to be greater than Vbg to provide sufficient energy to execute the turn and the subsequent flare to follow the upslope without stalling. Whatever alternative is chosen is high risk, but easily avoidable by not overflying such terrain at insufficient height to glide clear. Ground obstructions — stumps, roots, rock outcrops, boulders, termite mounds, ditches, potholes, old farm machinery, fences and power-lines — may not be visible until closer, so select an alternate landing zone nearby in case the first choice proves not so good. ('Single wire earth return' power-lines are near impossible to see — particularly if it's oxidised copper.) You can probably afford to change your choice once, but not twice! If landing in an obviously ploughed field try not to land across the furrows, particularly in a nosewheel aircraft; close to a fence the furrows generally parallel the fence line. If possible, avoid surface water. Estimate your height above the site by reference to the contour lines on your WAC or VNC and the altimeter. Airborne time available is height divided by the known Vbg descent rate, but flight into sinking air will reduce this. Decide on the general approach pattern and aim to fly as near a normal glide approach as possible, starting with the base leg. Do not plan to fly a normal square circuit; rather, plan a descending spiral that keeps you equidistant from the site. Decide on a base leg positioning location and aim to be at this location at a glide approach height that would allow one minute on a nominal base leg and one minute on final; say about 800 feet agl if your Vbg sink rate is 400 fpm. Avoid a long, straight final approach — it allows too much exposure to unfavourable atmospheric conditions, particularly sinking air and turbulence. Depending on height, distance and wind velocity (remembering the friction layer effect on the vertical wind profile) decide an approach to get down to that positioning location so that the landing zone is always in sight and always within easy reach — which allows the surface, the wind and final approach paths to be rechecked. The approach path should be planned starting with the ground run and working back. The approach path can be widened if far too high — otherwise medium S turns, flaps or sideslip might be used to descend to the positioning location, but flaps should be retracted before reaching there. Flaps probably won't be used again until well established on a final approach. In some aircraft S turns are not that effective in getting rid of excess height. If you feel you are in sinking air or battling a headwind, increase airspeed to a better 'penetration' airspeed above Vbg. Start the base leg from the positioning location and adjust the track and the turn onto final to compensate for the wind, height and/or misjudgements. While flying the base leg finalise the intended ground path for the landing run and select an initial aiming point about halfway along it. You may have to plan for a dogleg during the ground roll. Then carry out the final cockpit check, approach and landing as in 'handling the approach' above. The diagram below illustrates an approach pattern allowing multiple choice of final approach and landing run. The wind is estimated to be in the north west quadrant. Path A is the planned approach and landing run from a base leg positioning location, paths B, C and D show alternate paths which either delay or bring forward the turn onto final to cater for height, wind or positioning differences. Paths E and F show the possibilities for a turn onto a landing path if it is required to do so before reaching the base leg positioning point. Mike Valentine, the late RA-Aus Operations Manager, had a few very relevant comments: The turnback part of the (Coping with Emergencies) series is particularly timely in view of the Skyfox accident last October and the Bantam accident three weeks ago, both of which involved engine failures and attempted turnbacks. It is an old problem and seems to be one that won't go away. In view of this, I hope you don't mind if I offer a comment on a particular point in post-engine-failure training. My main background is in gliding (47 years), with about 30 years GA and 7 years ultralight instructing (Drifter, Gazelle, Skyfox) to add to the mixture. In gliding, we had a persistent problem with loss of control following a winch-launch cable-break and attempted turnback, a situation which is directly analagous to the problem which is plaguing us now. Most, if not all, such accidents were fatal. As Operations Director of the Gliding Federation of Australia, I had to try to address this problem and see if we could tame it. Rather than get involved here in a detailed analysis, I will just give you the bare bones of our efforts. In researching accidents of this kind over a 30 year period (world-wide, not just Australia), a couple of common threads emerged. Firstly, in many cases there was never any need to turn back — there was ample strip ahead and all the pilot needed to do was to establish a safe speed, adjust the approach path with spoilers/airbrakes and land ahead. This is a crucial point and is often overlooked. Secondly, and of equal importance, is the fact that, although a pilot may lower the nose after an engine failure, as briefed, the same pilot may not hold that attitude for a while and allow the speed to increase and stabilise. A glider in the full climb phase of a winch-launch is generally a fair bit steeper than an ultralight in the climb attitude, but the principle is no different (nor is the outcome, when the energy runs out). We did the trials in representative types of training glider, from the 400 kg Kookaburra (33 knot stall, 20:1 L/D) to the 590 kg IS-28B2 (35 knot stall, 35:1 L/D) and the results were remarkably consistent. From a full climb attitude at 55 knots IAS, the cable release knob was pulled, simulating a wire-break. As one pilot immediately took recovery action, using strong nose-down stick movement, the other pilot started the stop-watch. From the time the 'wire-break' occurred at 55 knots to the time 55 knots once more appeared on the ASI was a consistent 6 seconds. This is the amount of time needed before a pilot can make any attempt to manoeuvre the glider. In the types of glider we are talking about, 55 knots is about 1.5 Vs and is regarded by the GFA training system as a 'safe speed near the ground'. I have found that the above figures apply equally well to a Drifter. However, with gliders we then went one stage further. We did it because we were dealing with aircraft which were fully approved for spinning. We tried simulating a winch-launch in free flight by diving to 80 or 90 knots and pulling up to an approximate winch-launch angle, then when the speed fell to 60 knots we lowered the nose and immediately applied aileron and rudder to commence a turn. The result was consistent spin departures, not necessarily immediately but certainly before reaching 180 degrees of turn. All this means that lowering the nose after an engine failure is not the complete answer. If a pilot is not taught that the lowering of the nose should be followed by DOING NOTHING, just holding the new attitude and waiting for the speed to stabilise at the new figure before deciding what to do, he/she will not be protected from loss of control. All this led to a change in training emphasis in the GFA training system. (For an expansion of the foregoing read Mike Valentine's article 'The turn-back following engine failure'.) When preparing this module I asked the late Tony Hayes — a very experienced, enthusiastic and highly respected AUF CFI — a few questions. The following was his response: "I do not actually teach engine failures in the traditional sense of yank the power and "What are you going to do now?" type of thing. That is not teaching, it is checking correct response to something already taught. That is a bit of a non-event with my students as I expect the aircraft to be continually positioned so it has an escape route, if it is not so positioned then I work on the area via fundamentals of positioning rather than alarming and depressing demonstrations of why it is wrong! So my actual 'emergency training' happens in separate areas that include circuit planning, speed management, theory and practical glide appreciation. The whole lot revolves around one single concept that I would very much like the AUF to adopt as standard (it is standard in the gliding world) and that is 'safe speed near the ground'! In the theory area (which I do quite early as part of the fundamentals of control) I use the total drag curve rather than the more abstract polar curve. The interaction between parasite and induced drag is quite clear and the most energy efficient airspeed is clearly understood. To this is then superimposed the speed loss from an abrupt power failure and the average reaction time of a pilot at normal flying arousal levels. On a Thruster this is about 7 knots. 48 + 7 = 55 knots (which is also close to the aircraft's normal conditions approach speed). This is the 'safe speed near the ground' and I insist it is present at any time we are at or below normal circuit height. This is effectively an insurance policy. The aircraft may now sustain a total power failure and will automatically start returning to maximum efficient airspeed by itself, while the pilot wakes up, and so conserves height. This also ensures that there can be no loss of control. The alternative is a probable climb on the low speed side of the drag curve with increasing sink rates and decreasing glide angles. More to the point is that diving the aircraft to get airspeed back will dump height alarmingly fast. What I need to get across is a clear concept in the student's mind that the energy level in low-inertia, high-drag machines is equally as critical as positioning. A well positioned aircraft flown at the correct airspeed can recover. If flown too slowly at the point of failure, even though the angles and distance are right, the dive to recover airspeed will put the aircraft too low and may make recovery impossible! Those speed differences are not terribly alarming in themselves — just 5 or 6 knots is all it takes; which is probably one reason GA pilots get into trouble with ultralights. Once in the undershoot situation from a botched recovery then the scene is set for an attempted 'stretch the glide' and the consequent classic stall/spin. That is also important. Actual sink rates are only really apparent near the ground and the pilot is instinctively going to start pulling back to ease sink, still with a substantial amount of turning to do, and flying too slowly in the first place. The next major step after energy management is beginning to develop is a lot of passive instruction on circuit positioning via observation rather than being involved in actual circuit planning. I do a lot of control and direction refinement at a very early stage while flying the standard circuit pattern but not have the student even aware of what a circuit actually is. Once I come to circuit planning I can then quickly establish the reasons for distance/angle relationships for the type being used and the student is already well used to looking at them. Once we arrive at the point that engine failures are normally 'taught' then instead of teaching them, per se, I teach 'glide appreciation'. This validates the circuit pattern positioning. It is fully briefed on a whiteboard and the student is then pre-warned in the air. There is NO surprise element at all! The student then (with a clear mind) soaks in all the clues and retains them. Rather than becoming a sweaty terrified mess with a clear impression there is hardly any time to do anything, I find my students really enjoy putting their skills to use and everything clicks into place. Still not really finished yet though. When teaching circuit re-joins I instill the concept that while the prime interest is how to get down at a strange airfield (and we do take students to other local airfields 10 minutes flying away) they should deliberately do one extra orbit for the express purpose of looking at the 'way out' when they leave. And that, in my book, is the real key to emergencies – total situational awareness and then controlling the situation! Fly defensively (without huge effort but as a consequence of sound training so you do it automatically). Last year one of my students on 3rd solo had a major engine failure on climb out — which was bloody tough luck but underlines that it can happen. He was correctly positioned, at the correct energy level, and recovered back onto the airfield from a cross wind landing — no problems and no further damage! Knowing your aircraft, taking the time to consider conditions and study a strange airfield, having then a pre-prepared 'what if' game plan in advance will all result in pre-made decisions that only have to be refined if something does happen. This will control over 90% of engine failure drama. STRICT COPYRIGHT JOHN BRANDON AND RECREATIONAL FLYING (.com)
 -
 The first three modules in this "Coping with emergencies" guide deal with the circumstance where: an immediate landing is forced upon the pilot in command because of engine/propeller failure or fuel starvation/exhaustion or carburettor icing the aircraft remains under control, at least up to the initial impact with the terrain, trees or a water surface all efforts are primarily directed to avoid/minimise injury to persons rather than trying to minimise damage to the aircraft or other property. Skill in forced landing approaches is a vital asset that can only be developed, and maintained, by regular practice and self-assessment. There is no economic way for a pilot to practise vehicle control following first impact on rough terrain. However, competence in accurate handling of the aircraft in adverse conditions, at least up to the final stages of the approach, can be achieved by regular simulations of engine failure from all flight states. Low flying training for the final stages of the forced landing approach — where to survive the pilot may have to manoeuvre an aircraft without power at slow speed around trees or under powerlines — is best undertaken with an experienced bush pilot. See the Safety brief: loss of control in low-level turns. There is some element of chance in every emergency landing (Murphy's Law proposes that what can go wrong will go wrong, and at the worst possible time) but being well prepared is by far the most important factor in deciding the outcome. The main constituent of that preparation is for the pilot to know the aircraft and – faced with the situation where there is no option but to put it down immediately — keep cool, maintain command of the aircraft, decide the landing site (if this is an option) and fly the approach by maintaining a suitable flight speed, and touch down at the lowest controllable vertical and horizontal flight speeds with the wings level and the aircraft in a nose-up attitude — even if landing in tree-tops. That is, the pilot must maintain complete control of the flight path, airspeed, sink rate and attitude right up to the point of first impact. A bit of fear is normal — even desirable — but excessive stress may cause the pilot to concentrate on very few features of the situation to the detriment of other equally important features. Panic or acceptance that there is nothing much she or he can do about the situation will not improve the outcome, but applied knowledge will ensure the best possible result. Before continuing with this page I suggest you review the document 'Airmanship, flight discipline and human factors training'. 7.1.1 Know the best lift/drag ratio L/D and the angle of attack The maximum L/D ratio (pronounced "L over D") for light aircraft — a measure of the aerodynamic efficiency — is usually between 6 and 12. However there is a very wide range; that for a powered 'chute is probably about 3 while some of the recreational aircraft designed with wide span, high aspect ratio wings — to provide soaring capability — have much higher maximum L/D. For example, the Alpin TST-3 motor glider achieves an L/D of 33 when the engine is stowed within the fuselage and can achieve a minimum sink rate of only 150 feet per minute. However, when the elastic breaks most powered recreational aircraft exhibit the flight characteristics of a very low-performance glider — or worse. (Surprisingly perhaps, most Boeing and Airbus jet transports have maximum L/D around 17–18; better than their piston-engined predecessors.) Maximum L/D usually occurs at an angle of attack between 4° and 5° or where the CL is around 0.6. — L/Dmax is sometimes termed the glide ratio because for light aircraft it is just about the same ratio as distance covered/height lost in an engine-off glide at the optimum still-air gliding speed. For example, if L/Dmax = 8 then the glide ratio is 8:1 meaning the aircraft might glide a horizontal distance of 8000 feet for each 1000 feet of height lost, in still air with the wings held level. We can use the '1-in-60' rule to calculate the angle of the glide path relative to the horizon, for example L/Dmax = 10 then 60/10 = 6° glide path angle. If the aircraft is maintained in a glide at an airspeed higher or lower than L/Dmax then L/D will be degraded and the glide path will be steeper; for example if L/D is degraded to 8 then 60/8 = 7.5° glide path angle. Because of the slight flattening of the curve around L/Dmax, the aoa — and thus the airspeed that will provide maximum air distance travelled from the potential energy of height — is more akin to a limited range rather than one particular best glide speed. An aoa either side of that top arc of the curve results in higher drag and thus a decrease in L/D and less air distance travelled without power. However, we may also need to glide at a speed that results in the lowest rate of sink (the vertical component of the velocity vector) so providing the longest time in the air from the potential energy of height. The lowest rate of sink occurs at the minimum value of drag × velocity and the corresponding minimum descent airspeed may be around 80% of the L/Dmax speed. So, the aircraft is moving rather slowly and will not cover as much distance as when moving at the best glide speed, but will take a little longer to lose height. See the speed polar diagram in section 1.2. Forces in the glide In a gliding descent, the forces are as shown in the diagram on the left. In the case of a constant-rate descent the weight is exactly balanced by the resultant force of lift and drag. From the dashed parallelogram of forces shown it can be seen that the tangent of the angle of glide equals drag/lift. For example, assuming a glide angle of 10°, from the abridged trigonometrical table the tangent of 10° is 0.176, so the ratio of drag/lift in this case is then 1 : 5.7. (This is a little little more accurate than using the '1-in-60' rule but inconsequential anyway.) Conversely we can say that the angle of glide is dependent on the ratio of lift/drag at the airspeed being flown. The lower that ratio is, then the greater the glide angle — and consequently the greater the rate of sink and the lesser the distance the aircraft will glide from a given height. The rate of sink is the resultant of the gliding angle and the airspeed. Be aware that the aircraft manufacturer's quoted L/Dmax may be overstated and generally will not take into account the considerable drag generated by a windmilling propeller so, for glide ratio purposes, it might be advisable to discount the quoted L/Dmax by maybe 20%. But the best option is to check it yourself. 7.1.2 Know the best glide and minimum descent airspeeds The aoa associated with maximum L/D decides the best engine-off glide speed (Vbg) according to the operating weight of the aircraft. There are two glide speeds that the pilot must know and, more importantly, to also be familiar with the aircraft attitude — in relation to the horizon — associated with those airspeeds, so that when the engine fails you can immediately assume (and continue to hold) the glide attitude without more than occasional reference to the ASI. • Vmp — minimum power — the speed that results in the lowest rate of sink in a power-off glide, providing the longest time in the air from the potential energy of height. The lowest rate of sink occurs at the minimum value of drag × velocity and may be around 80% of Vbg. Vmp is the airspeed used by gliders when utilising the atmospheric uplift from thermals or waves. This is the airspeed to select if you are very close to a favourable landing site with ample height and a little more time to plan the approach would be welcome. It is also the airspeed you should reduce to in the last stage of a forced landing in order to minimise both vertical and horizontal velocities, and thus impact forces. Vmp decreases as the aircraft weight decreases from MTOW, the percentage reduction in Vmp is half the percentage reduction in weight. So, if weight is 10% below MTOW then Vmp is reduced by 5%. Vbg is also reduced in the same way if weight is less than MTOW. • Vbg — the best power-off glide — the CAS that provides minimum drag thus maximum L/D, or glide ratio; consequently this provides greatest straight-line flight (i.e. air) distance available from the potential energy of height. The ratio of airspeed to rate of sink is about the same as the L/D ratio, so if Vbg is 50 knots (5 000 feet per minute) and L/Dmax is 7 then the rate of sink is about 700 fpm. This 'speed polar' diagram is a representative plot of the relationship between rate of sink and airspeed when gliding. Vmp is at the highest point of the curve. Vbg is ascertained by drawing the red line from the zero coordinate intersection tangential to the curve: Vbg is directly above the point of contact. Stall point is shown at Vs1. Much is said about the importance of maintaining the 'best gliding speed' but what is important is to maintain an optimum glide speed; a penetration speed that takes atmospheric conditions into account; for example, sinking air or a headwind. The gliding community refers to this as the speed to fly. The normal recommendation for countering a headwind is to add one third to one half of the estimated wind speed to Vbg, which increases the rate of sink but also increases the ground speed. For a tailwind, deduct one third to one half the estimated wind speed from Vbg, which will reduce both the rate of sink and the groundspeed. Bear in mind that, for safety, it is better to err towards higher rather than lower airspeeds. To illustrate the speed to fly, the polar curve on the left indicates the optimum glide speed when adjusted for headwind, tailwind or sinking air. For a tailwind the starting point on the horizontal scale has been moved a distance to the left corresponding to the tailwind velocity. Consequently the green tangential line contacts the curve at an optimal glide speed that is lower than Vbg with a slightly lower rate of sink. This is the opposite for a headwind — shown by the purple line. For sinking air the starting point on the vertical scale has been moved up a distance corresponding to the vertical velocity of the air. Consequently the pink tangential line contacts the curve at a glide speed higher than Vbg. If you want further explanation of speed polar curves (with excellent diagrams) read this article on glider performance airspeeds. The foregoing does not apply to a powered parachute as the glide speed is normally fixed at the aircraft's designed speed. 7.1.3 Know the effect of a windmilling propeller The angle of attack of a fixed-pitch propeller, and thus its thrust, depends on its pitch, the forward speed of the aircraft and the rotational velocity. Following a non-catastrophic engine failure, the pilot tends to lower the nose so that forward airspeed is maintained while at the same time the rotational velocity of the engine/propeller is winding down. As the forward velocity remains more or less unchanged while the rotational velocity is decreasing, the angle of attack must be continually decreasing. It is possible (depending on the particular PSRU, blade angle etc.) that at some particular rpm, the angle of attack will become negative to the point where the lift component becomes negative (reverses) and the propeller may autorotate; in effect, driving the dead engine as an air pump. This acts as greatly increased aerodynamic drag, which adversely affects the aircraft's L/D ratio and thus glide angles. The parasitic drag (including the 'reversed thrust') is greater than that of a stationary propeller. The engine rotation may cause additional mechanical problems if oil supply is affected. In the diagram, the upper figure shows the forces associated with a section of a propeller blade operating normally. The lower figure shows the forces and the negative aoa associated with the propeller now windmilling at the same forward velocity. Thus both Vbg distance and Vmp time are adversely affected by the extra drag of a windmilling propeller, which creates much more drag than a stopped propeller following engine shut-down. If the forward speed is increased, windmilling will increase. If forward speed is decreased, windmilling will decrease. Thus, the windmilling might be stopped by temporarily reducing airspeed possibly to near stall — so that the reversed thrust is decreased to the point where the engine airpump torque and friction will stop rotation. This is not something that should be attempted without ample height. However, do not attempt to halt a windmilling propeller unless: (1) you have more than ample height to recover from a possible stall; and (2) stopping it will make a significant difference to the distance covered in the glide. Sometimes it may not be possible to stop the windmilling. Never be distracted from the job in hand by trying to stop a two-blade propeller in the horizontal position in order to minimise propeller damage during the landing. Should the PSRU fail in flight, the propeller is thereby disconnected from the engine and may 'freewheel' rather than 'windmill'. A variable-pitch propeller may have a feathering facility, which turns the blades to the minimum drag position (i.e. the blades are more or less aligned fore and aft) and thus stops windmilling when the engine is no longer producing power. Such a feature is not usually fitted to a single-engine aircraft, but a few powered recreational aircraft are designed with very low parasitic drag plus wide span, high aspect ratio wings that provide L/D ratios around 30:1, and thus have excellent soaring capability. Propeller parasitic drag will have a relatively high effect on the performance of such aircraft so they are usually fitted with a feathering propeller. The image at left is from a FAA Special Airworthiness Information Bulletin (please read) and shows the change in equivalent parasite drag for both a windmilling propeller and a stationary propeller at blade angles from fully flat to feathered. It can be seen that, in this particular case, the windmilling propeller produces more drag than the stationary propeller up to blade angles of 18 degrees or so. It can be inferred from the preceding material that the windmilling vs stationary drag characteristics for aircraft/propeller combinations will be subject to considerable variation. 7.1.4 Know the practical glide ratio and terrain footprint For accuracy you should measure (preferably by stop-watch and altimeter) the actual rate of sink achieved at Vbg with the throttle closed (engine idling), and from that you can calculate the practical glide ratio for your aircraft. The practical glide ratio is Vbg (in knots multiplied by 100 to convert to feet per minute) divided by the rate of sink (measured in fpm). For example, the glide ratio when Vbg is 60 knots and actual rate of sink is 750 fpm = 60 × 100/750 = 8; thus in still air that aircraft might glide for a straight line distance of 8000 feet for each 1000 feet of height. These measurements should be taken at MTOW and then, if a two-seater, at the one person-on-board [POB] weight with the reduced Vbg. The airspeed used should really be the TAS but, if the ASI is known to be reasonably accurate, using IAS will err on the side of caution. Also with the engine idling, a fixed-pitch propeller will probably be producing drag rather than thrust, so that too will be closer to the effect of a windmilling propeller. You should also confirm the rate(s) of sink at Vmp. Having established the rates of sink you then know the maximum airborne time available. For example, if the rate of sink at Vbg with one POB is 500 fpm and the engine fails at 1500 feet agl then the absolute maximum airborne time available is three minutes. If failure occurs at 250 feet whilst climbing then time to impact is 30 seconds — but 3 or 4 seconds might elapse before reaction occurs plus 4 or 5 seconds might be needed to establish the safe glide speed. Read the section on conserving energy in the Flight Theory Guide. Following engine failure it is important to be able to judge the available radius of action; i.e. the maximum glide distance in any direction. This distance is dependent on the following factors, each of which involves a considerable degree of uncertainty: the practical glide ratio the topography (e.g. limited directional choice within a valley) the height above suitable landing areas turbulence, eddies and downflow conditions manoeuvring requirements the average wind velocity between current height and the ground. The footprint is shifted downwind; i.e. the into-wind radius of action will be reduced while the downwind radius will be increased. The wind velocity is going to have a greater effect on an aircraft whose Vbg is 45 knots than on another whose Vbg is 65 knots. Atmospheric turbulence, eddies and downflows will all contribute to loss of height. Rising air might reduce the rate of descent. Considering the uncertainties involved (not least being the pilot's ability to judge distance) and particularly should the engine fail at lower heights where time is in short supply, it may be valid to just consider the radius of the footprint as twice the current height — which would encompass all the terrain within a 120° cone and include some allowance for manoeuvring. The cone encompasses all the area contained within a sight-line 30° below the horizon. If you extend your arm and fully spread the fingers and thumb the angular distance between the tips of thumb and little finger is about 20°. There is a drawback, in that total area available from which to select a landing site is considerably reduced; the area encompassed within a radius of 60% of the theoretical glide distance is only about one third of the total area. For powered 'chutes the radius of the footprint might be equivalent to the current height, providing a 90° cone from a sight-line 45° below the horizon. 7.1.5 Know the height lost during manoeuvres Any manoeuvring involved in changing direction(s) will lead to an increased loss of height and thus reduce the footprint. This reduction will be insignificant when high but may be highly significant when low. The increase in height loss during a gliding turn is, of course, dependent on the angle of bank used and the duration of the turn. Properly executed, gently banked turns that only change the heading 15° or so produce a small increase in rate of descent and a slight reduction in the margin between Vbg and stalling speed. Steeply banked turns through 210° will produce a significant increase in rate of descent, and a major reduction in the margin between Vbg and stalling speed. It is height loss per degree turned, rather than sink rate, which is important. So, you should be very aware of the height loss in 30°, 45° and 60° changes of heading because they are representative of the most likely turns executed at low levels. Just because an aircraft has a good glide ratio does not mean it will perform equally well in a turn; it may lose more height in a turn than an aircraft that has a poorer glide ratio. For example, a nice slippery aircraft with a glide ratio of 15 may lose 1000 feet in a 210° turn, whereas a draggy aircraft with a glide ratio of only 8 might lose only 600 feet in a 210° turn. Of course, the radius of turn is greater in the faster, slippery aircraft. Steepening the final descent path If it is necessary to steepen the descent path to make it into a clearing, it is recommended using full flaps and/or a full sideslip, and a sideslipping turn from base. A series of 'S' turns will reduce the forward travel. These techniques are certainly not something tried out for the first time in an actual emergency; they should only be used after adequate instruction and adequate competency has been reached — and maintained. The use of full flaps plus full sideslip may be frowned upon by the aircraft manufacturer, but in an emergency situation use everything available. Except for 'S' turns, these techniques are not available with weight-shift aircraft. For powered 'chutes braking both wings simultaneously will slow the aircraft and increase rate of sink but excessive braking may stall the wing. Please read the 'Safety brief: loss of control in low-level turns' section of the Flight Theory Guide before continuing. 7.1.6 Know the height loss in a turn-back following engine failure If the engine fails soon after take-off the conventional and long-proven wisdom is to, more or less, land straight ahead — provided that course of action is not going to affect others on the ground — for example, put you into a building. If the engine fails well into the climb-out one of the possible options is to turn back and land on the departure field. If the take-off and climb was into wind and a height of perhaps 1500 feet agl had been attained (and the rate of sink is significantly less than the rate of climb) then there would be every reason to turn back and land on that perfectly good airfield. There might be sufficient height to manoeuvre for a crosswind landing rather than a downwind landing. On the other hand, there will be a minimum safe height below which a turn-back for a landing in any direction could clearly not be accomplished. To judge whether a safe turn-back is feasible the pilot must know the air radius of turn and how much height will be lost during the turn-back in that particular aircraft in similar conditions, then double it for the minimum safe height. Such knowledge can only be gained by practising turn-backs at a safe height and measuring the height loss. Turning back to land on, or parallel to, the departure runway requires a turn through maybe 210° onto an intercept path for the extended runway line. At interception a small opposite direction turn may be needed to align with the selected landing path. If the take-off has a crosswind component, the initial turn should be conducted into the crosswind so that it will drift the aircraft back toward the extended runway line and reduce the ground radius of the turn. If the take-off has been downwind then the minimum height for a turn-back would be greatly increased. Any doubt whatsoever — do not turn back. Of course, if you have departed from a large aerodrome rather than a small airstrip then there is ample cleared area available for a landing; there is no need to opt just for a runway. Radius of turn and height loss In a turn-back to land on the departure runway it is important to minimise both the distance the aircraft moves away from the extended line of the runway and the time spent in the turn. The slowest possible speed and the steepest possible bank angle will provide both the smallest radius and the fastest rate of turn. However, these advantages will be more than offset by the following: When the steepest bank angle and slowest speed is applied, the necessary centripetal force for the turn is provided by the extra lift gained by increasing the angle of attack ( or CL) to a very high value. Also, due to the lower airspeed, a larger portion of the total lift is provided by CL rather than V². Consequently the induced drag will increase substantially. When turning, it is not L/D that determines glide performance but rather the ratio to the drag of the vertical component of lift [Lvc] that offsets the normal 1g weight, or Lvc /D. Thus, due to the increase in induced drag, Lvc /D will be less than normal L/D, resulting in an increase in the rate of sink and a steeper glide path. Lvc /D degrades as bank angle in the turn increases. See the diagram 'turn forces and bank angle' and read the text that follows it. The stall speed increases with bank angle, or more correctly with wing loading; see wing loading in a turn. Thus the lowest possible flight speed increases as bank in a gliding turn increases. Any mishandling or turbulence during turns at high bank angles and low speeds may result in a violent wing and nose drop, with substantial loss of height; see 'Safety brief: loss of control in low-level turns'. Choosing the bank angle In some faster aircraft it might be found that the turn-back requires a steep turn, entered at a safe airspeed (e.g. 1.2 × Vsturn), where the wings are slightly unloaded by allowing the nose to lower a little further throughout the turn. Then, having levelled the wings, convert any airspeed gained into saving altitude by holding back pressure until the airspeed again nears the target glide speed. The bank angle usually recommended is 45°, because at that angle the lift force generated by the wing is equally distributed between weight and centripetal force, although the Vsturn will be increased to about 1.2 × Vs1. Thus the safe airspeed would be 1.2 × 1.2 × Vs1 = 1.44 Vs1. (The speed 1.5 Vs1 is usually accepted as a 'safe speed near the ground' for gentle manoeuvres.) If the aircraft has a high wing loading, the sink rate in a steep turn may be excessive. Refer to 'turn forces and bank angle'. For aircraft at the lower end of the performance spectrum it may be found that a 20° to 25° bank angle provides a good compromise, with an appreciable direction change and a reasonable sink rate. There may be other techniques for an aircraft fitted with high lift devices. All of this indicates that performance will vary widely, and you must know your aircraft and establish its safe turn-back performance under varying conditions — otherwise don't turn back! More turn-back discussion can be read in 'The turn back: possible or impossible — or just unwise?' STRICT COPYRIGHT JOHN BRANDON AND RECREATIONAL FLYING (.com)
 -
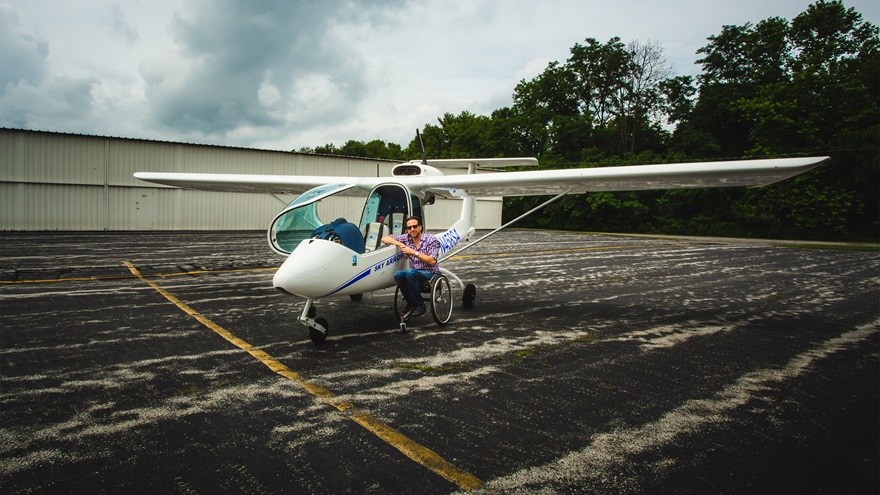 Tales are legion of aviators who rose to a mighty challenge. But those annals are incomplete unless you include the inspirational stories of a courageous cadre of contemporary fliers known as the Able Flight pilots. Able Flight, based in Chapel Hill, North Carolina, is a charitable organization founded in 2006 by nonprofit executive and aviation media figure Charles Stites “to offer people with disabilities a unique way to challenge themselves through flight and aviation career training, and by doing so, to gain greater self-confidence and self-reliance.” As Able Flight’s executive director, Stites designed a scholarship program to make that challenge available to people with disabilities by offering joint flight training courses with Purdue University in West Lafayette, Indiana, and Ohio State University in Columbus, Ohio. The Able Flight class of 2020 consisted of 10 individuals from around the United States—some of whose long-awaited opportunities to fly have been further complicated by an unforeseen adversary: the coronavirus pandemic. As the nation celebrated the thirtieth anniversary of the signing of the Americans with Disabilities Act in July, we checked in with past graduates of Able Flight’s scholarship program in hopes of hearing a shot of news from aviation’s front lines and some words of inspiration to share with others who may be trying to map out life’s plan in light of a life-changing event. We were not disappointed. Sean ODonnell of Pennsylvania and Justin Falls of North Carolina are Able Flight alumni who earned their pilot certificates and are forging into the future—two adaptive-aviation pioneers whose efforts to fulfill their dreams have blazed a trail for others to follow. Sean ODonnell, Class of 2007 Any FBO or flight instructor should pay attention and probably take notes when ODonnell, who took his Able Flight training in 2007, talks about giving a passenger a ride in his two-place tandem light-sport pusher-prop-driven Sky Arrow with adaptive hand controls—because what he is describing is the perfect introductory flight. Not just the route, the length of the flight, and the sightseeing selections he uses—the intro starts on the ground and covers all the bases in an easy-to-process presentation to make the passenger feel involved and at ease. ODonnell gauges how much interest the passenger has in the nitty-gritty, and if it seems appropriate, he will demonstrate some mild maneuvers and perhaps cap the flight with a power-off landing. He’s always on the lookout for negative small-airplane myths to dispel—and when he spots one, he is “more than happy to engage that person,” he said, adding, “All fear stems from lack of knowledge.” ODonnell was the second Able Flight scholarship award recipient and the second recipient to earn a pilot certificate. For many years he worked as the director of distance learning education at his alma mater, Villanova University, where he also created an award-winning distance learning program (making him an expert in a field many individuals and institutions are discovering on the fly these days because of the pandemic). ODonnell, who as a high school senior had suffered a paralyzing injury when a car pulled out in front of his motorcycle, also founded Philly Sport Pilot, a training facility for sport pilots that included serving people with disabilities. “Before COVID, [distance learning] was a debate,” he said, noting that much of the know-how now urgently being sought by institutions large and small was known in the 1990s, long before distance learning had overcome the considerable resistance that has still not entirely disappeared. “Now everyone is making the shift,” added ODonnell, who now works in the software industry as a product manager, having “dabbled” in the field for years. He continues to consult with numerous universities on distance learning concepts. “It’s not flying but it’s great,” he said, confiding that he harbors hope of one day having the opportunity to “travel and promote aviation in any way I can.” It will be aviation’s gain when he does. Justin Falls, Class of 2016 Falls says it was worth the time it took to tweak the hand-control modifications of his Zenith 750 light sport airplane now that he can make slick landings like this one in Jefferson City, Missouri, on a cross-country flight. But there’s something Falls likes even more about the modified factory-built LSA he bought from Zenith owner Sebastien Heintz in 2018: Now other people with disabilities will be able to train to become pilots in his airplane. The Able Flight Class of 2016 pilot became quadriplegic as a result of a neck injury when he was in college. As a pilot he appreciates that he never has to take his hands off the controls during flight thanks to a working collaboration he forged with Zenith to design and refine the control system. He also likes the easy access the aircraft provides him, and he values its capacity to transport his wheelchair to his destinations when he launches from his home base in at Lincolnton-Lincoln County Regional Airport. Inspired by the access to aviation that the Able Flight program provides, it is especially meaningful to him that other student pilots will be able to receive dual instruction in the airplane, following two participants who have done so to become sport pilots. “I wanted to continue that,” he said. Flying was “nowhere on my radar” when Falls was recovering from his injury. But as he began to look into how to get involved in adaptive sports—now he is a competitor in wheelchair rugby and tennis—“I realized that there are a lot more things that you can do in an adaptive capacity,” he said. Having grown up near a general aviation airport and attending many airshows there, the idea of flying came to mind. He found videos online of “guys flying with hand controls,” and his web searches brought him into contact with Able Flight. The big moment came in 2016 when he became an Able Flight scholarship recipient about the same time he began to put his academic endeavors to work as a pharmacist at the Frye Regional Medical Center in Hickory, North Carolina. The medical center encouraged him to fly and gave him time off to get his pilot certificate. “That year alone, the job, flying—I was on cloud nine, just like another level,” he said. “I felt like I could do anything.” Flying for fun continues as time permits for the busy pharmacist, who as a health-services professional sometimes endures hardships imposed on the health care sector by the coronavirus pandemic, including coping with shortages of medications for patients. Falls recently took a passenger on a flight to Gilliam-McConnell Airfield in Carthage to enjoy open-air barbecue at an airport restaurant. He is discovering, as all pilots do, that each flight delivers a unique lesson. On the Carthage run it was experiencing unusual in-flight visibility conditions caused by a Saharan dust plume that had been blown across the Atlantic Ocean to envelop parts of the east coast in late June. Falls encourages any person with disabilities who longs to fly to check out the success stories of pilots with a wide range of disabilities on the Able Flight website, and he thinks most viewers will find the results promising—and perhaps even prompt a scholarship application. Next, he said, a prospective pilot should make inquiry at the local airport and take action to go up with an instructor on an introductory flight. Get a clear idea of what is involved in learning to fly, he said, because although it is fun, “this is hard work.” It may take time to locate or develop an adaptive aircraft that suits an individual’s unique needs—in his own experience, getting the hand controls ironed out took two years—but patience and diligence can pay off. Then, if after laying the groundwork everything looks right, “Go for it, absolutely, 100 percent,” he said.
 -
 Wingsuit flying certainly captured folks' attention when it first hit the mainstream around the turn of the millennium, sparking a wave of GoPro and Red Bull videos. Human flight had never been so personal or so physical as these intrepid maniacs half-fell, half glided through rocky gaps and mountain passes like turbocharged flying squirrels. The name of the game quickly became to see how close you could fly to things without hitting them, in search of the ultimate rush and the biggest view counts. But these devices were limited in that your only source of acceleration was gravity itself, and your flight profile could only ever take you downward. No longer. Stuntman Peter Salzmann had been thinking for years about how to add some sustainable propulsion and climbing ability to the wingsuit experience, and he hooked up with creative consultants at BMW's Designworks studio to create a chest-mounted set of electric impellers and a wingsuit that would work with them. At first, he wanted to mount the props in a backpack arrangement, in longer tubes capable of generating more thrust. But the most advantageous airflow would be in front of him, and he found the initial design too heavy. So a chest mounted system it was, with two 5-inch (13-cm), 25,000 rpm impellers in a relatively compact but still pretty chunky unit that has a bit of a submarine kind of look to it. The wingsuit was designed to incorporate air inlets for the propulsion system. There's an on/off switch, a two-finger throttle and a kind of steering facility, as well as a cutoff switch for emergencies. Otherwise, she's even more of a physical thing to fly than a regular wingsuit; you need plenty of core and limb strength to fight the wind and control your motion in the air. The props put out a relatively modest combined 15 kW (20 hp) for around five minutes, but the results are pretty epic; a regular wingsuit's most horizontal glide ratio drops around a meter for every three meters traveled horizontally, and speed tops out around 100 km/h (62 mph), but when Salzmann hits the electric boost, he can hit speeds over 300 km/h (186 mph), and actually gain altitude to fly upwards instead of constantly dropping. After wind tunnel testing, both in BMW's more auto-focused facilities and in a specialized wingsuiting wind tunnel in Stockholm, and around 30 test jumps, it was time for a public demonstration. The initial plan was to demonstrate the suit's climbing capability by taking it to Busan, Korea, and flying over a group of three skyscrapers, in which the final one was much higher than the first two. COVID-19 put paid to that aspiration, so Salzmann settled for something prettier and closer to home, lining up the Del Brüder peaks in the Hohe Tauern mountain range, part of the Austrian alps. Salzmann and a pair of buddies kitted out with regular wingsuits went up to 10,000 feet (3,050 m) in a chopper, counted down, and jumped. The others are there to act as a reference point, and the three hold formation until Salzmann hits the juice and blasts forward. Where his friends have to split off and fly around the final mountain peak, the electric wingsuit allows him to accelerate up and over it. It's not going to blow Yves Rossy's skirt up; the Swiss "Jetman" has four incredibly powerful jet turbine engines on his extraordinary full carbon jetwing design, which allow him to blast off vertically from the ground with computer-controlled stabilization, and shoot vertically upwards like a rocket as well as swooping and soaring like a 400-km/h (250-mph) eagle. But jet turbines are insanely expensive, and so noisy that they rattle windowpanes from miles away. The average wingsuit pilot's chances of ever flying one are very limited. Salzmann's design, on the other hand, looks much more promising. The electric wingsuit has had the full BMW design touch applied to it; it looks very nicely put together, and, dare we say, much more like a product than a prototype. Nobody's saying anything about these things being for sale yet, either now or into the future, but a small electric propulsion unit is not going to cost jet turbine money, and it's hard to imagine an adrenaline-fueled wingsuit pilot in the world that wouldn't be interested in getting that little bit closer to the Icarus dream of soaring through the sky, rising and gliding at will. Indeed, the main issue may turn out to be whether a company like BMW wants its logo on a product that potentially makes its owners go splat. It's one thing to be making promo videos for world-first innovations like this, and another altogether to release these tools into the hands of extreme sportsfolk where the difference between successful and unsuccessful flights can be so gruesome. Things have come a long way since the first "wing suit" flight – a brief and messily fatal leap off the Eiffel tower by Franz Reichelt in 1912 – but wingsuity types don't seem to be able to get their pulses racing without cutting things really fine. Still, I think we can all rest assured that we'll see more of Salzmann and this device as things develop, and that consumer-grade electric wingsuits will soon be a thing, and that this public debut is a significant moment in personal flight and extreme sports. Enjoy the video below.
 -
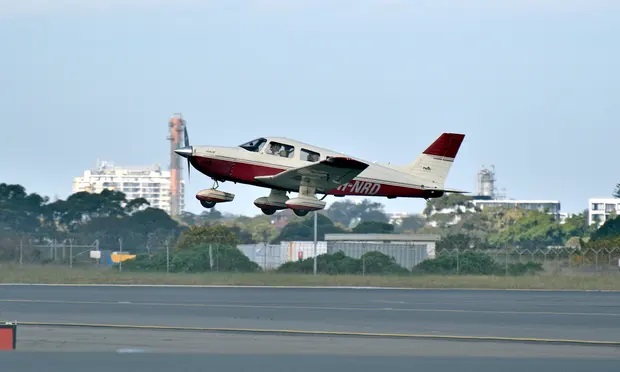 Organiser calls chance to land at big international hub ‘a childhood dream’ The scarcity of commercial flights landing at Sydney airport has been a disaster for airlines and workers, but for hobby pilots the pandemic has provided the opportunity of a lifetime. The quieter than usual runways mean private pilots have been given the chance to land at the international airport for the first time. When the Sydney Flight College club captain, Tim Lindley, put out a call he received an overwhelming response. He eventually organised for 14 light aircraft to fly into Sydney airport on Sunday with 40 people involved. “For a lot of the pilots involved, including myself, it was a childhood dream to land in a big international airport like that – like the airliners,” Lindley said. His group took off from Bankstown airport, where many private pilots usually fly from, came in over Sutherland and landed at Sydney airport. Although the runways weren’t busy, Lindley and his crew still had to navigate some huge aircraft. “Lots of the pilots had passenger jets waiting on the side of the runway, which must have been really funny to watch, with these small little planes coming in,” he said. “When I was taxiing, I had a Jetstar Airbus in front of me and an Air China 767 behind us, and we were all waiting for another one of the club’s aircraft to land.” Lindley – who was flying a Cessna 182 with three passengers on board – had worked with airport staff to make sure the pilots knew what to expect and how to approach an airport of such size. “Coming in to land at an airport like that … there are lots of optical illusions because it’s such a long runway, and because it’s so wide,” he said. “The thing is, the airport is designed to have the pilot sitting 30 feet in the air, so we’re sitting in a little aircraft, and you’re sitting maybe one foot off the ground, none of the signs are aimed at you, so it’s actually incredibly disorientating.” A hobby pilot prepares to land his light aircraft at the quieter than usual Sydney airport on Sunday. Photograph: Lorenzo Hariman The main runway stretches for nearly 4km – far longer than smaller aircraft need to land. Australia’s largest airport usually has a crammed schedule, making it almost impossible for private pilots and hobbyists to land. Some private planes have landed there in the past, but the airport’s airfield operations supervisor, Nigel Coghlan, said the pandemic had allowed the runways to be opened up like never before. “As our airfield is much quieter than usual due to Covid, we’ve been able to review each request and grant access, which for a lot of hobby pilots is a once in a lifetime opportunity,” Coghlan said. “We’ve been able to open up conversations with light aircraft pilots because our airspace is much quieter than usual.” The airport is experiencing 60-90 plane movements a day at present, a huge drop from the 800-900 that ordinarily use the runways. That “significant drop” has had a huge impact on the aviation industry, Coghlan said. For Lindley, it was about making the most of a difficult period. “It was really about turning lemons into lemonade,” he said. “It’s such a horrible situation with Covid, and it’s a really challenging time in aviation, and I just wanted to turn that into something a little bit positive, to keep people flying and keep their dreams alive.” Pilots had to submit a flight plan and book a landing spot. Coghlan and his team then had to adapt to the smaller aircraft and guide them in unfamiliar territory. “We’re certainly not used to the smaller aircraft, so they really keep us on our toes when they arrive,” he said. “Being smaller means they’re harder to see than the jets and turboprops and they don’t make as much noise. It creates a positive challenge for all of us on the airfield.” For some of the hobbyists, he acknowledged, “we’re literally making their dreams come true”.
 -
Hi All, yesterday I started a Page/Database of aircraft accidents and posted 3 to start with, however, I feel a bit iffy about doing them this way. The objective is to create a learning tool to help keep everyone safer and hopefully improve one's flying skills through interactive discussion of the accident. There is a lot of work in adding each record and i don't want to limit it to just Australian accidents as there is the Accidents and Incidents Forum where you guys post these. So, I have removed the Accidents Page/Database and have commenced talks with a very high calibre IPS software developer to create something similar to the old Aviation News section we use have but specifically for aircraft accidents from all around the world. This way we have an automated system to list accidents that can be discussed in a non-public area of the site. It will take a little while for it to be developed, and it won't be cheap, but i think it will be worth it. For those that don't know how we did Aviation News in the past here are some screen shots of the News Reader from many years ago...I don't know at this stage if it will end being like this but it will be developed to achieve the desired objective.

-
The site is going well, in my opinion. There are still a few things to do but I had to get the email system working properly first and then: 1. I can start adding Flying Schools and Clubs in the Groups Section 2. I can start adding Aircraft Manufacturers/Distributors and Agents into the Supplier System However we now have apart from the Forums: Groups - for all your special interest groups of users Blogs - for you to add any aircraft builds and personalised general blogs Events - for all aviation events when they start back up after Covid Media: - A Photo Gallery - A Video Library - Interesting articles to read - Aviation Movie database - Aviation Books database Aircraft - a database on all the different aircraft for you to look up and use as a resource Our Shop - our comprehensive discounted Clear Prop Pilot Supplies shop Classifieds - where you can list your classifieds for free Suppliers - a section for suppliers to the aviation industry...you guys need to populate this Resources: - Free online resources for you to use - Free downloads like copies of books, files and other things - Flying Tutorials...you guys need to populate this area with any tutorials that you can add like Maintenance etc - A Google Earth view on all the different Airfields that you can use and update with the info you may have Members - all the site members, the leaders, staff and more Off Topic - a link for everyone to use to discuss Off Topic areas of interest So, what now? What else do you need that will make this site the overall best resource available to all pilots...I need you to tell me what else you need!!! And don't forget to help populate all the areas of the site...thanks
-
 When the light sport aircraft idea first broke ground 20 years ago, the idea was a new class of airplanes bridging between so-called “fat ultralights” and standard-category airplanes whose inflated prices made them unaffordable save for the wealthy few. Two decades later, has the experiment paid off? Yes, but with some qualifications. Light sport airplanes were supposed to be simpler to build and certify— they are—and although the original design brief didn’t specifically say so, it was assumed they would be cheaper to buy. They are that, too. But only relative to new, standard-category airplanes and not compared to any of dozens of legacy two- and four-place airframes with similar or greater capability. So, are LSAs cheaper to own than equivalent legacy airplanes? The answer depends on how you crunch the numbers, but if investment costs are tallied, the answer is no. If operating costs alone are considered, light sport airplanes look attractive against both legacy airplanes and definitely any new standard-category aircraft. Compared To What? Why do people buy light sport airplanes? Probably for exactly the purpose they were intended: Remaining in the flying game with modern airframes with modest performance. Although light sports haven’t been a runaway sales success, the total population of aircraft totals about 4000 airframes, according to www. bydanjohnson.com, which tracks production by models. And don’t look now, but sales of LSAs have recently accounted for between 19 and 21 percent of all piston aircraft sales, according to Johnson’s site and GAMA reports. (That includes ELSA kits, but not gyroplanes.) In 2018 and 2019, the LSA segment registered 219 and 233 aircraft respectively, against total GA piston sales of 1137 and 1324 for the same years, according to GAMA. Those totals include 80-plus airframes from the five manufacturers who are GAMA members: Icon, Pipistrel, Tecnam, CubCrafters and Flight Design. The rest are from non-GAMA companies. Johnson warns because of fuzziness in the data, a precise market-share calculation is elusive. Still, LSAs have measurable presence. The venerable Aeronca 7AC Champ is the hands-down best value in legacy LSAs. And good luck putting a CTLS on skis, as owner Pete Burns has done with his Champ. As we’ve reported before, the LSA market is nothing if not lousy with variety. Dan Johnson’s site counts a dozen manufacturers delivering modest volume. Recent market leaders include Zenith, Kitfox, Van’s, Rans, Pipistrel, Icon and Progressive Aerodyne. Flight Design once topped the market, but it’s now clawing back after financial retrenchment. The typical price of a well-equipped LSA—and few buyers skimp on options—is north of $150,000. For our survey group of a dozen owners, the average price was $117,000, but some of the owners bought used airframes. The high price was $175,000. At this juncture, you can slice the loaf two ways by asking what else $150,000 buys or what would an equivalent two-place airplane cost? This produces radically different outcomes. The 150 large would get you a nice late 1980s Mooney, a late 1990s Skylane or an early 2000s Skyhawk, for example. But it appears that buyers shopping LSAs don’t engage in that kind of calculus. They aren’t looking for price-value, exactly, as much as they are simple, easy-to-fly and easy-to-maintain airframes. Many of them are stepping down from more capable aircraft, including piston twins and even turbines. If cheap is the overarching driver in a two-place airplane, the pickings, while not necessarily slim, are vintage, not to put too delicate a point on it. Consider the last model year of the Cessna 152, 1986. Find them in the low- to mid-$40s to as much as $90,000 for a fully restored airframe. Piper’s two-place trainer, the Tomahawk, goes for a song and a parsimonious one at that: $14,000 to $20,000. The Beech Skipper is another possibility that’s a better flyer for around $16,000. And don’t forget the venerable forerunner of the 150, the 120/140 series. Again, prices for these are in the $25,000 to $35,000 range and some have been nicely restored. There’s also a passel of Pipers to pick from, including the J-3, the Super Cub, the Colt and even the Tri-Pacer if you want a backseat. The immediate downside of these is most are standard-category airplanes and thus require the pilot to have a medical. While some thought BasicMed would decimate the light sport segment because pilots would have no worries about the medical issue, this is evidently not the case or at least is far less influential than we imagined. Several owners told us medical certification—or lack thereof—was a consideration in their purchase of an LSA and that BasicMed didn’t change that. Cost Of Money Van’s RV-12 has become a popular E/S-LSA. Ian Heritch’s example has flown coast to coast and was purchased new three years ago. For our email survey of a dozen LSA owners, we asked about purchase price, insurance, fuel and hangarage costs and maintenance. But first, let’s dispense with the largish pachyderm on the premises: depreciation. This is always a slippery number, even for legacy airplanes and it’s all but impossible to calculate a meaningful average. For one, there aren’t enough sales of these airplanes to establish take-it-to-the-bank trends and for another, ultimate value is determined between the buyer and seller the moment the check is signed. But let’s do some for instances. A CubCrafters Carbon Cub bought new in 2015 for $200,000 depreciated to $165,000 four years later or about 18 percent. Call it $9,000 per year. A Flight Design CTLS retailed for $156,500 in 2015 and now, according to Aircraft Bluebook, it’s typically worth about $115,000 for a depreciation of 27 percent or about $10,000 a year. For a longer timeline, consider Tecnam’s P92 Super Echo. It sold new in 2008 for $115,000 and now retails for about $45,000 for a loss of 61 percent value over 11 years or a decline of $6000 a year. These exact values matter less than the fact that newer airframes will depreciate more than older ones will and it’s a real part of the cost of ownership. Older airplanes, say ragwings like Cubs and Champs or vintage Cessna 150/152s, will depreciate less or not at all. Some even appreciate slightly with market swings. Although many owners seem to purchase airplanes without financing, if a loan is required, the cost of that money should be added to depreciation. Tallying It Up Apart from purchase, depreciation and cost of money, the next largest expenses will be either fuel or insurance, according to our survey. That’s dependent on how much you fly, but the owners we surveyed averaged about 70 hours a year and reported an average of $19 an hour for fuel. Using those numbers, fuel totals about $1330 a year. Much of the LSA fleet is powered by Rotax 912-series engines and although they’ll burn 100LL, they’re a lot happier on unleaded mogas. Many owners use that or, often, a mix. This may have a slight advantage in conferring better aging of the fuel, but even 50 hours a year on mogas is unlikely to cause varnish or deposit issues. Rotax recommends a shorter oil change interval when avgas is used: 25 hours if 100LL is used 50 percent of the time versus 100 hours if unleaded fuels are burned. Most owners stick to 50 hours or less for oil changes, whether flying with a Rotax engine or a legacy Lycoming or Continental. Insurance is becoming a sticky point for owners and with the market hardening, it may be getting stickier yet. The average insurance cost among our dozen-owner survey was $1534. The highest was $3200 on a recent vintage Flight Design CTLS, the lowest $909 for an RV-12. Straight-up comparisons against legacy two-seaters are difficult because insurance on a Cub, a Champ or a Cessna 152 can cost just as much, depending on hull value. The bigger driver may be pilot age. As the market hardens, more insurers are raising premiums on older pilots, if they’re not turning them down entirely. “Insurance has been $1100 a year. For the May 2020 renewal, it will be $1700 a year for a hull insured at $89,000. Time to lower the value,” said Flight Design owner John Horn. At these prices, more owners may be considering self-insuring the hull or entirely. Operating Costs Bill Spencer in his Legend Cub. “The LSA rules have allowed me to own and fly beautiful and well-equipped new airplanes.” If anything is a constant in aviation, it’s that’s bigger, faster airplanes burn through money at a faster rate and the near-ruinous annual is always in the offing. In that respect, legacy two-seaters and LSAs are definitely less money hungry, starting with annuals. Owners in our survey reported the average cost of an annual as $529. That requires amplification, however. Two of the owners in our survey group invested in a two-week course for the Light Sport Repairman Maintenance rating, which allows them to repair their own airplanes, including annual inspections. While IAs can’t be fashioned in two weeks, we think this rating is a terrific idea. It costs up to $5000, but the real value is in engaging an owner in understanding the airplane, inspecting it for faults and repairing it when needed. In our view, that’s not just a cost benefit, but a safety enhancer, too. We asked owners if they had experienced any unusual maintenance issues, costs or problems that hadn’t been expected. None had, and all said the maintenance expenses were about what they expected or a little less. None had any complaints about the Rotax engines that power most of these aircraft. There were no reports of maintenance disasters such as corroded spars or major, timed-out parts. What to compare the Rotax to? We can think of only three possibilities: the Continental A-65 found in Cubs and Champs, Lycoming’s O-235 or the Continental O-200, the lightened version of which is used in a few LSAs. The A-65 is on par with the Rotax for fuel burn, but the O-200 and O-235 are a tad thirstier. All three legacy engines are stone-age throwbacks compared to the Rotax, which has electronic ignition. The 912 iS also has fuel injection. The Rotax is cheaper to overhaul. Dean Vogel at U.S. Rotax distributor Lockwood Aviation says the base overhaul price for a 912 ULS is $13,500, assuming a good core. A factory-new engine costs $19,000. The price delta between a new O-200 and an overhaul is larger and you can’t even get a new A-65, although new cylinders are available. The A-65 remains a serviceable choice, but overhauls are in the $15,000 to $18,000 range. Vogel told us Lockwood advises owners of high-time or high-use aircraft to make the overhaul decision 500 or so hours before TBO. He said the engine can be sold on the used market to a homebuilder and the owner can then buy a factory-new engine, applying the considerable proceeds from the used engine sale. Tying it Up Owners who bought new or recent used light sport airplanes seem satisfied with the purchase and operating costs and report no unpleasant surprises, nor regrets in having made the purchase. These owners were a mix of step-down buyers and bucket listers who always wanted to own an airplane and found the ability to do that in an LSA. “From my experience, LSA has become an accepted and somewhat vigorous part of U.S. general aviation,” said RV-12 owner Ian Heritch. “Wherever I go, I get only compliments and questions from onlookers. I have experienced no hostility for operating in the airspace system. While not the super-robust category that many were unwisely expecting, LSA has safely, smoothly and successfully joined the U.S. aviation family,” he adds. “If you want to keep flying, this is the way to go,” adds CTLS owner Ben Short. But the design brief is to determine whether an LSA is cheaper to own and operate. It can be, if it’s bought right. If you don’t factor in the steep depreciation a new aircraft suffers the day after you take delivery, then new and used are comparable. “Bought right” to us means an airframe that’s had the painful part of the depreciation already squeezed out of it. That means at least five years old, but 10 would be better. There are bargains out there. A 2006 Flight Design CTSW is still perfectly serviceable and supported with a typical values in the mid-50s. Newer ones with glass panels aren’t much more. Even at the higher purchase price, ownership costs would be competitive with a legacy two-seater. If you can’t find or afford a hangar, a glass airplane can live outside or in a shade hangar, which a ragwing— vintage or newer—cannot. Speaking of ragwings, the Cubstyle airplanes appear to hold value better than other LSAs. Specifically, a five-year-old Carbon Cub still commands $165,000, according to Bluebook. Arch competitor Legend shows similar price stability, making them a good choice if short-term ownership is envisioned. You can get in and out without losing much. That’s true of all of the legacy models that qualify for LSA operation, too. They’ve reached rock-bottom value and aren’t likely to depreciate much at all, if that’s a buying consideration. Some parts for older aircraft are hard to come by, but owners tell us they remain supportable. Just make sure the pre-buy filters out expensive gotchas.
 -
I have finally been able to hopefully fix the email system here on Recreational Flying and wonder whether site notifications are coming up in your Inbox or are going to your Spam folder...can you let me know if there has been any change or whether you are still getting emails from the site in your Spam folder...thanks
-

-
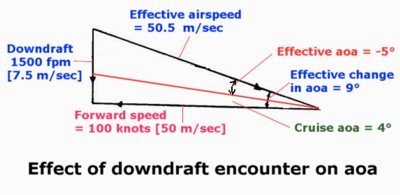 6.7.1 Defining turbulence and wind shear Turbulence It is usual to classify all the changes in atmospheric motion that significantly disturb aircraft flight as turbulence, but in some wind shear events there may be no air turbulence involved. It is difficult to define the degree of turbulence or the load effects of shear in a way that is meaningful to a recreational and sport aviation pilot. Measuring by the airflow velocity change or the gust velocity measured in feet per second doesn't really enable the pilot to judge how turbulent the conditions are in their circumstances, particularly so if the instrument panel is not equipped with an accelerometer or variometer. The following is based on an old ICAO turbulence scale which, though classifying by the induced positive or negative accelerations (only as measured near the aircraft cg), does provide a descriptive definition of sorts that is appropriate for three-axis aircraft, but perhaps not so meaningful for flexible-wing weight-shift aircraft (powered or unpowered) and certainly not meaningful for powered-parachutes or paragliders. Very low — below 0.05g; light pitch, yaw and roll oscillations are experienced. Low — 0.05 to 0.2g; aircraft might experience light to moderate 'chop', i.e. slight, rapid, rhythmic bumps and oscillations but any without significant changes in altitude or attitude. Like driving a boat through a choppy sea. Also known as 'cobblestoning' — like driving at moderate speed on a corrugated gravel road. Moderate — 0.2 to 0.5g; turbulence is becoming significant and the ride produces strong, intermittent, uncomfortable jolts with attitude upsets and indicated airspeed variations, but the aircraft remains in control. The occupants' heads may hit the cockpit roof structure if the clearance is small or the harness is not tight enough. Severe — 0.5 to 1.5g; the aircraft handling in all axes is made difficult but not dangerous except at lower alitudes — if occupants and objects properly secured.There are large, abrupt changes in altitude and attitude, and significant variations in indicated airspeed. Cockpit instruments are difficult to read. Very severe — above 1.5g; the aircraft is violently tossed about, with extreme handling difficulty. Aircraft may be out of control for short periods. Structural damage is possible. The wake vortices from aeroplanes and helicopters add another form of turbulence that is extremely hazardous to all recreational aircraft, particularly because of the strong rotational effects that lead to sudden height loss. Such vortices must be anticipated and avoided. Wind shear In aviation terms, wind shear is a sudden but sustained "variation in wind along the flight path of a pattern, intensity and duration, that displaces the aircraft abruptly from its intended path and sufficiently that substantial and timely control action is needed". Wind shear is probably the greatest hazard to flight at low levels in visual meteorological conditions, but its effect is short-lived. Displacement in the flight path is initiated by a substantial change in lift generation associated with the aircraft's inertia (see Note 1 following). The shearing action between air layers with substantially differing velocities — or vertical gusts and their surrounds — may also induce strong turbulent eddies or breaking waves at the shearing level or interface. Note: inertia is the property of resisting any change in motion, or continuing in the same state of rest or state of motion relative to the Earth's cg. The mass of a body is a measure of its inertia; i.e. its resistance to being accelerated or decelerated by an applied force (such as a change in aerodynamic lift) increases with mass. An aircraft in flight is 'airborne' and its true airspeed is relative to the surrounding air, not the Earth's surface. However, when the aircraft encounters a sudden change in the ambient air energy/velocity — even just a transient gust, horizontal or vertical — inertia comes into play and momentarily maintains the aircraft motion relative to the Earth or — more correctly — relative to space. This changes aoa and airspeed, and imparts other forces (e.g. drag and pitching moments) to the aircraft. A heavier aircraft has more inertia than a lighter one, so is more resistant to irregular, random displacement forces — atmospheric turbulence. The fact that inertia momentarily overrides the physics of aerodynamics is sometimes a cause of confusion. As long as an aircraft's mass remains unchanged so will its inertia whether it is at rest or moving; i.e. motion or pulling g has absolutely no effect on an aircraft's inertia but speed does affect momentum, which is mass (or inertia) × velocity. Wind shear can be induced by the terrain, constructed obstructions, passage of cold fronts, convective downbursts, thermals, temperature inversions, low-level jets and other sources; all of which will be described later. The closer to the surface that the shear occurs the more hazardous for aircraft — and particularly so for very light aircraft. For an aircraft taking off, landing or going around, the shear may be large enough and rapid enough to exceed the airspeed safety margin and the aircraft's capability to accelerate or climb; or the pilot just may not be able to recover an uncommanded roll due to a crosswind gust, before a ground strike occurs. The shear is the rate of change of wind speed and/or direction experienced by the aircraft, Such events tend to be classified as 'vertical' or 'horizontal' shear, though many, perhaps most, shear encounters are a combination of both. There is a third classification — 'vertical gust' shear — which has the greatest potential to produce extreme structural loads and which we will examine first. 6.7.2 Vertical gust shear Gust categorisation Vertical gust shear, chiefly associated with updrafts and downdrafts, is the change in the predominantly vertical air motion with horizontal distance flown. Thermals can produce very severe updraft shear when flying in the unstable, high-temperature superadiabatic boundary layer conditions endemic to inland Australia, though their vertical speed near the surface may be relatively low but accelerating with height. There is a noticeable transition gradient between the surrounding air and a well-ordered updraft/downdraft core; also the ascending/descending column tends to entrain some surrounding air, creating a turbulent interface around it. It is possible that a cruising aircraft suddenly encounters an area of substantial vertical motion. The sudden entry (an aircraft cruising at just 60 knots is moving at 100 feet per second) into such a strong vertical gust is a hazardous form of shear. Apart from fast-rising thermals, such events are also associated with downdrafts from large, vertically developed convective clouds. Note: the categorisation of vertical gusts is not the same as the usual atmospheric turbulence. The meteorological categories for wind gusts in general (as measured with an anemometer) are: Category 1: weak — ≥ 5 m/s to <10 m/s Category 2: moderate — ≥ 10 m/s to <15 m/s Category 3: strong — ≥ 15 m/s to <25 m/s Category 4: severe — ≥ 25 m/s The meteorological categorisation restated for vertical gust measurement might be: Weak — ≥ 16 fps to <25 fps Moderate to strong — ≥ 25 fps to <50 fps Strong to severe — ≥ 50 fps to <80 fps Extreme — ≥ 80 fps (or 66 fps [20 m/s] might be used) Speed conversion table (values rounded) Metres per second Feet per second Feet per minute Knots 5 m/s 16 fps 1000 fpm 10 7.5 m/s 25 fps 1500 fpm 15 10 m/s 33 fps 2000 fpm 20 15 m/s 50 fps 3000 fpm 30 20 m/s 66 fps 4000 fpm 40 25 m/s 80 fps 5000 fpm 50 It is probable that 60% of vertical gusts associated with thunderstorms have velocities of 10 fps or less, while 35% are in the 10 to 25 fps range. An encounter with a gust over 50 fps would be rare — but of course it does happen and always when you don't expect it; see this recreational pilot's report. Vertical gust shear effects On entering a gust, inertia will momentarily maintain the aircraft's flight path relative to the Earth's cg. For a very short period the 'effective airstream' around the wings will no longer be aligned with the flight path but will have acquired a vertical component. So, the aircraft's effective angle of attack [aoa] must alter — with a consequent change in the lift and drag coefficients, plus a change in wing loading. The combination of updraft/downdraft velocity with the aircraft's forward speed also produces a change in the effective airspeed relative to the wing, which also affects the wing loading. But in purely vertical gust encounters, this is very slight in comparison to the aoa change and can be ignored. The reverse happens in encounters with purely horizontal gusts — the aoa change is slight in comparison to effective airspeed change. Most turbulence or shear encounters incorporate vertical, horizontal and lateral components, and will affect aoa, airspeed and attitude. Table 7.1 shows the approximate addition to, or subtraction from, the original aoa experienced by four imaginary aircraft each in level flight at a cruise speed where the aoa is 4° and encountering vertical updrafts or downdrafts of the speed shown. Such angles are readily calculated using the 1-in-60 rule; i.e. angular change = gust speed/aircraft speed × 60. The values in red indicate where the stalling aoa, presumed to be 16°, would be exceeded and thus any gust-induced loading is alleviated (with a momentary delay due the aircraft inertia), but the stall indication is applicable only to updrafts and not downdrafts. I have used these reasonably close approximations: (a) to convert knots to metres per second, divide by 2; (b) to convert knots to feet per minute, multiply by 100; (c) to convert feet per minute to metres per second, divide by 200. Table 7.1: increment or decrement in aoa due to vertical gusts encountered at the cruising airspeeds shown and aoa 4° Vertical component of air current 60 knots (6000 fpm) 75 knots (7500 fpm) 100 knots (10 000 fpm) 120 knots (12 000 fpm) 500 fpm (8 fps) 5° 4° 3° 2.5° 1000 fpm (17 fps) 10° 8° 6° 5° 1500 fpm (25 fps) 15° 12° 9° 7.5° 1750 fpm (29 fps) 17.5° 14° 10.5° 9° 2000 fpm (33 fps) 20° 16° 12° 10° Encounter with an updraft For example let's look at a two-seat aeroplane (we'll call it 'Model A') with a wing area of 10 m², cruising at 50 m/s (100 knots TAS) at its MTOW of 540 kg and at an altitude where the air density is 1 kg/m³ — about 6000 feet. The lift force being produced must equal the gross aircraft weight (mass multiplied by the acceleration of gravity, which is near enough to 10 m/s²), thus the weight is 540 × 10 = 5400 newtons [N] and the lift from the wing must be the same — ignoring the tailplane/canard balance needs. The lift equation in level flight is: lift = CL × ½rV² × S = weight where CL is the non-dimensional lift coefficient, r is the air density in kg/m³, V is the true airspeed in m/s and S is the wing area in m². Substituting the Model A values in the equation, then CL × ½ × 1 × 50 × 50 × 10 = 5400 so the value of CL in the cruise with zero flap must be 0.43 and aoa would be around 4°. The 'lift coefficient — aoa curve' diagram is a generalisation of the relationship between CL and aoa for a normally cambered wing, which reaches the zero lift aoa at around 2° negative, and the critical aoa at 16° where CLmax is 1.3. The slope of the 'lift curve' is such that each 1° aoa change, within the 2° to 12° range, increases/decreases CL by around 0.1. Now suppose our Model A aeroplane cruising at 50 m/s encounters a sharp-edged thermal that has a velocity of 7.5 m/s (1500 fpm or 25 fps), then the aircraft aoa will increase by 9° to about 13°. (Using the 1-in-60 rule: 7.5/50 × 60 = 9.) In addition, the speed of the airflow relative to the wing will increase very slightly to 50.5 m/s as shown in the diagram 'Effect of updraft encounter on aoa' below. (The diagram is much the same as the wind triangle plot you might use in navigation — the 'effective change in aoa' is comparable to the drift angle, and the 'effective airspeed' is comparable to the ground speed.) The lift coefficient increases by around 0.1 per 1° aoa change so the value of CL will now be around 1.3, the 'CL — aoa curve' indicates 1.2. Ignoring the very slight airspeed change we can calculate the lift force produced under the changed conditions: i.e. lift force = 1.2 × ½ × 1 × 50 × 50 × 10 = 15 000 N. Thus entry to the gust has increased CL from 0.43 to 1.2 (i.e. 2.8 times) and induced a momentary increase in total wing loading from 5400 to 15 000 N. This applies a rapid bending moment to the wings, flexing them up but well within the design limit load for normal category aircraft of +3.8g, or 20 520 N (5400 × 3.8) total wing loading for our aircraft. (Design limit loads were discussed in the module 'Don't fly real fast', but be aware that the extension of flaps reduces the limit load factors by as much as 50%.) A very short time after that initial entry into the gust, the inertial effects are overcome, the +2.8g load (15 000/5400) accelerates the aircraft upwards — felt by the occupants as a very severe jolt pushing the seat up under them but also 'felt' as a sudden 2.8g load by all other parts of the aircraft's structure — and the wings' elastic reaction also adds some impetus to the fuselage. The acceleration alleviates the gust loads on the wing while the aircraft restores itself to its trimmed angle of attack and flight continues normally; except that the new flight path will incorporate a rate of ascent relative to the Earth, equivalent to the updraft speed. When the aircraft flies out of the updraft it will again momentarily maintain its flight path relative to the Earth. During that time the effective airflow around the wings will no longer be directly aligned with the flight path but will have acquired a vertical component opposite to that at entry. The aoa and consequently CL will decrease, producing a momentary decrease in wing loading. The airframe will experience a negative g load, and perhaps the occupants will feel the shoulder harness stopping them being thrown out of the seat, before the aircraft is finally restored to level, unaccelerated flight. Encounter with a strong updraft Now let's consider the Model A aircraft cruising at 120 knots (60 m/s) with CL of 0.3 encountering a 2000 fpm (10 m/s or 33 fps) gust. The encounter would increase aoa by 10° and CL to about 1.15, so: lift produced = 1.15 × ½ × 1 × 60 × 60 × 10 = 20 700 N. Thus entry to the gust has produced a momentary increase in total wing loading from 5400 to 20 700 N imparting a +3.8g load (20 700/5400), which is around the 20 520 N wing load limit as well as the 3.8g airframe load limit. The change in load is from +1g to +3.8g, which will impart a 2.8g acceleration. Note that if our aircraft had been cruising at less than 50 m/s, when the 10 m/s gust was encountered the aoa change would exceed 12° and consequently the critical aoa. The airflow over the wing would separate instantly and alleviate the gust load; this is relevant to Va, the design manoeuvre speed. It is also assumed above that the aircraft is in unaccelerated flight when the gust is encountered. If the aircraft were in a 40° banked turn then the manoeuvring load factor would be 1.3g rather than 1g, and the gust-induced load would be added to the basic manoeuvring load. If it were in a 60° banked turn then the basic load would be 2g, and the manoeuvre plus gust acceleration would be 4.8g; this is getting very close to the ultimate load factor and in the zone where component fatigue could cause premature structural failure. Effect of lower aircraft weight If an aircraft is well below MTOW there is a significant effect on structural loads developed in a vertical gust. Let's take our Model A with only one person on board and less fuel so that weight is reduced to 450 kg or 4500 N, again cruising at 60 m/s and still at an altitude where the air density is 1 kg/m³. So substituting those values in the equation then CL × ½ × 1 × 60 × 60 × 10 = 4500 and the value of CL in the cruise must now be reduced to 0.25 and the aoa reduced to about 1°. Now suppose that aircraft encounters the same 2000 fpm (10 m/s) updraft. Then the aircraft aoa will again increase by 10° but to about 11° and CL of 1.05. We can calculate the lift force produced under the changed conditions: lift produced = 1.05 × ½ × 1 × 60 × 60 × 10 = 18 900 N. Thus entry to the gust at the lower weight has increased CL from 0.25 to 1.05 (i.e. 4.2 times) and induced a momentary increase in total wing loading from 4500 to 18 900 N (4.2g). This is well within the 20 520 N (5400 × 3.8) total wing loading limit for this aircraft but outside the 3.8g design load limit for the structural parts — the mounting structures for the engine, battery and occupant seats, for example. So when operating at significantly lower weight (and thus lower wing loading) an encounter with a vertical gust at a particular flight speed will induce greater accelerations than when operating near MTOW, which obviously affects choice of speed in turbulent conditions. Effect of speed From the foregoing we could deduce that the faster a particular aircraft's speed is when encountering vertical gust shear, the lesser the structural loads developed. This is because the change in effective angle of attack will lessen as forward speed increases. However, angles of attack at higher speeds are much lower, so the effective CL change from a gust encounter is then proportionately greater. (But it depends to some extent on the slope of the lift curve and the wing loading.) For example, take our fully laden Model A flying at both 80 knots and 120 knots at 6000 feet; CL at the slower speed would be 0.7 and 0.3 at the faster speed. If, in both cases, the aircraft encountered a 500 fpm thermal the aoa changes would be about 4° and 2.5°, increasing CL to 1.0 and 0.5 respectively. The acceleration would be about 1.4g (1.0/0.7) at the slower speed but 1.7g (0.5/0.3) at the faster, so acceleration loads increase as airspeed increases and that increase is amplified by increasing gust velocity. This doesn't alter the fact that a high wing-loading aircraft will provide a better ride in turbulence than a low wing-loading [W/S] aircraft, at the same high speed. Imagine two different aircraft types having the same weight but different wing area; if they are flying at the same speed and encounter the same vertical gust, the change in aoa and thus CL will be roughly the same for both. However, the low W/S aircraft will experience a higher acceleration because its wing area is greater and thus the total induced load is greater. We will discuss speed to fly in turbulence later in this module. Encounter with a downdraft Now suppose the Model A aircraft cruising at 50 m/s (4° aoa) encounters a sharp-edged downdraft that has a velocity of 7.5 metres/second (1500 fpm). Then the aircraft aoa will decrease by 9° to about 5° negative where, from the CL – aoa curve, CL will perhaps be around 0.2 negative. The airspeed relative to the wing will change slightly but can be ignored. We can calculate the lift force produced under the changed conditions: lift force produced = –0.2 × ½ × 1 × 50 × 50 × 10 = −2500 N A negative value means the lift force is acting opposite to the norm. Thus the entry to the downdraft has produced a momentary change in total wing loading from 5400 N positive to 2500 N negative, producing a 0.5 negative g load (–2500/5400) and resulting in a 1.5g negative acceleration from +1g to –0.5g. The occupants will be restrained by their harnesses while the seat drops away from them. Following initial entry into the downdraft the inertial effects are overcome and the aircraft will restore itself to its trimmed angle of attack and flight will continue normally — except that the new flight path will incorporate a rate of sink relative to the Earth and equivalent to the atmospheric downflow. Note the difference in the acceleration between the 1500 fpm updraft and 1500 downdraft encounter at the same cruise speed — the updraft produced a 2.8g acceleration, the downdraft only a 1.5g acceleration. When the aircraft flies out of the downflow it will again momentarily maintain its flight path relative to the Earth. During that time the effective airflow around the wings will no longer be directly aligned with the flight path but will have acquired a vertical component opposite to that at entry. The aoa and consequently CL will increase producing a momentary increase in wing loading, and the airframe will experience a positive g load before the aircraft is finally re-established in level flight. Thus encountering changes in vertical flow induces momentary changes in aoa and wing loading. The gust accelerations and the variation in the vertical profile of the flight path will be considerable if extensive and higher-speed vertical gusts are encountered. But it's a bit more complex! The foregoing assessments of aircraft reaction to updraft/downdraft shear is simplified, but aircraft reactions are much more complex. For example: the calculations have been done assuming a 'sharp-edged gust' which probably doesn't exist; aircraft designers include a 'gust alleviation factor' in their calculations; the gust-induced aoa change also changes the wing pitching moments; the tailplane is flying perhaps 50 milliseconds behind the wing and will also be affected by the gust loads, so the stabiliser pitching moment will be out of sync with the wing pitching moment and the aircraft will pitch up or down accordingly; air velocity within the gust will not be smooth and constant, yawing and rolling forces will be applied, and buffeting may occur; changes in aoa must result in momentary changes in induced drag but the aircraft's inertia will probably maintain its motion; and a canard aircraft will be affected differently from a tailplane aircraft. The accelerations calculated in the foregoing are those measured at the aircraft's cg. Accelerations at the aircraft's extremities may be much greater due to added yawing, rolling and/or pitching motions and they will also affect the control surfaces. 6.7.3 Surface gusts or low-level wind shear Gust ratios In normal flying weather the velocity of any near-surface wind is changing constantly. Due to the eddies that usually exist within the flow, fluctuations in direction of 20° or so and in speed perhaps 25% either side of the mean, occur every minute. In other than very light wind conditions these variations are evident in the form of wind gusts. In stronger wind conditions, gust ratios (maximum gust to mean wind speed) are typically 1.6:1 over open country and 2:1 or greater over rough terrain, adding more turbulence to the flow. In an unstable atmospheric boundary layer the rising air in thermals is complemented by colder air sinking from the top of the layer, where the wind velocity approximates the gradient flow; i.e. the direction may be backed by 20–30° from the wind at the surface, and the speed is greater. The descending air retains most of these characteristics when it arrives at the surface as a strong gust, thus backing (i.e. shifting anticlockwise around the compass) and increasing in speed. Very light aircraft are of course more susceptible than others to low-level gusts. Such gusts figure in light aircraft accidents perhaps ten times more often than all other forms of windshear or turbulence combined. However, such upsets don't often result in serious injury to the occupants, and coping with such conditions in take-off and landing is an everyday part of pilot development. This module is concerned with more unusual events. Horizontal shear effects Horizontal shear is the change in horizontal wind velocity (speed and/or direction — gusts and lulls) with horizontal distance flown; i.e. a substantial change in the ambient energy state of the air mass in which the aircraft is borne. Horizontal shear is particularly dangerous when landing, taking off or going around as headwinds can suddenly disappear or change to strong crosswind gusts. These can last anywhere from a few seconds to several minutes. Crosswinds can change to tailwinds, resulting in loss of control and ground collision. There are two general classifications for horizontal shear. Increasing-performance shear. If a low-flying aircraft suddenly encounters an increase in the headwind component of wind speed (or a decrease in a tailwind) then due to its inertia the aircraft will momentarily maintain its speed (and flight path) relative to the Earth. Thus there will be a brief increase in speed of flow over the wings with consequent increase in lift. The aircraft will rise, gaining potential energy, until the inertial effects are overcome and the aircraft restores itself to the previous flight state at a higher altitude than previously; but at a changed ground speed and track — if the changed wind velocity is maintained. Decreasing-performance shear. Similarly should the aircraft encounter a decrease in the headwind component (a lull, or a gust from the rear) then airspeed and lift will decrease, and the aircraft will sink until the inertial effects are overcome. In recreational light aircraft flight conditions (and in accordance with the lift equation) the percentage increase or decrease in lift will be about double the percentage increase or decrease in airspeed; i.e. if airspeed dropped by 10% then lift will drop by 20% and the aircraft will sink very quickly. The worst situations to encounter such shear are where loss of airspeed and/or a sudden loss of height, take-off or climb performance could be critical — on the final approach to landing, on take-off or during a go-around . The time taken for the aircraft to restore itself to the original airspeed will be much the same as that taken to gain — in normal conditions — the same increase in airspeed by increasing power. Usually increasing-performance shear should not present any problem to an aircraft on approach or take-off, as long as the pilot continues to maintain the appropriate attitude in pitch, ignoring the speed increase(s), and is prepared for a possible decreasing-performance shear encounter to follow. On the other hand decreasing-performance shear will be very dangerous if the aircraft has insufficient height to clear obstacles while the pilot takes action to accelerate the aircraft through the shear and minimise height loss. If the aircraft's initial airspeed was less than the safe speed near the ground, including the normal 50% gust estimate allowance, then the shear effect is exacerbated and the rate of sink could be extremely high. Wind shear occurring just after wheels-off can cause the aircraft to stop accelerating. Wind shear events are usually a combination of wind speed variations and variations in three-dimensional direction, which will affect aircraft speed, angle of attack and attitude in the three axes. Thus encountering changes in horizontal flow within the airmass causes momentary changes in lift. There are consequent variations in the vertical profile of the flight path plus — with significant wind direction changes — diversions from the planned ground path and uncommanded motions in roll, yaw and pitch. Increasing-performance shear could even stall the aircraft: imagine an aircraft in slower level flight encountering a 20-knot gust vector at 45° to the horizontal. The effect would be like encountering a 14-knot head-on gust combined with a 25 fps updraft — the airspeed would be increased but the vertical gust component could take aoa past critical, so we have an accelerated stall. Something you can be sure of is that no matter what scientists and aviators may do to place wind shear and turbulence events into tidy boxes, the atmosphere has never been a party to such classification and will, on occasion and literally out of the blue, produce a demonstration of staggering power that just confounds our experience and expectations. Various scenarios were outlined in the 'Don't stall and spin in from a turn' module where the aircraft could be flying with little margin between effective and critical aoa; it is on occasions like these that Murphy's Law springs into action. What can and will go wrong at those worse possible times is an encounter with wind shear or turbulence that suddenly increases the effective aoa of the wing and instantly switches on a stall/spin event or a high sink rate at the worst possible time. Vertical shear (unrelated to vertical gust shear) is the term used for the change in the roughly horizontal wind velocity with change in height; i.e. as the aircraft is climbing or descending. As the vertical component of a light aircraft's velocity during climb or descent is probably no more than 12% of its horizontal velocity, the outcome of vertical shear is much the same as that for horizontal shear so we'll ignore the term and talk about the wind gradient. The wind gradient The Earth's surface has a frictional interaction with the atmosphere. Its effect decreases with height, until between 1500 and 3000 feet agl the gradient wind (i.e. the wind more or less is aligned with the isobars on the meteorological surface chart) dominates. The stability of that 'friction' or 'boundary' layer between the surface and the gradient wind level affects the strength of the friction force. A very stable layer suppresses turbulence and friction is weak except near the surface. In a superadiabatic layer convective turbulence is very strong and the friction force will be strong. In a typically neutral layer, with a moderately strong gradient wind of about 30 knots at 2500 feet, the wind speed might be 20 knots at 750 feet but only 10 knots at the surface. There is also a change in wind direction within the layer, perhaps as much as 40°. The rate of change in the gradient wind speed is generally more pronounced within the lower 300 feet, while the change in direction in that first 300 feet is negligible in strong winds but greatest in light winds, perhaps as much as 15–20° if the surface wind is less than 5 knots. The profile of the wind velocity change between the gradient wind and the surface wind is called the wind gradient. The greatest change in wind gradient velocities occurs at night and early morning. If the gradient wind speed is 30 knots at 2500 feet agl and reduces uniformly to 10 knots at the surface then, although the 20-knot change is relatively high, the time taken for a light aircraft to descend for landing through that wind profile is measured in minutes; thus there is no shear because the rate of change is slow. Remember in aviation terms wind shear is a sudden but sustained 'variation in wind along the flight path of a pattern, intensity and duration, that displaces the aircraft abruptly from its intended path and sufficiently that substantial and timely control action is needed.' So the average recreational light aircraft is not adversely affected by the normal (see Note 3) wind gradient provided that the minimum safe speed is maintained during take-off and landing, and the pilot remains aware of the gradient effects on the flight path/speed profile, adjusting the usual piloting techniques accordingly. (Note: 'normal' for the average recreational light aircraft implies a surface wind no more than 'moderate'; i.e. less than 16 knots or the point at which a dry '15 knot' windsock becomes horizontal. Greater surface wind speed could indicate a more pronounced gradient and thus possible shear conditions within the gradient.) 6.7.4 The speed to fly in turbulence Vno — maximum structural cruise speed In light aircraft the green arc on the airspeed indicator should indicate the 'normal operating' range between Vs1 at the lower limit, and Vno, or perhaps Vc, at the upper limit. Vno is the maximum structural cruise speed and, when cruising at and below Vno, the airframe would not be put at risk of overstressing in an encounter with turbulence in the upper end of the moderate range. Flight in the yellow arc speed range between Vno/Vc and Vne should only be conducted using controls cautiously and in reasonably smooth atmospheric conditions. Vc — design cruising speed Vc is normally not a limiting speed — it is a value chosen by the designer as a basis for stress calculations. In the FAR Part 23 regulation normal category, Vc in knots may not be less than 33 times the square root of the aircraft wing loading in pounds/square feet. For example 'minimum' Vc for an aircraft with 9 lb/ft² weight/wing area ratio (about 45 kg/m²) would be 33 × 3 = 99 knots. Alternatively the designer is allowed to obtain a lower speed value by setting Vc at 90% of Vh — the maximum level flight speed attainable at sea level whilst utilising maximum continuous engine power. Vno must not be less than the minimum Vc and for light aircraft Vc and Vno can be considered synonymous. The representative gust envelope, below, for a normal category aircraft superimposes positive and negative vertical gust load lines over a manoeuvring V-n diagram similar to that shown in the 'Airspeed and properties of air' tutorial. The horizontal light blue line indicates airspeed increasing from zero. The calculated gust load lines originate at the normal flight load condition of +1g, the strong 50 fps (30 knot) gust line extending to Vc and the moderate 25 fps (15 knot) line extending to Vd (the design diving speed). You can see that the moderate line intersects with Va at about 2g (i.e. a 1g acceleration) and with Vc at about 2.8g (a 1.8g acceleration). The strong gust line intersects with Va at about 3g and with Vc at something in excess of the 3.8g limit load. The brown arrow shows the 2.5g load — added to the normal 1g load — when the aircraft, flying at a speed about 30% higher than Va, encounters a 50 fps updraught. The total load factor is then about 3.5g; within the limit load factor, even though the gust is at the low end of the strong gust category. The pink arrow shows the resultant 2g load when the aircraft, flying at a speed about 30% higher than Vc, encounters a 25 fps updraught. Adding the normal 1g load the total load factor is then 3g. So even when flying at a speed somewhat greater than Vc/Vno in a certified light aircraft, an encounter with a vertical gust at the low end of the moderate gust range would be no problem. The calculations designers use to establish the gust load lines is similar to those used in the preceding section 'Vertical gust effects' but more refined; e.g. using a 'gust alleviation factor' rather simplifying the calculation with the concept of a 'sharp-edged gust'. FAR 23 Appendix A provides simplified design load criteria and allows designers of many conventional single-engine monoplanes weighing less than 2700 kg to take advantage of the simplification. That same appendix is generally duplicated in the design regulations of most other countries. One advantage of interest to us is that it is not necessary to specify Vno; instead, Vc is designated in the flight manual as the maximum structural cruise speed (i.e. Vno = Vc) and that Vc is probably set at 90% of Vh, as mentioned above. Va — design manoeuvring speed Almost all recreational light aircraft are built to simplified design standards that may not include rational consideration of gust loads — and there is no requirement for designers to publish a 'turbulence penetration' speed. For such aircraft, the maximum speed in anything approaching rough air is the design manoeuvring speed, so aircraft flight manuals or Pilot's Operating Handbooks nominate Va, which is usually considerably lower than Vc, as the speed to fly in 'turbulence'. There are other advantages in nominating the lower speed; e.g. most pilots have difficulties in classifying the turbulence being experienced (one pilot's 'moderate' may be another's 'extreme') and in controlling an aircraft in even moderate turbulence without experiencing considerable variation in speed. So rather than nominating a 'rough air' speed or a 'turbulence penetration' speed, manufacturers specify Va as the 'speed to fly' in turbulence. Before going further, we should examine how Va is derived. At higher speeds the wing lift coefficient (i.e. the aoa plus flap/slat/spoiler configuration) is relatively low, with much of the lift being provided by the dynamic pressure due to the airspeed — so the lifting force potential of the wing is very high. In these circumstances the wing loading might be readily tripled or quadrupled through abrupt and excessive elevator movement. For example if the aircraft was flying with CL = 0.25 and the pilot suddenly pulled back hard on the stick then CL might increase to 0.75 applying a momentary 3g load made up of the pre-existing 1g normal load plus the 2g acceleration. So it is unwise to make full or abrupt applications of any one primary flight control if flying at a speed greater than Va. This is because at the higher speeds it is easy to apply forces that could exceed the airframe structural limitations, and particularly so if you apply non-symmetrical loads; e.g. apply lots of elevator and rudder together. Misuse of controls in light aircraft at high speed can generate greater structural loads than those likely to be encountered in turbulence, so Va is also useful as a 'turbulent air operating speed'. At this compromise speed the aircraft will produce an accelerated stall, and thus alleviate the aerodynamic load on the wings, if it encounters a vertical gust imparting an acceleration sufficient to exceed the load limit factor. Aircraft design rules generally state that the minimum acceptable manoeuvring speed is a fixed calculation relative to Vs1 for all aircraft within the same category; for a normal category light aircraft (whose certificated vertical load limit factor is +3.8g) minimum Va = Ö3.8 Vs1 or 1.95 × Vs1. Of course the aircraft designer may specify a Va speed that is greater than the minimum requirement. The sample gust envelope diagram indicates that particular aircraft at Va could handle a vertical gust speed greater than 50 fps without reaching the load limit. All the preceding assumes the airspeed indicator has been properly calibrated and Va is stated as a calibrated airspeed. If it has not been accurately calibrated each one knot error in IAS around Va speeds will make a 0.1g difference in wing loading; i.e. if the ASI is understating airspeed by 10 knots then the load is 1g greater than thought. For more Va information see 'Critical limiting speeds'. What speed then? Follow the recommendations in the manufacturer's approved documentation. However, if that lacks substance then the following is relevant. If in cruising flight at speeds at or below Vno/Vc and 'very low' to 'low' turbulence is encountered, speed could be maintained without detriment, but be prepared to slow down if you suspect it may become rougher or if conditions suit the development of fast-rising thermals. If turbulence is in the moderate to severe category, reduce speed to the weight-adjusted Va. If flight at this speed is still worrying then speed could be reduced further. But when flying in moderate to severe turbulence at speeds below the weight-adjusted Va, then although the potential for exceeding load limits is no longer a problem, the potential for loss of control is much increased. As speed is reduced below Va updraft encounters produce increasing changes in aoa. This increases the potential for stall and in rough conditions even transient stalls may lead to longer-term loss of control with possible spin entry — and spins in severe turbulence may not be quickly recoverable. Loss of control may also lead to airspeed exceeding Va and thus restoring the potential to exceed load limits. Normal minimum safe speed in fairly smooth air is 1.5 × Vs1, but in very rough conditions the lower limit should be perhaps 1.7 × Vs1. You can see from the V-n diagram that the intersection of the 50 fps gust line and the Cna curve corresponds with a load factor of about 2.8g. The stall speed is escalated by the square root of the load factor and the square root of 2.8 = 1.7. If there is no manufacturer's documentation or instrument panel placard indicating manoeuvring speed, or a speed to fly in turbulence, then assume maximum weight Va is twice Vs1 CAS. If weight is below MTOW reduce Va by one half of the percentage weight reduction; e.g. if weight is 16% below MTOW, reduce Va by 8%. In addition it should be recognised that some sport and recreational light aircraft are ageing, the strength of their airframe components is not 'as new' and the designed ultimate load limit factor is no longer achievable. 6.7.5 Coping with shear and turbulence Prudent actions The action to take in encounters with turbulence or shear very much depends on your interpretation of events. For example if, in cruising flight, you believe you have entered just a limited layer of turbulence then you would initiate a shallow descent or climb to find smoother air. At the other extreme is a cruising flight encounter with a severe vertical gust or other severe turbulence, where your actions might be: set and tighten the engine control(s) to provide power appropriate to the Va target and then try to hold a straight and level attitude — if it's really rough you might need both hands on the control column tighten harnesses; you should not have any loose objects in the aircraft. don't chase the airspeed indicator (which may well be giving transient erroneous indications anyway), just hold the attitude as much as possible. (If turbulence is really rough it may be impossible to read the instruments, not least perhaps because your eyes are not able to refocus quickly enough.) don't over-react to changes in altitude avoid adding any manoeuvring loads such as those that are applied if you attempt a 180° turn; and certainly don't make abrupt asymmetric manoeuvres. Do not extend flaps, as in most light aircraft the effect is to reduce the structural limit load factor, full flap usually by about 50% to around 2g. If controllability is becoming difficult and the aircraft has retractable undercarriage then lower it — the drag reduces higher speed excursions and the lower drag line seems to reduce yaw. After escaping turbulence do not retract the undercarriage; inspect the area for damage immediately after landing. In excessive uplift, rather than going with the flow it may be prudent to reduce power and lower the nose somewhat to maintain target speed. It depends on what is above you — a towering cumulus or Class C airspace for example. If you are likely to violate controlled airspace notify Flight Service on the area frequency and ensure the transponder, if available, is operating. If you have the ability, then inform Flight Service of the turbulence encounter and location — the pilot report may help others to avoid it. Generally an aircraft will not run into a severe downdraft at low levels, more likely it will meet the turbulent low-level horizontal outflow from the downdraft. However, if you encounter a severe downdraft at lower levels, the only option is to immediately apply full power and either adopt the attitude for best rate of climb or allow airspeed to increase even beyond Va and trust you will fly out of the downdraft quickly. Whichever way the pilot is in a hazardous situation, and the aim should be to recognise and avoid extreme shear conditions. Upset recovery Many windshear or turbulence encounters will result in an uncommanded roll perhaps combined with strong yaw, pitch-up or pitch-down. The result may well be an aircraft in a most abnormal attitude and losing height fast. Such events are very dangerous at low level. Most light aircraft don't have much roll capability, perhaps 15–30° per second is the norm. If a condition such as a curl-over, a lee wave rotor or the wing tip vortices from a preceding larger aircraft (for example when turning base to final following a larger aircraft landing from a straight-in approach), is encountered, the resulting induced roll may well exceed the countering capability of the ailerons. As mentioned in the 'Engine failure after take-off' module under the sub-heading 'Unloading the wings is a good practice to practise' a light aircraft (but not a trike) can be better controlled for at least a few seconds, even at sub-Vs speeds, by pushing forward to unload the wings so that the aircraft is operating in the reduced-g zone (between perhaps +0.25g and +0.75g) but not in the negative-g zone'. In the 'Don't stall and spin in from a turn' module under the sub-heading 'When I recognise a stall with wing drop what's the best way to recover?' a stall recovery technique was presented. That same technique is applicable to recovery from an abnormal attitude (where the primary aim is to get all lift force directed away from the ground), except that the initial forward stick movement should unload the wings rather than just reducing aoa below critical. Centralise the ailerons and unload the wings to a reduced-g level, even if steeply banked or inverted. This may be a difficult decision if the nose is already pitched down and not much height is available, but certainly keep the stick forward of neutral. Increase power smoothly, up to maximum if low and slow, but if the nose is pitched down and speed is above or accelerating towards Va then reduce power. Don't wait for the engine to fully respond before moving to the next actions. If the aircraft is inverted, then close the throttle to improve subsequent responsiveness. Cancel any yaw with rudder, and centre the slip ball. This and the two preceding items should be near-simultaneous actions. While maintaining the low wing loading, roll the wings level with aileron so that all the lift force will be directed away from the ground, and use coordinated rudder to assist the ailerons. If near inverted, choose the roll direction that provides quicker return to a wings-level attitude but if the ailerons can't counter the induced roll then you might take advantage of the roll momentum and continue to roll through. As the wings are nearing level, ease the stick back to the neutral position, or just aft of it, to correct the attitude in pitch. When safe, adjust attitude and power as necessary for the climb-out. If on an approach to landing, then go around — and take your time starting the next approach. STRICT COPYRIGHT JOHN BRANDON AND RECREATIONAL FLYING (.com)
 -

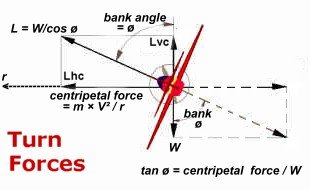 6.6.1 Why the high fatality rate? Loss of control The primary causal factor for the generally high fatality/severe injury rate is loss of control in a mistimed/poorly executed initial turn, perhaps being intimidated by terrain/obstructions; or, following a successful 180° turn, realising too late the airfield can't be reached resulting in an unplanned, perhaps desperate, reaction. The factors involved in loss of control events were discussed in the article 'Don't stall and spin in from a turn'. Here's an extract from an RA-Aus accident report compiled by a qualified witness on behalf of the severely injured pilot. At the time, the pilot had a CPL and RA-Aus Pilot Certificate but only 2 hours experience in his Supercat CAO 95.10 aircraft. The crash occurred from a 900-metre runway at an airfield in mountainous terrain, at an elevation of 3300 feet. At the time, wind was light and variable with no turbulence, and temperature corresponded to the ISA norm. Apparently partial loss of thrust was experienced on take-off. " The aircraft took off normally ... climbed to 150–200 feet near the end of the runway ... then appeared to sink and turn left ...(there is a power line 300 m past the runway end, below runway level in a ravine)... the angle of bank increased rapidly until it appeared to be almost 90°. The aircraft descended rapidly and disappeared behind some trees followed by a surprisingly soft 'crump'." The aircraft hit the ground almost vertically. 6.6.2 Opting for the turn-back The need for a properly derived decision The conventional and generally long-accepted wisdom in the event of a low-level off-field failure is for a properly controlled landing — hopefully into wind, more or less straight ahead, but certainly somewhere within 60° either side of the initial path. Factors involved were examined in the three preceding modules of this series. If the engine fails well into the climb-out one of the possible options is to turn back and land on the departure field. If the take-off and climb was into wind and a height of perhaps 1500 feet agl had been attained (and the rate of sink is less than the rate of climb) then there would be every reason to turn back and land on that perfectly good airfield. There may be sufficient height in hand to manoeuvre for a normal, but close, circuit; or otherwise a crosswind, rather than a difficult downwind, contra-traffic landing. On the other hand there will be a minimum 'decision height' below which a turn-back for a landing in any direction could clearly not be accomplished; and of course there will be an associated maximum distance. The only logical basis for opting for a turn-back, rather than landing somewhere within that 120° arc ahead of you, is a properly derived decision that it is by far the safest choice. This requires knowledge of the dynamics involved in the turn-back and of the relevant characteristics of the aircraft being flown. Knowledge of the latter can only be gained by practising accurate, low-speed, fully banked gliding turns at a safe height and measuring the height lost in the turn plus the distance:height ratio at Vbg. 6.6.3 Turning back — procedure and dynamics The repositioning manoeuvre Turning back to land on, or parallel to, the departure runway is a two-stage procedure. This comprises a repositioning manoeuvre, turning through maybe 210°, so that the aircraft is positioned as close as possible to the extended runway line at sufficient height to then glide directly back to the planned touchdown point at Vbg — the speed that provides the best L/D ratio and thus optimum distance in a straight glide. A small turn will be needed to finally align with the selected landing path. If the take-off has a crosswind component, the initial turn should be conducted into the crosswind so that the aircraft will drift towards the extended runway line and also reduce the ground diameter of the turn a little. If the take-off has been downwind because of runway slope then the minimum height for a turn-back would be greatly increased; if there are any doubts don't turn back — except as needed for an into-wind off-field landing. Of course there is no need to opt just for a runway if you have departed from a larger airfield with ample cleared area available for an emergency landing. While repositioning, it is important to minimise the time spent in the turn and thus the height loss, so gliding at Vbg or even Vmp is not a requirement; but choice of an optimum turn speed is vital. Turn speed, diameter and rate of turn The air radius of a turn is directly proportional to the true airspeed squared and indirectly proportional to the angle of bank. The rate of turn is directly proportional to the angle of bank and indirectly proportional to the speed. Table 5.1 shows some calculations for various bank angles at speeds of 40, 50, 60 and 70 knots. The calculations are based on two slightly simplified but accurate equations applicable to all light aircraft: The turn diameter (metres) = the airspeed (metres per second) squared divided by 5 × the tangent of the bank angle. Example: airspeed 60 knots (30 m/sec), bank angle 30° and tangent 30° is close to 0.6. Turn diameter = 30 × 30/5 × 0.6 = 900/3 = 300 metres. The rate of turn (degrees per second) = the tangent of the bank angle × 1100 divided by the airspeed in knots. Example: bank angle 45°, tangent 45° is 1.0 and airspeed 40 knots. Rate of turn = 1.0 × 1100/40 = 1100/40 =28°/sec. So time to turn through 210° = 8 seconds. Note 1: a rate 1 turn is 3°/sec, a rate 2 turn is 6°/sec, a rate 3 turn is 9°/sec, and a rate 4 turn is 12°/sec. Very heavy transport aircraft normally turn at 1.5°/sec. Table 5.1 Turn diameters and turn times Airspeed (knots CAS) Bank angle Tangent Turn diameter (metres) Turn rate (°/sec) Time to turn through 210° (seconds) 40 10° 0.2 400 m 5 42 s (20 m/s) 20° 0.4 200 m 11 19 s 30° 0.6 135 m 16 13 s 45° 1.0 80 m 28 8 s 60° 1.7 45 m 48 4 s 50 10° 0.2 625 m 4 53 s (25 m/s) 20° 0.4 310 m 9 23 s 30° 0.6 210 m 13 16 s 45° 1.0 125 m 22 10 s 60° 1.7 73 m 38 6 s 60 10° 0.2 900 m 3.7 57 s (30 m/s) 20° 0.4 450 m 7.4 28 s 30° 0.6 300 m 11 19 s 45° 1.0 180 m 18 12 s 60° 1.7 105 m 32 7 s 70 10° 0.2 1225 m 3.1 67 s (35 m/s) 20° 0.4 610 m 6.3 33 s 30° 0.6 410 m 9 23 s 45° 1.0 245 m 16 13 s 60° 1.7 140 m 27 8 s It can be seen that both a greatly reduced turn diameter and a very fast turn rate are achieved at the lowest speed coupled with the highest bank angle, with the bank angle being more significant than the airspeed. So the stall speed of the aircraft has some importance; the ultralight with a very low Vs1 can produce a very fast small diameter turn. Note from the table that at all speeds the time to turn through 210° and the air diameter of the turn are around four times better with 60° bank than with 20°. However, the third factor to be considered when selecting the bank angle and airspeed is the rate of sink relative to the bank angle. Bank angle, stall speed in the turn and rate of sink The 'turn forces' diagram shows the relationships between total lift force, bank angle, weight and the centripetal force required to make the turn. In the turn, the vertical component [Lvc] of the total lift force just about balances aircraft weight, and the horizontal component of lift [Lhc] provides the centripetal force to minimise the turn radius. At 30° bank angle Lhc = 0.6 Lvc while at 60° Lhc = 1.7 Lvc. So to provide the centripetal force for a sustained turn, the wing loading must be increased by pulling g as angle of bank increases; rather slowly up to a bank angle of 30° — where it is 15% greater than normal level flight loading — after which it escalates. The diagram is for a powered level turn, but the principles are much the same for a gliding turn. Except that in the level turn, the airspeed is generally held constant and the increase in total lift force is gained by increasing angle of attack; the consequent increase in induced drag is countered by increasing thrust. In a gliding turn the increase in total lift force is obtained by both increasing the angle of attack (pulling g) as bank increases and increasing the airspeed by lowering the nose; the rate of sink accelerates as airspeed and aoa (thus induced drag) increase. Table 5.2 is a sample profile of the increase in sink rate in a sustained gliding turn at particular bank angles. The base sink rate is the minimum sink achievable in a straight glide at Vmp. The fourth column shows the increase in turn stall speed and the last column is a representative estimate of the increase in rate of sink in the turn if the airspeed chosen was about 10% higher than the turn stall speed [i.e. for 45° bank airspeed = 1.3 Vs1]. Note: L/D or glide ratio [actually Lvc/D] deteriorates markedly as bank angle increases because of the escalating induced drag as more g is pulled. Table 5.2: stall speed/sink rate in a sustained gliding turn Bank angle Cosine Load factor (=1/cos angle) Vs1 multiplier (increase) Sink rate multiplier (See note 1 below) 10° 0.98 1.02g 1.01 (+1%) 1.05 (+5%) 20° 0.94 1.06g 1.03 (+3%) 1.15 (+15%) 30° 0.87 1.15g 1.07 (+7%) 1.3 (+30%) 45° 0.71 1.41g 1.19 (+19%) 1.9 (+90%) 60° 0.50 2.00g 1.41 (+41%) 3.5 (+250%) Note 2: the comparative sink rates shown in the right-hand column will vary substantially with each aircraft type/model. The late Tony Hayes of the Thruster Operations Support Group kindly produced some Thruster T300 trial data, which showed that in a 45° bank gliding turn at 55 knots (1.3 Vs1) the sink rate was 900 fpm, or 3 times the Vmp sink rate of 300 fpm. If the turn was conducted at 59 knots (1.4 Vs1) the sink rate increased to 1050 fpm or 3.5 times minimum sink in a straight glide. The sink rate in a straight glide at Vbg (48 knots) was 400 fpm. The trials were conducted soon after sunrise in a calm, stable atmosphere thereby providing best results. Sink rates would be worse in normal everyday conditions. Choosing the bank angle Obviously the height lost in the turn is a function of the rate of sink and the time spent in the turn. Table 5.3 is a calculation for a hypothetical ultralight that has a Vs1 of 40 knots and a minimum rate of sink in a straight glide of 420 fpm or 7 feet per second. The airspeed selected for the turn is just 10% greater than the stall speed (Vs[turn]) at those bank angles. Table 5.3 Height lost in a 210° turn. (Vs1=40 knots, minimum sink =420 fpm or 7 fps) Bank angle Vs (turn) +10% (knots) Turn diameter (metres) Turn time (seconds) Sink rate (fps) Height lost in turn (feet) 10° 44 540 m 46 7+ 330 ft 20° 45 280 m 24 8 190 ft 30° 47 190 m 15 9 135 ft 45° 52 135 m 10 13 130 ft 60° 62 110 m 7 24 170 ft It can be seen that a 45° bank angle, where Lhc = Lvc — i.e. the wing loading is equally distributed between countering gravity and providing the centripetal force — allows the least height loss. The height loss at a 30° bank angle is much the same but the lesser bank gives a larger turn diameter. Bank angles less than 30° or greater than 45° are not as efficient in terms of height loss. Similar relationships are found for other light aircraft, so 45° is the usually accepted optimum bank angle for least height loss and smaller diameter. The POH may recommend otherwise if high-lift devices are fitted. There is a problem with choosing and maintaining a particular bank angle, in that if the aircraft is not equipped for flight in instrument meteorological conditions there is no reliable instrumental means of accurately assessing the bank angle — though fortunately pilots tend to overestimate (rather than underestimate) the steepness of the bank by perhaps 10°, i.e. they believe they have 45° bank but in reality it is perhaps only 35°. The angle can only be confidently established by comparing the horizon with ascertained structural or cockpit angles. 6.6.4 Turning-back A possible scenario Imagine a competent aviator who has practised for steep turn-backs (at a safe height and maximum weight) and can hold the aircraft at constant speed with a constant bank angle known to be 45° and, by trial, has established the average rate of sink in such a turn. Vsi for the aircraft is 40 knots CAS and Vbg is 60 knots CAS. As a result, the pilot feels comfortable using an airspeed that is only 10% greater than the stall speed in a 45° banked turn — that speed is 52 knots and thus the average turn diameter is 135 metres, rate of turn is 21°/sec, and rate of sink is 900 fpm or 15 feet per second. Suppose that pilot takes off towards the north on a 600-metre north-south strip sited in rough terrain; there is nil wind and smooth ISA sea level conditions. The aircraft lifts off 200 metres from the southern end, climbing away at 60 knots (30 m/sec) and 500 fpm. The engine fails 60 seconds after wheels-off when the aircraft is 500 feet above airstrip level and 1800 m from the lift-off point, or 1400 m from the northern threshold. The pilot takes 4 seconds to react to the engine failure (see 'Engine failure after take-off') and decides on a turn-back. A further 5 seconds passes before the aircraft is established in the glide at the speed appropriate for the turn, i.e. 52 knots. The slow speed roll rate is around 15–20°/sec, so another 2 seconds passes before the turn is established. Thus about 10 seconds elapses between engine failure and start of turn. During this time the aircraft moves about 250 m further from the airstrip and loses perhaps 50 feet of altitude, so at start of turn the aircraft is 450 feet above runway level and 1650 m from the northern threshold. With a turn rate of 21°/sec and sink rate of 15 feet/sec, the 210° turn takes 10 seconds during which the aircraft loses 150 feet. So after straightening up and establishing descent at Vbg, the aircraft is 300 feet above strip level and a bit less than 1650 metres from the airstrip. So the elapsed time from engine failure to being in a position to start the straight line return glide is about 20 seconds, during which 200 feet of altitude is lost while the aircraft has moved nearly 250 m further from the runway. Let's presume the aircraft's L/D is 10:1, so to glide 1650 metres after straightening up it would have to start from a height of 165 m or 540 feet. Starting from only 300 feet it will hit the ground about 750 m short of the runway, so in this scenario the distance to glide after the end of the turn is of more importance than height lost in the turn. If the aircraft had taken off into a 10-knot (5 m/sec) headwind, then the end-of-turn point would be displaced 80 seconds × 5 m/sec = 400 m closer to the threshold, with then 1250 m to run. At the 60-knot Vbg and 70-knot (35 m/sec) ground speed descent the 1250 m would be covered in 36 seconds. The aircraft's L/D is 10:1 so the Vbg sink rate is 6 knots or 10 feet/second. Thus the aircraft will lose 360 feet during the glide indicating that, even with the favourable 10-knot wind, it will hit the terrain 200 m or so short of the threshold. The aircraft might just scrape in for a successful turn-back in nil wind conditions if the initial climb rate was such that it is 750 feet agl at 60 seconds after wheels-off, in which case it would be at 550 feet at end-of-turn. Choosing a safe speed Obviously you shouldn't conduct a low-level turn near the point of stall and any mishandling or turbulence during turns at high bank angles and low speeds may result in a stall-spin event, so a minimum safety factor for the turn must be considered. For a recreational light aircraft a factor of 10% above Vs[turn] may not be enough, so perhaps the turn speed should be 20% greater; i.e. 1.2 times Vs[turn]. For the example in the preceding scenario, that safer airspeed at the required 45° bank would then be 58 knots CAS — which might increase rate of sink from 15 to 17 feet/sec, the turn time from 10 to 11 seconds and thus the height loss in the turn from 150 to 190 feet; acceptable, considering the added safety. However, the stall speed at 45° bank is 1.2 × Vs1 CAS and multiplying that by 1.2 provides an airspeed of 1.44 × Vs1 CAS — close to our normally recognised safe speed of 1.5 × Vs1. So then considering all the inaccuracies inherent in flight we come back to 1.5 × Vs1 CAS (60 knots in the scenario) as the optimum speed in the 45° banked turn-back manoeuvre. Extract from an RA-Aus fatal accident report: 'Following the loss of power at approximately 300 feet, the pilot apparently attempted a turn to the left in an attempt to return to the runway that he had just departed from. At a position approximately 200 metres to the left of the extended centre line of runway 30 and 400 metres from the upwind threshold of that runway, the aircraft entered a spin and impacted the ground in a near vertical attitude. Note 3: In the preceding tables and text I have used the calibrated airspeed but the velocity in the equations should be the true airspeed, so the turn diameter will be greater than shown, the rate of turn will be less and consequently the height lost during the turn will be greater. 6.6.5 So what's the verdict? From the foregoing you might conclude that it would be foolish to state (though many do) that a return to the runway is possible if a particular aircraft type is above a certain height when EFATO occurs. The main factors to be considered/estimated in the very few seconds available for an informed decision are these: The distance you are from the nearest runway/airstrip threshold and the distance you will be when the 45° bank re-positioning turn, flown at 1.5 × Vs1 CAS, is completed and the aircraft established at Vbg. The estimated height still in hand after the repositioning turn is completed and whether that will be sufficient for the glide approach to the threshold. The effect wind and turbulence will have on the result. Although EFATO operations are near ground level the effect density altitude will have on the result must be taken into account. For example, as TAS increases with density altitude then the height loss during the turn at a particular CAS must increase. The existence of obstructions along the glide path. Possible collision avoidance risks in the contra-traffic landing — emergency, low-level, non-powered manoeuvring may lead to a stall/spin event. If very close to the airfield, can sufficient height be lost to land reasonably safely, taking wind effect into account. All of this indicates that the possibility of success is very difficult to assess quickly when airborne time remaining is rapidly counting down to zero. You must know your aircraft and your capabilities, and have previously established the safe turn-back performance under varying conditions. Also you must be a very good judge of distance (few pilots are) and be able to maintain absolute control at rather low energy levels and higher wing loadings; otherwise — it is most unwise to turn back! STRICT COPYRIGHT JOHN BRANDON AND RECREATIONAL FLYING (.com)
 -
6.5 Engine failure after take-off
Admin posted a tutorial in Decreasing exposure to aerodynamic risk
 Once airborne, naturally any engine failure is a failure after take-off even if the aircraft is 100 nm from the take-off point. However, the EFATO term is usually accepted to mean a significant loss of thrust occurring while the aircraft and pilot are still in 'take-off or go-around mode'. For example, haven't yet set course, or raised take-off flap, or haven't yet reached 1000 feet agl if intending to operate above that height, or, if doing circuits have not yet completed the crosswind turn; i.e. a 'thrust deterioration at take-off' that occurs while climbing soon after lift-off or during a go-around when the aircraft has little energy to trade. This module presumes the reader is familiar with the contents of the earlier 'Don't stall and spin in from a turn' and 'Don't land too fast in an emergency' modules, which are pertinent to this document. 6.5.1 What happens when the engine or propeller fails in the initial climb? Pilot and aircraft reaction times A recreational light aircraft established in the climb attitude at Vy (best rate of climb speed) has an aoa perhaps around 6–8°. At such angles there is significant induced drag so when thrust is lost, for any of a multitude of reasons, the aircraft may rapidly decelerate to stall speed — worse if the airframe also has much parasitic drag. The immediate action required is to convert the potential energy of height to a safer speed. When climbing at Vx (best angle or emergency climb speed) aoa could be around 8–12°, so deceleration following power loss is a greater hazard. Of course recreational light aircraft Pilot Certificate holders are aware of this and take immediate action to lower the nose to a position consistent with their estimate of the approach or glide attitude in pitch. Or do they? Material developed by the late Mike Valentine, the former RA-Aus Operations Manager and prestigious GFA stalwart, is included in this section. Mike conducted considerable research into pilot and aircraft reaction times following cable breaks in winched glider launches and engine failure after take-off in recreational light aircraft. Some research results — which were very similar for both aircraft categories — were published in the June 2004 issue of the RA-Aus journal, and are summarised as follows. Following an engine/propeller failure in the climb, there is an initial delay while the pilot's brain adjusts to the shock of the event and then she/he pushes the control column forward. This reaction time appears to average around three to five seconds, much longer than might be imagined, but similar results are obtained in tests by other aviation bodies. Mental paralysis/disbelief, i.e. 'this can't be happening?', is the main contributor to that delayed reaction; meanwhile the aircraft is slowing at perhaps 2 to 4 knots per second. It can be exacerbated by slight panic if the power loss is accompanied by very unusual engine noises, smoke and/or violent shaking. A quiet breakdown in the propeller speed reduction unit results in the unloaded engine's rpm increasing while the propeller is 'freewheeling' — producing no thrust — and it may take a little longer for the pilot to realise what has happened. If the aircraft is equipped with an effective elevator trim system and the pilot has trimmed for the climb speed — which is generally similar to the best glide speed — then the aircraft will of course try to regain its trimmed speed when thrust decreases; however, this takes too long to stabilise, and the pilot must take firm control and push the stick forward. As the pilot pushes over into the glide attitude the aircraft follows a curved flight path. During this manoeuvre, pitch attitude and wing loading are changing, and the aircraft still slows for two or three seconds before accelerating. When the desired attitude is eventually attained, the pushover is terminated and the aircraft is then apparently stable in its glide attitude. Apparently? Yes because, although the aircraft is in the required nose low attitude, it has just been through an energy-changing manoeuvre without the benefit of thrust to sustain it. Its inertia, aided and abetted by its drag, prevents it from immediately attaining the airspeed appropriate to the glide attitude; some seconds must be allowed for the aircraft to build to that speed. Gravity alone can't instantly accelerate an aircraft to a safe speed through a 10 or 15 degree pitch attitude change. The real EFATO event will be noticeably different from that experienced in a simulated EFATO because there is no residual thrust from an idling engine. If the propeller is windmilling there will be additional drag and thus a bit steeper descent path. Also the lack of a cohesive propeller slipstream over the tailplane will make the elevators feel different — and less effective. Any attempt to start manoeuvring the aircraft without allowing sufficient time for the indicated airspeed to build to, and stabilise at, a safe speed will risk loss of control — and don't think there is a discernible lag in the ASI; there isn't if it is in good condition and the pitot-static system is unobstructed. If the pilot lowers the nose to the glide attitude and immediately performs just a moderate 'bank and yank' manoeuvre, the aircraft may stall and spin. At least five seconds will elapse from the moment the pilot pushes the stick forward to the time the airspeed margin over stall is safe enough to carry out a gentle manoeuvre. The diagram below represents the result of Mike's tests in a simulated (and placid) EFATO when climbing at 55 knots (about 1.3 Vs of 42 knots). Similar results were found in other tests. The diagram doesn't show the 3–5 seconds reaction time for the average pilot, as the pilot for the test series was conditioned to an expectation of the throttle being pulled by the observer. During the pushover, the control column was pushed forward smartly enough and far enough to unload the wings to perhaps 0.5g or less, so that the aircraft is still totally controllable even if the airspeed reduces below the normal Vs1 of 42 knots. At 0.5g the airspeed will build relatively quickly because the lift will be nearer zero and thus induced drag is reduced to nearer zero. Unloading the wings is a good practice to practise As mentioned in the flight envelope section of the 'Don't fly real fast' article a light aircraft can be safely held at sub-Vs speeds for several seconds by unloading the wings so that the aircraft is operating in the reduced-g band between zero g and +1g, but not in negative g. The stall speed between +1g and 0g is still proportional to the square root of the wing loading g ratio, as indicated in Table 4.1. Table 4.1: stall speeds at positive loads below +1g Load factor Square root Stall speed knots +1g 1 42 +0.75g 0.86 36 +0.5g 0.70 30 +0.25g 0.5 21 0g 0 0 Note: when the wings are unloaded, ailerons and rudder can be used in ways that would be regarded as excessive at 1g loads. This unloading technique also has value as a stall recovery exercise (at a safe height) for pilots to really comprehend what is going on. It involves unloading the wings to perhaps 0.25g by pushing sufficiently forward on the control column so that you feel very light in the seat but not yet constrained in the harness as you would be if imposing negative g — or if dirt and dust start floating up from the floor. When unloaded — which takes an instant — roll the wings level (holding near zero g of course) using full aileron and whatever rudder is necessary (often quite a lot), and centre the aileron and rudder as soon as the wings are level. As drag at that minimum aoa is much reduced, speed will build more quickly and thus dive recovery is started earlier. With practice, the total height loss by taking such decisive action may be less than in a gentle reaction, and the speed will stay well within the allowable envelope in most recreational light aircraft. There will not be any fuel system problems as long as negative g is not applied. However, if forward pressure is slightly relaxed and the aircraft allowed to return to its normal 1g state while airspeed is below Vs1, the wing will promptly stall. 6.5.2 Practice good energy management in the take-off! Planned energy management during the initial climb Following engine failure in the climb, the total energy available is the sum of kinetic energy and potential energy of height. As shown above, a lot of that kinetic energy is lost to drag in the 6–8 seconds following loss of power. The potential gravitational energy must be converted to kinetic energy so that the total energy level of the aircraft is maintained, albeit at a lower level than that immediately prior to the power loss. There may not be enough time available to regain enough speed within the remaining height to have sufficient energy to arrest the rate of sink (i.e. flare) for a normal landing. A heavy or very heavy landing is then almost inevitable. For example, the low-momentum Thrusters and Drifters have thick high-lift wings that give their best climb rate [Vy] at about 50 knots. They probably need about 150 feet to build enough airspeed to enable the aircraft to be flared for a normal landing; obviously, more slippery aircraft need less height. The solution to this potential problem is planned energy management during the initial climb. Don't use the recommended speed for best rate of climb, use a climb speed perhaps 10–20% higher until at 200–250 feet, then steepen the climb a little to maintain Vy. The loss of initial climb performance won't be particularly significant but the additional speed in hand will make a difference if you lose thrust at a critical height. Of course, you may prefer to maintain the higher speed as a cruise-climb speed, particularly if there is a reasonable headwind or a tendency to overheat. What about using the best angle of climb speed for initial climb? Vx should not be used in normal operations — it should be regarded as an emergency climb speed. The high pitch attitude, high aoa and low speed provide a very limited safety margin if power is lost. If an airstrip is so marginal that you consider you must use Vx to clear obstructions at the end of the strip — or worse, out-climb rising terrain — then you should not be using that airstrip. If you absolutely have to use Vx for obstacle clearance then lower the nose to a safer climb speed as soon as possible. 6.5.3 Always be ready to implement plan B! Have a mental 'what if?" action plan Pilots must always be prepared for the possibility that the engine/propeller will lose thrust during the take-off and climb out (or at any other time during flight), and have simple pre-formulated mental action plans for the particular airfield/strip/runway conditions and various failure modes — remembering that, depending on height if the engine fails, there may be little time to do much else but keep your eyes outside the office, select the landing run and fly the aeroplane. One thing though — it is important to close the throttle early enough to avoid the engine suddenly regaining full power at an inopportune time; e.g. just as you are about to flare, thus driving the aircraft into the ground — which has happened on occasion. If there is any thought that something is not quite right during taxying, run-up or the take-off ground roll, the flight should be abandoned immediately. A surprising number of pilots disregard indications/warnings that something is not as it should be and press on to an inevitably expensive reminder that engine/fuel/propeller problems cannot fix themselves. It'll be okay? Not likely! On-field landing If the aircraft is very low when the engine fails the only option is to keep the wings reasonably level, the slip ball centred and land more or less straight ahead. So the minimum action plan would be: If loss of thrust or other problem is evident, immediately push over into the approach attitude while keeping the slip ball centred. If loss of thrust is accompanied by extreme vibration or massive shaking of the aircraft (possibly due to a propeller blade failure), it is important to immediately shut down the engine to avoid it departing from its mountings. Do nothing else while waiting the few seconds for the aircraft to stabilise at a safe speed — except hold that attitude, keep your eyes outside and decide the landing run; probably there will be little time or opportunity to conduct any cockpit or radio drills prior to touchdown. Ensure the throttle is closed, lower full flap or sideslip if height permits, then land the aircraft. Be careful to avoid wheelbarrowing. Brake hard and/or ground loop if necessary to avoid collision. The groundloop is induced by booting in full rudder (and brake) on the side to which you want to swing and will probably result in some wing tip, undercarriage and propeller damage, unless you impact something other than the ground. Running it into long grass will help slow the aircraft. There have been occasions, even at small airfields, where a recreational light aircraft losing power at 200 feet or less had sufficient height to safely turn 60–90° and land on, or parallel with, an intersecting strip. Of course, the pilot in those reported cases has been quite familiar with the aircraft's capabilities and had commenced take-off with little or no runway behind. Off-field landing If some height has been gained but there is no possibility of landing on the airfield, then an off-field landing is mandatory. Look for somewhere to put it down but don't immediately fix on the first likely landing site spotted straight ahead of you — there may be a more suitable site closer. However, you have to rapidly assess your height and airspeed (i.e. your energy level), and the turn possibilities available; i.e. can you safely turn through 30° or 45°, perhaps 60°, and still make it to that much better looking site? Will the wind assist or hinder? How much height will be lost in the turn? It has to be a quick decision because at best you have just a few seconds available to plan the approach. If any doubt go for 'into wind' and remember you can't stretch the glide! Do not choose the site at marginal distance, even if it's perfect. Close by is better because the height in hand can be used for manoeuvring the aircraft into the best approach position. Because you have no power available you must always have an adequate height margin to allow for distractions, misjudgements, additional loss of height in turns, adverse wind shifts, sinking air, turbulence and other unforeseen events — and you can dump excess height quickly using full flap or sideslipping. Remember that the rate of sink whilst sideslipping is high and the slip must be arrested before the flare. Some major factors affecting the outcome of a forced landing are highlighted in the previous module 'Don't land too fast in an emergency' and it is not my intention to list all factors that might be assessed in the decision making process following EFATO. Suffice to say, it is impossible to assess everything in the few seconds available, hence the need for prior knowledge of the airfield environs, plus a pre-established plan B and intuitive procedures for any situation that may occur before you are established at a safer height. Apart from being clearly within range the choice of landing site is affected by: wind strength and direction ground run availability and direction; a short into-wind site may be preferable to a longer but crosswind/downwind site for an aircraft with a low stall speed; the reverse applies for an aircraft with a high stall speed. It all relates to kinetic energy and stopping distance approach obstructions; final approach may require some diversion around/over trees, under/over power-lines plus avoidance of other obstructions. Can the near-ground turns be handled safely? Is there sufficient margin for misjudgement and/or wind gusts? ground surface and obstructions, including livestock, during the ground roll. Can you steer to avoid them? Are livestock or kangaroos likely to take fright and run into your path? the energy absorbing properties of the vegetation ground slope: the possibilities of landing downslope may range from difficult to impossible; moderate upslope is good if the pre-touchdown flare is well judged. There is a much greater change in the flight path during the flare; for example, if the upslope has a one in six gradient (about 15°) and the aircraft's glide slope is 10° then the flight path has to be altered by 25° so that the aircraft is flying parallel to the upslope surface before final touchdown. A higher approach speed is needed because the increased wing loading during the flare (a turn in the vertical plane) increases stall speed. If the wind is upslope then a crosswind landing may be feasible if a rural road is chosen can you avoid traffic, larger trees, drainage ditches, wires and poles, particularly in a crosswind situation? a final approach into a low sun should be avoided so that vision is not obscured. All of this is impossible to assess in the few seconds available, hence the need for prior knowledge of the airfield environs and a pre-established emergency procedure for any situation that may occur before you are established at a safe height. As height increases, the options increase for turning towards and reaching more suitable landing areas, making a short distress call and doing some quick trouble shooting. Trouble-shooting When trouble-shooting full or partial power loss remember the first edict — constantly 'fly the aeroplane!'. If the engine is running very roughly or died quietly (i.e. without obviously discordant sounds associated with mechanical failure) and time is available, then apart from the engine gauges, the obvious things to check or do are: Fuel supply: switch tanks (making sure you haven't inadvertently switched to the 'fuel off' position), fuel booster pump on, check engine primer closed. Air supply/mixture: throttle position and friction nut, throttle linkage connection and mixture control position. Apply and maintain carburettor heat (while engine is still warm), setting the throttle opening at the normal starting position. Apply carburettor heat or select alternate air to bypass the air intake filter — which could be blocked by grass seeds or a bird strike. Ignition: position of ignition switches — and try alternating switches in case one magneto is operating out of synchronisation. Or: reverse the last thing you did before the engine packed up. And then: try a restart. There is no point in continuing with a forced landing if the engine is really okay. Cockpit check prior to touchdown Pilot and passenger harnesses must be tight and maybe remove eyeglasses. Seats should be slid back and re-locked in place (if that is possible without adding to the risk) but be aware of the cg movement. Advise the passenger of intentions, warn to brace for impact and advise evacuation actions after coming to a halt. Unlatch the doors so that they will not jam shut on impact. If the aircraft has a canopy or hatch take similar safety action, if that is possible without the canopy affecting controllability or detaching and damaging the empennage. If equipped with a retractable undercarriage, leave the wheels down unless surface conditions indicate otherwise. To minimise fire risk turn the ignition, fuel and electrics off. It is important to research and develop your own safety plan, including the cockpit and radio drills, so that it is more deeply ingrained and appropriate to your capabilities and the aircraft being flown. Don't just adopt a plan published by someone else. Before moving onto the runway for take-off, do a mental rehearsal of plan B; such rehearsal is a powerful safety aid. As height achieved before engine failure increases, the options increase for trouble-shooting, turning towards and reaching more suitable landing areas; making a distress call on a selected frequency; properly securing the fuel, ignition and electrical systems; and for an adequate cockpit check prior to touchdown — but all in accordance with the plan. Partial thrust loss If the engine/propeller does not fail completely but is producing sufficient thrust to enable level flight at a safe speed then, if you can't determine the fault, it may be possible to return to the airfield. Make only moderate turns, maintaining height if possible without the airspeed decaying, and choose a route that provides potential landing sites in case the engine loses further power. It's a judgement call whether you should take advantage of a possible landing site along the way because the off-field landing may damage the aircraft and perhaps injure the occupants. But that must be weighed against the chance of further power loss producing a more hazardous situation; it is usually considered best to put the aircraft down at the first reasonable site. If there is insufficient power to maintain height, then of course you must set up an off-field landing. Intermittent power If the engine is producing intermittent power, and you can't determine the cause using your Plan B trouble-shooting schedule, it is probably best to use that intermittent availability to get to a position where a glide approach can be made to a reasonable off-field site. Intermittent power negates the ability to conduct a controlled approach and could get you into a dangerous situation. So having achieved a position where you can start a final approach, then secure the engine by shutting down the fuel, ignition and electrical systems. Securing the engine early means it will be colder at touchdown, reducing fire risk, but it mainly gets that job out of the way so you can concentrate on flying. STRICT COPYRIGHT JOHN BRANDON AND RECREATIONAL FLYING (.com)
 -
6.4 Don't land too fast in an emergency
Admin posted a tutorial in Decreasing exposure to aerodynamic risk
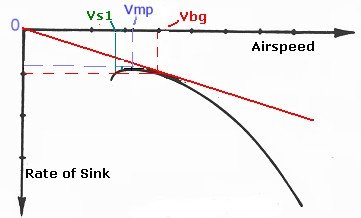 Forced landings in recreational aircraft — due to engine/propeller failure or fuel starvation, exhaustion or contamination — are certainly not uncommon; but our pilots cope well and, in terms of injury, recreational aviation forced landings are generally uneventful. But occasionally something goes wrong. Light aircraft accident statistics from the US indicate that the most prevalent cause of a forced landing gone wrong is because the approach is too fast, leading to a heavy impact perhaps followed by a bounce and capsize. Could this happen to you? While flying at 3000 feet near Rochester, Vic in the company of two other aircraft, the pilot of the Corby Starlet reported that his engine had stopped. The landing area selected was a flat irrigation bay 40 metres wide extending 575 metres north-south and covered with short [50 mm] grass on a firm base. There was an east-west fence line across the bay approximately 175 metres in from the north boundary leaving 400 metres unrestricted for the landing. It would have been difficult to see this fence from a distance, however the aircraft had not made contact with it. Landing was from the north on a heading of 180 degrees. At about 410 metres from the northern boundary of the bay or 235 metres into the available landing area (165 metres remaining) were the start of the fresh wheel markings on the ground. They continued south for about 48 metres. It appeared that the plane may have then lifted off the ground for a short distance and then touched again. The wheel marks then continued for about 54 metres to an impact point where the plane hit a mound beside an irrigation drain. It was flung into the air, striking a fence and landing inverted on an internal farm road. The witnesses to the fatal accident, including two people on the ground, described the final approach of the aircraft's emergency landing, as "looking too fast" and again, the aircraft "flying and descending to about half a metre above the ground and maintaining that height above the ground". The touch down was made two thirds of the way along the available field . "His speed did not seem to drop in the length of the field." Ground level wind was reported to be nil. 6.4.1 Kinetic energy The safe outcome of a forced landing depends greatly on controlling the landing, which then depends on an approach that minimises the vertical velocity and the forward (ground) velocity at the selected touch-down position. This is followed by a ground run that dissipates all kinetic energy and minimises the risk of the aircraft hitting something large and unyielding. Note: the kinetic energy of a body is due to its spatial motion and equals ½ mass × speed squared ( ½Mv² — I have used the uppercase M as the symbol for mass to distinguish it from the metre). In aviation when we discuss energy management the aircraft speed (in the equation KE=½Mv²) is that which is relative to the air; i.e. the true airspeed. For the purpose of measuring the work that has to be done to bring the aircraft to a halt on the ground — which equals the kinetic energy relative to the ground — the speed is not airspeed but the velocity that is the resultant of groundspeed and rate of descent. So, touching down into wind will make a big difference to the kinetic energy level of the horizontal component of the aircraft's velocity. In nil wind conditions the kinetic energy of a 270 kg gross weight aircraft touching down at a speed of 30 knots (15 m/s) is ½ × 270 × 15 × 15 = 30 000 newton-metres [N-m or joules]. Whereas that of a 540 kg gross weight aircraft touching down at 45 knots (22.5 m/s) is 137 000 N-m, nearly five times greater. This underlines the fairly obvious expectation that very light aircraft landing at slow speeds have very much less kinetic energy to be dissipated. Correct touchdown is the most important survival skill in a forced landing and the touchdown velocity is a critical factor. For example, if the 270 kg aircraft's ground speed was reduced by 7 knots (25% reduction) to 11.5 m/s, because of landing into wind, then the kinetic energy would be reduced by 40% to 18 000 N-m. On the other hand if that aircraft was landed downwind then ground speed would be 37 knots (18.5 m/s) and the kinetic energy to be subsequently dissipated would be 46 000 N-m — 2.5 times greater than landing into wind. The landing ground roll, on a smooth unobstructed surface, would also be about 2.5 times greater. So, there is a very significant advantage in landing into wind but perhaps other conditions, such as the clear landing distance available, may negate this. Light aircraft accident statistics in the US indicate that the most prevalent cause of a forced landing gone wrong is because the approach is too fast and too high, leading to a hard touchdown followed by a bounce and capsize. This is probably because of a tendency to add a 'safety' margin (5–10 knots) to the optimum glide speed. The second most common factor is the natural tendency, when faced with some unexpectedly hostile terrain or the inability to clear an obstacle, to 'stretch' the glide distance by raising the nose — this may then lead to an uncontrolled impact in a most unfavourable attitude. Similarly when faced with an obstacle such as a powerline many pilots choose to pull up over it rather than taking a possibly safer path under it. Keep in the forefront of your mind, a controlled collision with an object is far preferable to an uncontrolled stall 50 feet above the surface — the latter generally results in total destruction. 6.4.2 Minimising impact energy in a forced landing The problem with always using the best glide speed for distance Following power loss the importance of establishing the aircraft at the best glide speed for distance [Vbg], appearing in the aircraft flight manual or pilot's operating handbook [POH], is emphasised in training and in the text books. This emphasis is valid to the extent it provides a reasonably safe initial flight speed to attain and hold whilst ascertaining the situation, planning appropriate actions and subsequent manoeuvring into the final approach position. In simulated engine failure procedures Vbg is often used throughout the approach simply because it is safer to do so; but it may not be best practice for the real thing. See 'V-speeds' for an explanation of the various codes. Note: the Vbg stated in the POH is for MTOW and should be decreased by half the percentage reduction in aircraft weight from MTOW — and of course the Vs1 and Vso stall speeds decrease in the same way. For example when there is no passenger in a two-place aircraft gross weight might be 16% below MTOW thus Vs1/Vso and Vbg (and Vmp below) are all reduced by 8%. So if the POH states Vs1 is 40 knots and Vbg is 60 knots but actual operating weight is 16% below MTOW then adjusted Vs1 and Vbg are 37 knots and 55 knots respectively. There is often an impression that in an emergency the pilot should peg Vbg and stay with it otherwise the consequences may be dire. (This concept possibly pre-supposes that a reasonable landing site is always at extreme range and that Vbg is a fixed value.) What may not be mentioned is though Vbg provides the lowest glide angle (the flattest path and hence the longest air distance), it provides neither the lowest forward speed nor the lowest rate of sink i.e. the lowest kinetic energy. (The term 'rate of sink' is synonymous with 'negative rate of climb'.) Airspeeds lower than Vbg should generally be used when in the final approach stages in a real forced landing. Vmp — the speed for minimum rate of sink When close to a possible landing site, Vmp — the minimum power (i.e. drag × speed) or minimum rate of sink airspeed — is the speed that will provide the greatest time to survey possibilities. It is also the speed providing minimum kinetic (i.e. impact) energy conditions. The airspeed/sink rate polar curve diagram at the left is a generalised plot of the relationship between rate of sink and airspeed when gliding an erect light aircraft in still air with the propeller stationary (a windmilling propeller increases drag); it is essentially an inverted power curve. Stall point is shown at Vs1. Vmp is at the highest point of the curve. The best distance glide speed is ascertained by drawing the red line from the zero coordinate origin tangential to the curve (i.e. just touching); the point of contact is where the ratio of rate of sink to airspeed is at a minimum and Vbg is directly above that contact point. Also the angle between the red line and the horizontal is allied to the angle of descent and it is obvious that Vbg occurs at the smallest possible descent angle, though it can be seen that even in nil wind conditions Vbg is not a clearly defined point value; rather, it's the mid-point of a speed range for maximum glide distance. It is apparent from the curve that any glide speed between Vmp and Vbg will provide a lower forward speed than Vbg, together with a slight reduction in rate of sink. Of course the glide path will be steeper, thus distance achieved from any particular height will be less than that achievable at Vbg. For example with Vbg of 60 knots (30 m/s) and a sink rate of 3 m/s an aircraft at a height of 60 metres would remain airborne for 20 seconds and travel forward 600 metres in nil wind. At Vmp of 50 knots (25 m/s) and a sink rate of 2.75 m/s the same aircraft would remain airborne for 22 seconds and travel forward 550 metres. (To convert feet per minute to metres per second divide by 200.) At speeds greater than Vmp there is the possibility of converting glide momentum into height maintenance for a period. However, at Vmp or lower, there is no possibility of converting glide momentum into short-period maintenance of height; any control change will result in an increased sink rate. In the diagram the Vmp is shown at around 1.2 times Vs1 and Vbg around 1.4 Vs1. The angle of attack at Vbg may be around 4–5° and perhaps 7–8° at Vmp. The increasing aoa at the sub-Vbg speeds reduces the safety margin between flight speed and stall speed so, at low altitudes, airspeed should only be reduced to Vmp in a stabilised approach after all significant manoeuvring is complete and surface obstructions are apparent. Descent at Vmp in poor visibility lessens impact a little if surface or obstruction contact is inadvertently made before flaring. In turbulent conditions the pilot must balance the possible safety of a higher airspeed against the higher impact forces brought about by that extra speed. We discuss the effects of low-level turbulence and wake vortices in 'Wind shear and turbulence'. Also pilots, particularly of low-momentum recreational light aircraft, should be aware that if a wing tip is first to make contact at low forward speed there is a possibility of cartwheeling. The penetration speed Much is said about the importance of maintaining the 'best gliding speed' during the descent but what is important is to maintain an optimum glide speed; a penetration speed that takes atmospheric conditions into account; for example, sinking air or a headwind. The gliding community refers to this as the speed to fly so that the ratio of rate of sink to ground speed is at a minimum. The normal recommendation for countering a headwind is to add one third to one half of the estimated wind speed to Vbg, which increases the rate of sink but also increases the ground speed so the ratio will again approach the minimum. For a tailwind, deduct one third to one half the estimated wind speed from Vbg, which will reduce both the rate of sink and the groundspeed, and of course there is a limit to any airspeed reduction. Bear in mind that, for safety, it is better to err towards higher rather than lower airspeeds. To illustrate the speed to fly, the polar curve on the left indicates the optimum glide speed when adjusted for headwind, tailwind or sinking air. For a tailwind the starting point on the horizontal scale has been moved a distance to the left corresponding to the tailwind velocity. Consequently the green tangential line contacts the curve at an optimal glide speed that is lower than Vbg with a slightly lower rate of sink. This is the opposite for a headwind — shown by the purple line. For sinking air the starting point on the vertical scale has been moved up a distance corresponding to the vertical velocity of the air. Consequently the pink tangential line contacts the curve at a glide speed higher than Vbg. 6.4.3 Kinetic energy can really hurt! Kinetic energy increases exponentially You may find pencil and paper a helpful back-up from here. The kinetic energy [KE] of a body is due to its motion and equals ½ mass × speed squared [½Mv²], thus as speed changes linearly KE changes exponentially. For example a 540 kg aircraft with a stall speed of 42 knots CAS might have a Vmp around 50 knots CAS, so in nil wind conditions the KE when touching down at 50 knots (about 25 m/s) is ½ × 540 × 25 × 25 = 169 000 newton-metres [N-m]. Vbg for the same aircraft might be 60 knots CAS (near enough to 30 m/s) and touchdown KE at that speed would be ½ × 540 × 30 × 30 = 243 000 N-m; a 44% increase in energy at touchdown because of a 20% increase in speed. The distance required to bring the aircraft to a safe stop is directly proportional to the touchdown energy, as is the impact energy, if the aircraft and occupants come to a premature halt. The pilot of a low-momentum recreational light aircraft is exposed to much less KE. For example consider a 270 kg aircraft with a stall speed of 28 knots, Vmp 34 knots (17 m/s) and Vbg 40 knots (20 m/s). At Vmp touchdown KE = ½ × 270 × 17 × 17 = 39 000 N-m, while at Vbg touchdown KE = ½ × 270 × 20 × 20 = 54 000 N-m. The aircraft weight is half that of the heavier aircraft but impact KE is one-fifth. Kinetic energy is substantially affected by wind velocity Usually when we discuss in-flight energy management the aircraft speed (in the equation KE=½Mv²) is that which is relative to the air — the true airspeed. However, for the purpose of measuring impact energy or the work that has to be done — i.e. the energy expended — to bring the aircraft and occupants to a stop, the speed is not true airspeed but the velocity resultant of ground speed and rate of sink; thus touching down into wind with a low sink rate will make a very favourable difference to energy level. If the 270 kg aircraft's Vmp ground speed is reduced by 6 knots (18% reduction) to 28 knots (14 m/s) by landing into a 6-knot wind then KE is reduced 33% to 26 500 N-m. In the same conditions if that aircraft was landed downwind then ground speed would be 40 knots or 20 m/s, and the KE to be subsequently dissipated would be 54 000 N-m — the possible impact would be twice as great as landing into wind — and 6 knots is just a pleasant light breeze. The figures for the 540 kg aircraft landing at Vmp with a 6-knot headwind and tailwind are 131 000 N-m and 212 000 N-m respectively; quite a difference from the nil wind impact of 169 000 N-m even with just that light breeze. (It also underlines the fairly obvious expectation that low-momentum recreational light aircraft landing into wind at minimum speeds don't have a lot of energy.) There is a very significant advantage in a low-speed into-wind forced landing, but other conditions — such as clear landing distance available — may modify this. A worse case is when the aircraft touches down both fast and downwind. For example if our 540 kg aircraft touches down somewhat fast, say 65 knots CAS, with a 6-knot tailwind then the KE at touchdown is ½ × 540 × 35.5 ×35.5 = 340 000 N-m; twice the energy at 50 knots in nil wind conditions. It also reinforces the point that, with the ever-present possibility of engine stoppage or degraded performance, it's a silly decision to take off downwind, no matter how long the distance available — unless it's a one-way downhill strip. But let's look at the case where only the pilot is on board, our aircraft weight is 16% below MTOW at 454 kg, and the pilot lands at a Vmp reduced by 8% to 46 knots into a 6-knot headwind. Then the KE at touchdown is ½ × 454 × 20 ×20 = 91 000 N-m, a very significant decrease from the previous 340 000 N-m. High density altitude adds kinetic energy Density altitude also affects KE because TAS is about 1.5% higher than CAS for each 1000 feet of density altitude. For example the density altitude at Armidale, New South Wales (elevation 3500 feet) with temperature of 30 °C would be around 6000 feet, which means that the TAS will be about 9% greater than CAS. So using the preceding example of 540 kg touching down at 65 knots CAS, the TAS at 6000 feet density altitude would be 71 knots. So adding the 6-knot tailwind for a touchdown groundspeed of 77 knots the KE is then ½ × 540 × 38.5 ×38.5 = 400 000 N-m. The density altitude adds 60 000 N-m; quite a lot of energy that you need to be aware of. Always bear in mind that Australian climatic conditions are significantly warmer than the latitude 40°– 45° N climate on which the International Standard Atmosphere (and consequently airspeed indicator dial calibration) is based. In summer day temperatures the airfield density altitude would be from 2000 feet to 3500 feet greater than the airfield elevation. See The Civil Aviation Safety Authority declared density altitude charts. You must expect that TAS is significantly greater than IAS. Doing the KE calculations for the aircraft you fly Kinetic energy calculation is easy if you first halve airspeeds and windspeeds to convert from knots to metres per second and express the operating weight (mass really) in kilograms; i.e. KE= ½ operating weight × groundspeed squared — the result is in newton-metres or joules if you prefer. 6.4.4 Plan and control the potential crash! Be well prepared There is some element of chance in every emergency landing (Murphy's Law suggests that what can go wrong will go wrong, and at the worst possible time), but being well prepared and keeping cool (but not so cool that you freeze up) are by far the most important factors in deciding the outcome. A safe outcome greatly depends on placing occupant safety before airframe loss, knowing your aircraft, and on fully controlling the approach and landing/crash. The latter depends, firstly, on carefully flying an approach (having selected the best readily attainable landing site) that finally minimises the forward speed and the sink rate at a nose up/wings level touchdown; thus minimising impact angles and better distributing the initial impact forces. It is best to dissipate excess energy as drag while still in the approach by using full flaps or side-slipping; both together if acceptable, though some aircraft are downright dangerous if side-slipped with full flap. Secondly, plan the direction of the subsequent ground travel so the remaining energy is substantially dissipated before the occupant enclosure hits something large and unyielding, or a barbed wire cattle fence, or the aircraft overturns. In short; you must plan and totally control the flight all the way into the potential crash. So what final approach speed should be chosen? Comment from CAR 35 engineer Dafydd Llewellyn: "It is often difficult to hold a steady speed on short final, even if there is no wind shear; it is not commonly appreciated that most aeroplanes have considerably degraded longitudinal stability in the landing configuration. Firstly, they have a greatly increased pitching moment coefficient due to flaps etc and secondly, they are close to or below the minimum drag speed — and both of these effects tend to make them speed-unstable. This is reflected in FAR 23.175, which requires a positive stick-force gradient in the landing configuration, with power off or only with sufficient power to maintain a 3 degree angle of descent. Try it with more power that this, and you will often find — especially if the cg is somewhat aft — that the thing cannot be trimmed to any given speed; it's actually negatively stable (this is the reason such care is needed in a baulked landing). If disturbed in speed, by turbulence for example, it will continue to slow down or speed up. The stick force versus speed gradient may be positive below this power, but it's usually pretty small, so the thing is a lot less stable than in cruise. This is why it's so critical to keep an eye on the ASI, in those phases of flight, and almost certainly the root cause of the high proportion of accidents that occur in the landing and aborted landing phases. Most pilots are not aware of this." After considering the trade-off between adequate controllability, margin from stall, and excess kinetic energy the optimum speed over the fence is probably 1.3 times Vso (the stalling speed in the landing configuration at the particular operating weight); it will be 3– 4 knots faster than the corresponding Vmp. Add no more than 5 knots in gusty conditions and resist any compulsion to add any additional 'safety' margin. Make sure Vso and the approach speed are both determined in terms of CAS rather than IAS, as the ASI may have significant, but not comparable, position error corrections at Vso and 1.3 × Vso. Flare with care! In the final approach, the aircraft aoa may be somewhere between 5° and 8°, and the flare to arrest the rate of descent may raise aoa close to critical, and the increased drag will slow the aircraft quickly — thus a rapid increase in rate of sink will follow. It is usually essential that the aircraft is flared gently, smoothly and at the height appropriate for a consequent near-stalled or fully stalled touchdown — but see 'Alighting in tree tops'. In some aircraft the loss in slipstream (compared with that from an idling engine in a normal landing) may significantly reduce the elevator authority and thus the stick must be pulled back further to flare successfully. If possible, correct crosswind drift before touchdown so that side-impact forces are reduced. (The term 'dead-stick landing' — an 'in-word' used to describe a forced landing following complete loss of power (or a training exercise where the engine is shutdown on approach) — originated during World War I. It is thought to describe the decreased elevator authority following loss of the slipstream in some of those early aircraft. Nowadays the use of the term is deprecated — no one describes a normal sailplane landing as 'dead-stick'.) The possibilities of landing safely downslope may range from difficult to impossible. A strong headwind may make a downslope landing feasible though it is difficult to judge the degree of slope until you are close to the surface and thus committed. Moderate upslope is good if the pre-touchdown flare is well judged. There is a much greater change in the flight path during the flare; for example if the upslope has a one-in-six gradient (about 10°) and the aircraft's glide slope is 6° then the flight path has to be altered by 16° so that the aircraft is flying parallel to the upslope surface before final impact. A higher approach speed is needed because the increased wing loading during the very pronounced roundout/flare (a turn in the vertical plane) increases stall speed. If the wind is upslope then a crosswind landing may be feasible. 6.4.5 Deceleration forces and energy absorption Load factors The KE of a 540 kg aircraft touching down at 45 knots groundspeed is 137 000 N-m. If, in a normal landing on a prepared airstrip, the aircraft is uniformly decelerated to stop 100 metres from touchdown then the deceleration force — the total forces applied to stop the aircraft — is KE/distance (N-m/m) = 137 000/100 = 1370 newtons. The deceleration forces place a load on the aircraft and the airframe transfers a load to its occupants. It is usual to compare such load factors in terms of the non-dimensional 'g ratio' calculated, in this case, by dividing the uniform deceleration force by the aircraft's weight in newtons (its mass in kg multiplied by the acceleration of gravity — close to 10 metres per second per second) which, in the example, would be 540 × 10 = 5400 N. Thus the horizontal deceleration factor is 1370/5400 = 0.25g — just a slight load which probably wouldn't register with the occupants; it can also be seen that the aircraft is decelerating at the rate of 2.5 m/s² (i.e. 10 × 0.25). If the family sedan is brought to a controlled stop under heavy, sustained braking the occupants would be unlikely to experience more than a 1g deceleration. If the aircraft, under uniform deceleration, came to rest in 10 metres then the deceleration force is 13 700 newtons and the load factor is 13 700/5400 = 2.5g. But if uniformly brought to a halt in 5 metres by landing in dense, light scrub then the deceleration force is 27 400 newtons and the forward deceleration load factor is 27 400/5400 = 5g. Of course the aircraft's velocity at impact includes a vertical component, but we will look at that later. It is unlikely that in the early stages of ground travel, after a planned and controlled forced landing approach, a light aircraft would slam head-on into a large unyielding object, such as a large tree trunk or a very large boulder. On the other hand, it is also unlikely that an aircraft will be uniformly decelerated — the surface conditions may be such that varying impact loads (from contact with brush, saplings, stumps, roots, stones, holes, furrows) are intermittently applied to the airframe and occupants from near touch-down until coming to a stop, making it impossible to control direction, or even keep feet on the rudder controls. These multiple impacts result in a series of peak deceleration loads applied for very short periods, probably a few hundredths of a second, and felt as severe jolts; many of these will have a sideward load component. A note of caution. A firm touchdown with no float in ground effect is the aim but if you are forced into dissipating excess airspeed by holding off half a metre above the surface and the undercarriage strikes a rock or stump then the consequences are likely to be more traumatic than if you had pegged it down earlier at the higher speed and then run on into the object. Ground-assisted deceleration is better than ground effect float. The consequences may also not be good if you are holding off and pull back on the stick to avoid tripping over an obstruction. So if the terrain is cluttered with unavoidable obstructions of that nature then it may be best to place the main wheels on the ground earlier even though the velocity, and thus kinetic energy, is higher. If the distance between relatively high obstructions is less than the wing span try to steer a course that will equally distribute the impact forces on each wing so that the cockpit enclosure is not spun around into something unyielding. Of course if landing on a clear surface the aircraft will slow faster with its wheels on the ground than if held in ground effect, but the faster the speed at touchdown the greater the possibility of bouncing. Airmanship is about making and implementing the wisest choice in such difficult situations. For example, when faced with an obstacle such as a rural powerline many pilots might choose to pull up over it rather than taking the possibly safer path under it. That natural tendency, when faced with some unexpectedly hostile surface or the inability to clear a previously unseen obstacle, to 'stretch' the glide distance by raising the nose excessively, may lead to an uncontrolled impact in a most unfavourable attitude. A controlled collision is far preferable to control loss 50 feet above the surface — the latter generally results in severe injury or worse. It is probably better to put it between obstacles that are closer together than the wingspan, than to stretch the glide and then drop-in nose first. Protect the occupant zone by sacrificing the wing structure. It is best to avoid higher-speed impact with a strong, barbed-wire fence by ground looping, if possible. The following is an extract from a detailed incident report by a Boorabee pilot who did everything right when the engine packed up: "... the positioning and timing seemed to come together almost at a crawling pace, but it must have been just a few seconds. The turn onto final had to be made at low level so I made a definite intent to ensure good speed into the turn. Turned onto the final approach high enough to clear the barbed wire fence and fast enough to have full control and touched down beyond the fence parallel with the ploughed furrows ... recall pushing the nose down just enough to ensure longest distance possible for ground roll as the dirt paddock would retard the motion a lot faster than flaring and easing onto the ground halfway up the paddock ... noisy and bumpy ride with underside of pod sliding along top of furrow ... ground looped to halt the aircraft when getting close to the end fence and into cross ploughing ..." Tailwheel aircraft have an advantage over nosewheel aircraft on rough ground. The tailwheel is likely to be pulled over obstacles but even if it is knocked off, the aircraft remains stable and is converted into a true 'taildragger' with its built-in arresting effect. On the other hand recreational light aircraft nosewheel structures are not very strong and if a nosewheel can't be held off then it tends to be pushed into holes and may not ride across or over obstacles — the consequences may be loss of the nosewheel strut and of aircraft ground stability. In the worst case the aircraft nose may dig in and the aircraft flip onto its back; in which case ensure you are in an aircraft where the design includes a structure that rests on itself rather than the occupants heads, and there is an escape route from the inverted cockpit. Some aesthetically pleasing bubble canopies with unobstructed views may be death traps; steel roll-cages/bars or high-wing aircraft are safer. The accident/incident reports indicate a surprising number of aircraft end up inverted following a forced landing or other landing mishap, but certainly for the high-wing aircraft the damage to the airframe is generally not total and injuries are low. If your heart is set on a low-wing or mid-wing aircraft first figure how you and your passenger will escape when it's inverted. Energy absorption From the foregoing it is evident that very little distance is required to bring the aircraft to a safe halt IF the kinetic energy can be dissipated uniformly during ground travel. For example the occupants of the 540 kg aircraft touching down at 45 knots and uniformly brought to a stop over 20 metres would experience about 1.25g deceleration. (In the days of heavy piston-engined aircraft conducting carrier landings the arresting load was 2–3g, which was not uncomfortable when well strapped in.) So where there is no clear, open space to land the aircraft, more or less normally, then an option is to choose an area where the vegetation is of sufficient height and density to absorb much of the kinetic energy and retard the aircraft. If that vegetation is weaker than the aircraft structure so much the better, but the primary consideration is occupant safety so energy absorption by sacrifice of non-vital aircraft structure — i.e. all that outside the occupant zone — is warranted. The requirement of course is to set up the touchdown so the aircraft is moving in a direction where the vital structure is unlikely to slam into an unyielding obstruction at speed. High and dense crops, sugar cane, brush and light scrub all provide good energy-absorbing properties and good cushioning is provided if the aircraft is put down in the proper nose-high attitude so the impact forces have more spread over the aircraft's under-surfaces, rather than just catching at the undercarriage and overturning the aircraft. But even an unfavourable impact angle may not be particularly dramatic; e.g. here is an extract from a forced landing incident report: "The Jabiru impacted the sugar cane in a 20 degree left wing low attitude and came to rest upright after sliding 20 metres." Again — the emphasis is on controlling the crash and spreading the impact loads " ... I decided to land in a cane field ... the Jabiru was held off until it stalled when full left rudder was applied to slew the aircraft sideways to prevent it from going over on its back ... the event was successful and neither of us were injured. Impact forces are less if you touchdown at Vmp or a little higher and then run on into obstructions at the far side of a clearing rather than stall/spin at the near end. The aircraft structure will withstand longitudinal impact forces much better than concentrated lateral impact forces (such as side-swiping a tree trunk), so generally avoid touchdown with substantial drift or slip towards the lower wing, unless you are in a position where the impact loads will be widely spread, as in the cane field landing above. 'Alighting' in tree tops is certainly extremely hazardous and always results in total aircraft write-off. But if the aircraft is flown into a selected, dense crown in a reasonably nose-high attitude (and into wind) — so that some of the initial impact is absorbed by the under-surfaces of the fuselage, tailplane and wings — then the hazard to occupants may be reduced. It is important that the aircraft is not stalled above the tree crowns, because of the possibility of the nose and/or wing dropping into the crown before impact; rather, it should be flown into the canopy at the minimum sink glide speed. The greatest hazard may come from a subsequent slide, of the fuselage remains, from the tree. Easier said than done, but certainly the aircraft must be flown all the way into the crash. The following is a summary of an accident report; the aircraft was a Skyfox CA22, the pilot had 16 000 hours experience and rescue was fast: 'While on cruise at 1100 feet agl the engine failed completely. The pilot set the aircraft for a forced landing into heavily timbered terrain and transmitted two mayday calls. The second call was answered and he gave details of his situation and position. He then maintained control of the aircraft until it touched the top of the tree canopy where he flared steeply, as the aircraft entered the trees, to present the underside of the aircraft for speed reduction and impact damage minimisation. The pilot suffered bruising to one knee and was transported to hospital by an RAAF helicopter. The aircraft was severely damaged.' The following is a report from a Jabiru passenger in another treetop alighting. The pilot, using a runway downslope advantage, took off toward the north with a five to eight knot south-east wind. The pilot had just turned crosswind at about 350 feet agl to avoid a noise-sensitive residential area when the engine died. There was no clear area within gliding distance — only a full expanse of mature eucalyptus trees some 20 to 40 feet high. The pilot lowered the nose to maintain 65 knot best glide speed and turned the aircraft slowly into wind for the landing. The passenger (an RA-Aus CFI along for a ride home) takes up the story. "The trees were rapidly getting closer. They changed from a mass blur to individually defined trees and I prepared myself for the worst. The pilot tried the engine again unsuccessfully, then turned fuel and magnetos off. He started making a mayday broadcast, but before the transmission was complete, there were sounds of trees and aircraft breaking bits off each other as first contact was made. Full marks to my pilot as he unerringly and unhesitatingly flew us right into the tree canopy, our only survival option. This went by the book. The pilot flew us onto a selected tree top, raised the nose a little to slow down our forward airspeed and then expertly used the top of the tree to slow us down still further from an estimated 60 to 40 knots, yet left us with sufficient forward speed to prevent the deadly vertical fall to the awaiting ground immediately below. Seemingly incredible deceleration forces tried to rip me out of my seat — thank goodness for seat belts. We hit a sapling trunk with the inboard section of the starboard wing and decelerated rapidly as we were flung violently to the right. The engine cowling disappeared, exposing the engine which ripped outwards right in front of my field of view, dragging the firewall and windscreen area with it. Next I was aware that we were bouncing backwards, then falling vertically some 10 to 15 feet. We hit the ground with an almighty thud. I became aware of smoke and electrical zapping noises coming from the distorted centre console/instrument panel, which lay on its back with the gauges pointed to the sky. "Get out! Get out!" I yelled to the pilot, who was still sitting in the left hand seat looking a little stunned. I couldn't exit my right-hand side door as something was jamming it. I was keen to get out as quickly as possible as sparks, smoke and arcing were coming from the damaged central instrument console and we had at least 30 litres of fuel sitting in the cockpit right behind us. I followed the pilot out his side door and touched the ground with relief. However, I discovered I was in immense pain, which worsened when I tried to stand up. Due to my fear about being in an 'aircraft inferno' I left the immediate scene of the accident and headed towards the nearest road. I yelled to the pilot to follow me and hobbled off." Deceleration effect of sink rate In a forced landing there is normally no power available to vary the rate of descent or arrest sink, and often high sink rates are not recognised early enough, but it is extremely important that the downward component of the aircraft's velocity at touchdown be minimised. So in the last stages of the approach, after all manoeuvring is completed, the airspeed should be close to Vmp. A high sink rate at touch-down can result in an uncontrolled crash rather than a controlled landing. If the descent rate of our 540 kg aircraft was 300 fpm (1.5 m/s) and this was not arrested in the flare before touch-down, then the kinetic energy of the vertical component of the aircraft's velocity would be 7% (1.5/22.5) of 137 000 = 10 000 N-m. If the undercarriage (which held the aircraft 0.5 m above the ground) collapsed and the downward movement was arrested in 0.5 m then the downward deceleration force is 20 000 newtons and the downward load factor is 20 000/5400 = 3.7 g. Here is a witness comment in an RA-Aus double fatality report: "The take-off on the 1200 metre runway was sluggish and the engine was misfiring. (Fuel was later found to contain a substantial amount of diesel!) The Murphy Rebel continued climbing and turned toward the east then right again onto a low downwind leg. In the mid-downwind position a loud bang was heard and the aircraft then descended flatly ... it appeared that the aircraft had a slow forward velocity but a high rate of descent when it struck ... came to rest 16 metres from the initial impact ... cockpit area and engine bay badly damaged by fire ... the reason for the inadequate airspeed in the forced landing may have been false horizon effect as the aircraft was approaching rising ground." What is most concerning, from a perusal of the accident/incident reports, are the occasions where a forced landing precursor has been the engine displaying ample warning of a problem before take-off or while in the circuit area (as described above) but the pilot seems to have been hoping that it would fix itself and opted to press on — why? What could possibly be gained? Aircraft design regulations The Federal Aviation Regulations Part 23 lays down some crashworthiness requirements for normal category light aeroplanes to give each occupant every reasonable chance of escaping serious injury when the occupant experiences forward loads up to 9g and sideward loads up to 1.5g. So, in theory, if a certificated aircraft touches down under control and decelerates at a constant 9g forward, the occupants should escape serious injury — provided the lapbelts and shoulder harnesses are properly used and cockpit intrusions are avoided. FAR Part 23 also has a 6g downward load requirement. What this means is that it is possible that a normal category aircraft, touching down at 45 knots, running into something sufficiently yielding (for example scrub and small saplings) and decelerating at 9g will come to a halt over a distance of just 3 metres (during a time of one second) with the occupants only suffering body bruising from properly fitting harnesses and perhaps some minor injuries to the legs and arms; provided the occupant zone remains reasonably intact and nothing intrudes into it. Of course, the rest of the aircraft itself will not come out of it so well. Many of the top-end recreational light aircraft fit into that FAR Part 23 'normal' category. By the way, rocket-deployed aircraft emergency parachute recovery systems generally aim for a maximum descent rate of six metres per second (1200 fpm). Minimum ultralights and powered parachutes At the very light-weight, low-speed (55 knots maximum level flight speed) end of the ultralight aircraft spectrum are the homebuilt single-seat minimum aircraft, the airframes of which are often constructed from aluminium tubing and sailcloth. The design, the structural integrity and the impact resistance of such aircraft will certainly not provide the 9g occupant protection required of the type-certificated aircraft but their kinetic energy, when touching down into wind, is very low — in the range 10 000 to 18 000 N-m. In a controlled landing, if such an aircraft was uniformly decelerated to a stop over 5 metres the force would be less than 1.5g. Powered parachutes are in the low end of this minimum category. 6.4.6 Your final defence perimeter — a safe occupant zone Momentum and occupant safety The airframe density per cubic metre of finished structure is generally homogenous but the engine, fuel and occupant bodies have higher densities — thus a higher momentum (momentum = M × v) than the rest of the aircraft — and should all be properly restrained. The engine by very strong mountings, particularly if mounted behind the occupants; and the occupants by an adequate seat/restraint system so that the core fuselage structure, engine and occupants all decelerate at the same rate even though a considerable part of the aircraft may be sacrificed along the way. Re-read the preceding description of alighting into tree tops. There should be no loose objects in the aircraft — they will become a harmful missile. If the adult body is properly restrained, human organs and their attached blood vessels, will cope with transverse deceleration loads very much greater than 20g — applied for short periods. However the spinal column has a much lower tolerance to downward deceleration loads; i.e. loads applied parallel to the spinal column. In this aspect the skeletal structure is much weaker than the aircraft under-structure and downward deceleration loads may result in serious spinal injury — thus the importance of minimising the vertical velocity at impact. Occupant restraint system The pelvis-hip girdle is the strongest part of the body structure and the body's centre of gravity lies between the hip bones. The better occupant restraint systems usually consist of a seat and seat-back, a firm seat cushion, a lapbelt angled to hold the hips into the internal corner of the seat and a shoulder harness system to prevent forward/sideways movement of the upper torso. Shoulder harness systems are usually an adjustable webbing strap over each shoulder that clip to the lapbelt; the shoulder harness may incorporate an inertia reel system. A lap and sash belt, as used in the family sedan, is effective and might be used in a minimum aircraft. The following should be noted: The occupant restraint system must be designed for the occupant(s) and the conditions likely to be experienced in that aircraft. The airframe or seat attachment positions and angles for the harness system must be such that the adjusted lapbelt will remain across the occupant's hips and the shoulder straps on the shoulders during impact. The diagram is an example of the harness geometry guidance material from BCAR S. If the seat should collapse or the seat back fails during impact, there is a possibility that the occupant's body may then slip forward beneath the lapbelt. The same problem — submarining — can occur if the lapbelt hasn't been tightened sufficiently or if a badly designed seat slopes downward from back to front. If submarining occurs and the forward slide is sufficient that the lapbelt is repositioned above the pelvic girdle, then consequent impact loads (and the rotation of the body about the lapbelt) can cause abdominal and spinal injuries. Extended submarining has resulted in strangulation by the harness. These problems are readily overcome by incorporating a fifth strap (the crotch strap) into the harness, locking the lapbelt in position against the pull of the shoulder straps and preventing bodily slip. When fastening the harness, first position the body correctly in the seat then follow the correct fastening and tightening sequences — lapbelt across the hips not the abdomen, pulled very tight (then the crotch strap if fitted), and then the shoulder harness reasonably tight but without displacing the lapbelt position. Don't totally release the shoulder harness straps in flight to facilitate easier movement; you may neglect to re-attach them properly in an emergency. Perhaps the best value safety harness type for a very light 3-axis aeroplane is a Confederation of Austalian Motor Sport approved 5-strap automotive racing harness, which costs less than an "approved" aircraft harness, and probably offers better protection, but any harness is only as good as its anchor points and their position relative to the occupant and their surrounding airframe structure. In a sudden deceleration, momentum carries the upper body forward, stretching the shoulder harness, then stops and the upper body and head whip back. A wide, deep headrest will provide some whiplash injury protection, but a large number of aircraft seats lack headrest protection. During pre-flight inspection check the webbing, inertia reel and fastener condition and integrity and the seat mounting integrity. If the seat is the moveable type check the rail holes or slots; if they are deformed the seat may slide back on take-off or may twist and detach under impact forces. When initially settling in to the seat make sure that you can comfortably — i.e. without straightening your leg — apply full left and right rudder. If you cannot adjust the seat or rudder bar to achieve this, do not fly that aeroplane because you will not have the full rudder authority judged to be needed and provided by the designer. Also there is a high probability that, with the knee joint locked while applying full rudder — to steer the vehicle on the ground or initiate a ground loop — any impact forces transmitted via the rudder bar may severely damage the hip socket. You must be able to apply full rudder with the knee still bent. If the aircraft is fitted with adjustable seats make doubly sure that the seats are locked and in a comfortable position before starting the engine. Do not attempt to relocate the seat position during an emergency landing. Great care must be taken with child restraint systems Infants cannot be carried in ultralight aeroplanes and it is most unwise to carry small children (say under 15 kg) as a passenger; there is no satisfactory restraint system. They cannot extricate themselves and they cannot go for help. Children weighing between 15 and 25 kg should use a government-approved child restraint system [CRS]. The US approved types have 'This restraint is certified for use in motor vehicles and aircraft' printed on them. The CASA advisory publication CAAP 235-2(1) contains more information on CRS standards. Children over 25 kg and 145 cm tall might be restrained safely within a normal fully adjustable four-strap (preferably five-strap) seat harness. A booster cushion might be used if they don't quite make the height. Safest approach is to never carry children who are not old and strong enough to extricate themselves safely (and unaided) from the harness and a wrecked cockpit. Personal protection equipment Perusal of the accident/incident reports for 3-axis aeroplanes shows that rather few pilots or passengers were wearing head and face protection at the time and no doubt some are now wondering why they chose not to wear personal protection. Using the correct type of helmet and inner energy-absorbing pads will provide considerable protection from serious head injury if the occupant zone be deformed, intrusions occur or the restraint system fails. Helmets also reduce the chances of being knocked unconscious in a wreck that subsequently catches fire. There are quite a few high quality sport aviation helmets available, though they are not cheap. Two helmets with face vizors and an intercommunication facility may cost $1500 to $2000. Children must always wear an appropriate helmet and liner. Why do parents who won't allow their child to ride a bicycle in the backyard without a helmet take them flying with no such protection? Crush zones In theory the distance over which the aircraft is brought to a stop is the distance over which the aircraft's centre of gravity travels. Thus provision of an energy absorbing crush zone or deformable structure in the front of the occupant zone, even if it just adds half a metre to the distance, adds to the occupant stopping distance and reduces the deceleration forces on the occupants. Generally the structure of the under fuselage does not incorporate a crush zone to provide some occupant protection from spinal injury, so it is advisable that aircraft with a retractable undercarriage should be landed with the gear down. That will absorb quite a lot of vertical load before collapsing. Some aircraft seats may be designed as a deforming, load-absorbing system in which case it is important that nothing is stowed beneath the seat. In a low-wing aircraft the pilot/passenger seats are probably directly over the main spar — which is obviously built not to collapse — so, if there is no crushable structure between the seats and the spar, the occupants' spinal columns will be directly exposed to the full vertical deceleration. In that case ensure the seat includes something similar to a body-conforming, energy-absorbing, 3-inch thick seat cushion laminated from three layers of Confor urethane foams or similar. Nearly all light aircraft have a fixed undercarriage; there may be a problem with some low-wing aircraft fitted with in-wing fuel tanks if the collapse of the undercarriage causes penetration of those tanks. In a fixed, high-wing aircraft (excluding minimum aircraft) the overhead structure provides a crush zone sufficient to allow exit room from the cockpit if the aircraft pitch-poles onto its back. Also the cockpit is fitted with doors that can generally be forced open when the fuselage is inverted; even when rolled-up into a ball, as seen in this Cessna Skyhawk image. In some low-wing, bubble cockpit canopy aircraft the cockpit area may be the weakest part of the fuselage structure. If such aircraft are involved in a forced landing where the aircraft nose digs in, the occupant zone may distort sufficiently to allow failure of the occupant restraint system; also there have been cases where, during a rapid deceleration, the outward buckling at the cockpit allows the momentum of the rear fuselage to swing itself over the cockpit enclosure. There may be insufficient roll-bar or other structure — except possibly the vertical stabiliser — to prevent crushing of the cockpit canopy in a capsize. Even when a strong roll-bar bow is incorporated, if capsize occurs, unaided exit of the pilot/passenger may be near impossible until the aircraft is lifted. If the aircraft is fitted with a canopy that can be jettisoned in flight, make sure the front canopy bow cannot drop down during the jettison process and scalp the occupants. All occupants should wear safety helmets in aircraft with bubble-type canopies and consider stowing a suitable pry bar/escape axe/fireman's axe in the cockpit. Structure integrity and impact resistance From the foregoing it is evident that aircraft with very low kinetic energy near stall speed require a lesser degree of occupant protection from impact forces and intrusions into the occupant zone — apart from the restraint system. As the kinetic energy at the aircraft stall speed increases, then the aircraft structural integrity and impact resistance must be engineered to provide increasingly higher standards of protection. 6.4.7 Aircraft emergency recovery parachutes Some factory-produced aircraft are now fitted with rocket-deployed aircraft parachute recovery systems as standard equipment. Builders/owners of homebuilt aircraft often choose to add systems which could be spring deployed, mortar deployed or rocket deployed. The parachute recovery systems are primarily intended for use following events such as mid-air collision, catastrophic structural failure, pilot incapacitation, engine failure over difficult terrain or water, unrecoverable or low-level spin, and disorientation/loss of control in IMC. They are generally very effective in such situations. In the case of inflight fire parachute deployment should be delayed as long as possible in order to limit the hang time. The parachute systems are not intended for use in a normal forced landing event except possibly as a braking 'chute in a tight squeeze (see below). The parachute canopies are circular with a central vent (quite unlike a parachute wing), have a diameter around 12 metres for a 544 kg aircraft or 10 metres for a trike, and the length of the harness and lines from the aircraft to the canopy rim would be around 15–20 metres. So, the aircraft may be oscillating on quite a long arm. This oscillation will be greatly increased in gusty conditions as the canopy has a lot less inertia than the aircraft — as powered parachute pilots will be aware. On deployment of the parachute the aircraft may initially experience a deceleration around 3—5g depending on the aircraft's speed, so it is advisable that four-point occupant harness systems are fitted. From activation, it will take perhaps two or three seconds for the parachute to fully open then another four or five seconds for the aircraft to stabilise in the appropriate attitude (wings level and perhaps slightly tail-down to provide additional energy absorption). The aircraft would descend at a target maximum rate around 6 metres per second (1200 feet per minute), at which vertical velocity the aircraft will impact the surface. The undercarriage system is probably designed to absorb energy equivalent to around 3g. The balance of the kinetic energy would have to be absorbed by collapse of the undercarriage and other structural crushing. The horizontal velocity at impact will be the wind velocity near ground level. Depending on aircraft weight, speed and parachute type the loss of height from activation to stabilised descent is likely to be 100–300 feet if deployed when the aircraft is in a reasonably level attitude, so deployment is best activated above that height. However, in emergency conditions the aircraft is not usually in a reasonably level attitude, quite the reverse — it may be steeply banked and nose pitched down, even inverted, so the safe height may be much greater than 300 feet. For tractor-engined aircraft the rocket deployed recovery system is usually installed in the fuselage with the rocket's ascent path slanted at a rearward angle to the aircraft's longitudinal axis. But for a trike, it may be deployed sideways or at 45° to the longitudinal plane; so, there is much to be considered when estimating safe height for deployment. If the aircraft is not established in the appropriate attitude, with the minimum vertical velocity at impact, it is likely that damage will be severe, a combination of the wind velocity and, for example, a nose-down attitude could capsize the aircraft and perhaps drag it a short distance. In an emergency situation below a minimum height the only feasible action may be to activate the recovery system. It would not be the usual practice to deploy a recovery parachute in a normal forced landing, but in a limited space it might be used successfully as a braking parachute if deployed just after touchdown when the aircraft's momentum is low. (When a parachute is deployed above the aircraft it acts as an 'air anchor' and the aircraft's momentum will tend to swing the aircraft upwards which, when near the surface, may then follow with a tail-slide into the ground.) After use the complete system must be returned to the manufacturer's agent for restoration; substantial cost will be involved. Safety pins should be disengaged before take-off and re-engaged after landing; in a low-level in-flight emergency there will be no time available to fiddle with safety pins. The rocket propellant is quite stable; however, it is possible that the ignition system can be activated accidently if the airframe is distorted in a forced landing or a ground accident. An armed rocket is a serious safety risk to anyone attending the site of an accident, so hazard identification and warnings must be provided on the external surfaces of the aircraft. Passengers must be fully informed on both the operation of the system — should the pilot suffer inflight incapacitation — and the dangers of inadvertment activation. Read the CASA bulletin AWB 25-003 'Inadvertent Activation of Rocket-Deployed General Aviation Recovery Device (GARD) During Maintenance'. STRICT COPYRIGHT JOHN BRANDON AND RECREATIONAL FLYING (.com)
 -
6.3 Don't stall and spin in from a turn
Admin posted a tutorial in Decreasing exposure to aerodynamic risk
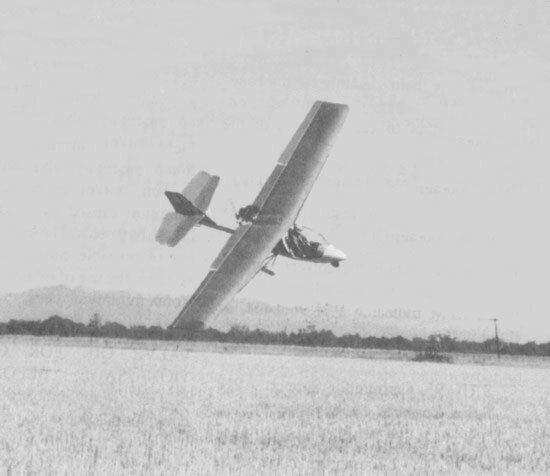 6.3.1 A remarkably easy way to top yourself! How much height might be lost in a stall/spin incident? The pilot in that intended fly-by failed to recognise the stall in the turn and had no time to recover from the consequent first stage spin; he had perhaps only reached 300 feet agl when everything turned sour. The height lost during a normal stall and recovery incident in a very light aircraft is probably between 50 and 250 feet; depending on atmospheric turbulence, the aircraft type, the aircraft attitude at stall, the docility of stall onset and the pilot's awareness of the incipient (beginning or initial stage) stall. However, loss of height in a stall/spin event, as described above, is very much greater, perhaps 100–300 feet during the incipient spin stage, 200–400 feet to stop the autorotation and 300–500 feet during the recovery; a total of 600–1200 feet if the incipient spin is allowed to develop into autorotation. Do YOU make sure you know the accelerated stall characteristics of the aircraft you are flying? Unfortunately many pilots are not wary of the stall onset when the wings are loaded up, because they are used to benign stalls and have never explored an aircraft's accelerated stall characteristics; which will be different — and in some aircraft quite viciously so — to the normal 1g stall characteristics. No pilot can escape from a stall/spin event if there is insufficient height to do so, but prompt recognition of the incipient stall and fast corrective action can save the day. All of which is why low-level stall/spin events are so absolutely deadly and why the only real solution to a stall/spin event is absolute avoidance; all the spin recovery training you may undertake is not going to help once the aircraft is spinning below the minimum recovery height. Stay within the aerodynamic limits and never place the aircraft in any situation which would make such an event possible; fly the aeroplane or, more to the point, make sure the wing and tailplane always keep flying! Never, never indulge your self-supposed ability to produce fast pull-ups on take-off or a wing-over and beat-up. Developed spin recovery training is not included in the RA-Aus Pilot Certificate or the GA Private Pilot Licence syllabus, though stall and incipient spin awareness and recovery are normal parts of both syllabi. However, please read Autorotation — the fully developed spin and Spin recovery confidence building in the flight theory section. This is near to last in an award winning photo sequence of a stall/spin accident. Taken by Ian Ward, published in the 'Wimmera Mail Times' and subsequently in the AUF magazine. In this image autorotation seems to be established with the nose yawing downward and the aircraft rolling to the right. Note the pilot's totally natural ground rush aversion reaction: full back stick (evidenced by the elevator position in all photos) thus holding the aircraft in the stalled condition. Also the pilot is endeavouring to roll the aircraft upright with aileron (starboard aileron down), but consequently deepening the stall, and thus increasing the lift loss and the drag on the down-going and non-flying starboard wing. The pilot had no escape from the inevitable. Failure to recognise the aircraft condition is not confined to relatively inexperienced pilots. In June 2009, the three-pilot crew of an Airbus 330 operating as Air France flight 447 (and following an airspeed indication aberration) failed to recognise that they were holding the aircraft in a fully stalled condition with a pitch attitude of around 16° nose-up and an angle of attack above 35°, while the aircraft was sinking at 10 000 ft/min. The engines were responding normally to pilot inputs. That stalled descent continued for 3.5 minutes from 38 000 feet to the surface of the Atlantic, where all 228 persons on board perished. Similar disastrous failures, on the part of the flight deck crew, to recognise the stalled condition have occurred previously; for example, in 2005 a West Caribbean Airways MD-82 crashed in Venezuela after sinking from 36 000 feet in 3.5 minutes — 160 persons perished. Some refresher notes on the pertinent aspects of aerodynamics Before proceeding further, the following are some refresher notes on a few pertinent aspects of aerodynamics — for those who have forgotten the theory or just can't immediately recall it. • The airspeed at which an aircraft stalls depends in part on the basic wing loading multiplied by an aerodynamic load factor. For convenience the load factor used is the non-dimensional ratio of lift force being generated to aircraft all-up weight but expressed in terms of 'g' acceleration units. So if the lift force generated is 50% greater than the aircraft's gross weight (while at rest on the ground) the wing structure load factor is expressed as '1.5g'. If a wing reaches the critical angle of attack of 15° or 16° when loaded up — i.e. an aerodynamic load higher than 1g — the stalling speed will be higher than the normal 1g stall speed at that particular mass and wing configuration. The effects of that accelerated stall are usually more pronounced than a 1g stall. An accelerated stall is not a 'high speed' stall — the latter is one form of accelerated stall. A V-n diagram has been modified to show the stall speed positions at a 2g load factor (Vs2g) and a 3g load factor (Vs3g). The manoeuvring speed Va in this particular diagram is coincident with Vs4g. This means that if the pilot, or the atmosphere, attempt to apply a load greater than 4g, at or below this airspeed the aircraft will stall. Thus at speeds at or below Va it is probably not possible to reach the positive limit load factor of 4.4g. • Uncoordinated or cross-controlled flight: applying pressure to the rudder in one direction with opposite aileron applied is cross-controlling. (The cross-controlled situation can also be brought about if the airframe is improperly rigged.) This is normally a rather sloppy way to fly but also a condition that can lead to an uncommanded roll and incipient spin if you inadvertently exceed the critical angle of attack [aoa]; particularly in uncoordinated climbing or lower speed descending turns, such as that made in the approach to landing. A planned and properly executed cross-controlled steady sideslip during final approach IS a normal and safe height loss manoeuvre for non-flapped aircraft. (Some afficionados use sideslip in addition to full flap for a really steep, high drag approach — if it is appropriate and beneficial and if the aircraft designer allows it.) • Once established in a coordinated level turn the lower inner wing has slightly lesser airspeed and thus less lift than the outer wing, which produces a tendency for the outer wing to rise and the bank angle to increase. This requires the pilot to apply a slight opposite pressure to the control column which is known as 'holding-off bank'; this is quite normal and probably the pilot may not notice doing so because it should be just part of maintaining the chosen bank angle throughout the turn. In a climbing turn the outer wing has a slightly greater effective aoa than the inner wing and thus additional lift. Combined with its faster speed this reinforces the tendency for the bank angle to increase and the need to hold-off bank. • However, in a descending turn the steeper path of the inner wing means that it will have a slightly larger effective aoa than the outer; this may compensate, or over-compensate, for the faster velocity of the outer wing. In order then to maintain the required bank angle it may be necessary to apply a slight inward pressure to the control column; i.e. in a coordinated descending turn the bank may be 'held on'. Holding-off bank in a gliding turn can lead to a stall/spin condition. • If an aircraft is inadvertently stalled in a coordinated turn, where the ailerons are in the neutral position, both wings usually display the same progressive stall pattern; thus there should be no pronounced wing drop in a well-designed aircraft. In a coordinated climbing turn you would expect the outer wing to stall first, but propeller effects could negate or reinforce this tendency. • When flying at speeds below 1.5 times Vs — generally regarded as the minimum safe speed near the ground, as long as Vs is calibrated airspeed rather than indicated airspeed; see the following Note 1 — the aileron moments are increasingly less effective with diminishing airspeed, so larger aileron deflections are needed to bank the aircraft. There is always a tendency to be more forceful than necessary, thus overbanking the aircraft at a critical stage. The same applies to rudder effectiveness particularly at low power settings. Note 1: many — possibly most — airspeed indicator systems underread or overread considerably at high angles of attack. If the necessary position error correction to IAS to provide the calibrated airspeed [CAS] has not been supplied by the manufacturer or determined by the homebuilder, there is potential for serious misjudgement. For example, if the indicated Vs is 30 knots and there is a position error of minus 8 knots at that aoa, then the corrected stall speed is 38 knots CAS. Consequently if the pilot calculates the minimum safe speed as 1.5 times 30 = 45 knots then the expected 50% safety margin might be only 20%; i.e. 45/38=1.2 times Vs [CAS]. Of course 45 knots IAS will probably not be 45 knots CAS so there is another adjustment in the calculation, but you get the picture. • In the following text 'top/bottom rudder' refers to the relative position of the rudder pedals when turning; 'top' being the rudder pedal opposite the lower wing, thus if the aircraft is banked and turning to the left then pressure on the right rudder pedal will apply top (or outside) rudder, and pressure on the left rudder pedal will apply bottom (or inside) rudder. An excess of bottom rudder produces a skidding turn; too much top rudder produces a slipping turn or may even halt the turn, so producing a full sideslip. (In a coordinated turn there is just sufficient bottom rudder applied to keep the slip ball centred.) • All of the following is applicable to three-axis controlled aircraft but some parts may not be generally applicable to weight-shift controlled trikes. 6.3.2 Do you know how much the angle of attack increases in a turn? As a consequence of providing the centripetal force for a sustained turn, the wing loading (i.e. lift force) must be increased as angle of bank increases. The loading increases rather slowly up to a bank angle of 30° — where it is 15% greater than normal level flight loading — after which it increases rapidly, where it is 41% greater at a 45° bank angle, and so the load factor will be 1.41g. The right-hand column in Table 3 shows the increase in stall speed, which is proportional to the square root of the load factor. You can see that the percentage increase in stall speed is about half the percentage increase in wing loading. Table 3: wing loading and Vs increase Bank angle Cosine Load factor needed [wing loading increase] Vs multiplier [increase] 10° 0.98 1.02g [+2%] 1.01 [+1%] 15° 0.965 1.04g [+4%] 1.02 [+2%] 20° 0.94 1.06g [+6%] 1.03 [+3%] 30° 0.87 1.15g [+15%] 1.07 [+7%] 40° 0.77 1.30g [+30%] 1.14 [+14%] 45° 0.71 1.41g [+41%] 1.19 [+19%] 50° 0.64 1.56g [+56%] 1.25 [+25%] 54° 0.59 1.70g [+70%] 1.3 [+30%] 60° 0.50 2.00g [+100%] 1.41 [+41% The lift force increase in the constant-speed turn is provided by an increase in the lift coefficient [CL], which in itself is brought about by increasing aoa. Increasing aoa while maintaining constant speed produces an exponential increase in induced drag (this is related to the CL²; perhaps doubled at 45°, trebled at 60°) thus resulting in loss of height or change in rate of climb/descent unless power is substantially increased. A rule of thumb for light aircraft with normally cambered wings is that each 1 degree aoa change — starting from 2° and continuing to about 14° — approximates to a 0.1 CL change and each 0.1 CL increase/decrease at a constant airspeed represents a wing loading change of roughly 8%. So, from the table above, a 30° bank angle in a sustained turn adds 2° to the basic aoa for the airspeed, a 45° bank angle adds 5° and a 60° angle adds 12°. The basic aoa for normal descending and climbing speeds in the circuit are probably in the 6–8° and 6–10° regions respectively so anything more than a moderate 30° banked turn makes severe inroads into the safety margin between the effective aoa of some sections of the wing and critical aoa. As well as that, down-aileron increases and up-aileron decreases the aoa of the outer wing sections. Something to be borne in mind is that wing loading must also change with the payload carried, as do the stall speeds and the performance speeds. If a two-seat recreational aircraft is normally flown with just the pilot on board, the aoa associated with a particular calibrated airspeed is significantly less than when flying at the same airspeed with a heavy passenger and perhaps a full fuel load. For example if the aircraft is normally flown with only the pilot on board with an all-up weight of 400 kg but when flown with a heavy passenger, your gear on board and full fuel then all-up weight increases to 540 kg and the wing loading is increased by 35%. Thus, CL and the aoa for any particular IAS/CAS will be greater than that to which the pilot is accustomed; maybe 2–3° at low airspeeds and much less at high airspeeds. All of this means that the low-speed bank angles you use safely at low weight may well be deadly when heavy. 6.3.3 Do you know why loss of control is more likely if the controls are not coordinated in a turn? If an aircraft is being held in a level turn at a particular bank angle with constant power and excess bottom rudder is applied and held, the aircraft will rotate about the normal axis (yaw) in the direction of rudder deflection. Airspeed over the outer wing increases slightly while airspeed over the inner wing decreases, producing a lift differential; so there will be a secondary roll effect that increases the bank angle. At the same time, the yaw increases fuselage drag — which decreases airspeed and thus lift, and the nose drops a little. This is an uncoordinated skidding turn, which often happens when the pilot tries to 'hurry' the turn with bottom rudder instead of increasing bank and we have a situation where the aircraft is overbanking with the nose yawing inward and downward. If the pilot reacts by applying and holding opposite aileron to restore the required bank angle — i.e. holding-off bank — then, due to the downward deflection of the inner aileron, the outer 30% or so of the lower wing is flying at a much higher aoa than the corresponding section of the higher wing. (If equipped with flaperons the whole lower wing would be flying at a higher aoa.) The lower wing will also be producing more aileron drag — mainly because of the increase in induced drag — so the inward and downward yaw will be increased and there will be a tendency for the pilot to raise the nose by increasing control column back-pressure, thereby increasing aoa overall while, at the same time, speed will continue to decrease because of the increased drag — unless power is increased. The pilot is now 'pushing the aerodynamic limits of the flight envelope'. Any consequent tightening of back-pressure on the control column to raise the nose (or any inadvertent back-pressure applied when, for instance, looking at something of interest below you, looking over your shoulder, being distracted by something in the cockpit, using the radio or even any encountered atmospheric turbulence, wake turbulence from preceding aircraft or gust shear) may take the aoa of the inner wing past the critical angle. The aircraft loses its lateral stability (positive roll damping) and it is most likely that the lower wing will drop in an uncommanded roll, and thus become increasingly more deeply stalled than the upgoing wing — which may not be stalled or just partly stalled. Here is a condensed RA-Aus accident report: "The two seat cabin ultralight stalled and spun just as the aircraft was starting the turn onto base. The pilot halted the autorotation and was very close to complete recovery from the descent with wings level when the aircraft contacted the ground. The very fortunate pilot's later explanation was that just as he was about to turn base he heard another aircraft give a base call. While his attention was diverted into searching for that aircraft speed bled off, control inputs were miscoordinated and the aircraft stalled and started to spin." (The pilot's prompt recovery action also demonstrates it is far better to crash in a nearly level attitude rather than in a nose-down attitude.) If that initial roll is not promptly recognised as an incipient stall or partial stall and allowed to continue — or perhaps incorrectly countered with opposite aileron without first unstalling the wing(s) by easing forward on the control column — the increasing aoa of the lower wing deepens the stall and causes greatly increased asymmetrical drag. Additional yawing forces in the same direction as the lower wing come into play, the nose-down pitching moment increases and the nose drops further. This is the incipient spin condition, where autorotation is about to commence; autorotation will happen quickly, and in some aircraft very quickly indeed. The result is the stall/spin fatality you hear about when an unwary pilot allows a spin to develop without sufficient height to recover; and of course you say 'How sad it is for the family' — while thinking (perhaps falsely) — 'but I'm too wary to get caught by such a simple misjudgement! A similar situation may eventuate if the pilot picks up a dropped wing with rudder without first unstalling the wing (see Picking up a dropping wing with rudder) or if an aircraft taking-off exhibits a wing-rocking tendency (because its airspeed is too low) use of rudder could activate an incipient spin. If the cg is aft of the rearward limit (thus closer to the centre of lift) the amount of elevator deflection or control force needed to rotate the aircraft to the critical aoa is reduced; i.e. just a relatively small rearward movement of the control column may rotate the aircraft to the critical aoa. If MTOW exceeds the design limit and/or the cg is aft of the rearward limit then recovery from the initial stall may be impossible. See the stick force gradient. Apart from the weight and balance aspects, the rule to avoid such situations is in proper energy management — always maintain a safe speed near the ground consistent with the bank angle employed, continually envisage the wing aoa, i.e. keep the wing flying and keep the slip ball centred; and never apply an excess of bottom rudder in an attempt to tighten any turn if height is below the safe recovery height (3000 feet agl perhaps) for a fully developed spin. How often have YOU come within a hair's breadth of eternity while being blissfully unaware of it? Pilots need to be particularly careful when sightseeing. There is always a tendency to overbank the aircraft and pull back too much on the stick ('bank and yank' — perhaps also without adding power) so you or the passenger can get a good view of something on the surface directly below. Extracts from three RA-Aus fatal accident reports: 1. " The pilot was conducting the flight for the passenger to take photographs of the property. Witnesses saw the Drifter fly over the farm buildings at an estimated 300 feet agl and then turn and fly back. The aircraft was seen to do a steep left turn during which the nose lifted. The aircraft entered an incipient spin from which there was insufficient height to recover." 2."The Sapphire was seen to be flying straight and level at about 150 feet agl. The aircraft entered a tight right hand turn, the nose was seen to drop and it appears the aircraft entered an incipient spin subsequently striking the ground in a nose-down attitude." 3."The pilot and his friend intended to do a short photographic flight ... for airport publicity purposes ... the passenger side door of the Skyfox had been removed to allow an unimpeded view for the photographer. No-one witnessed the accident however one pilot ... backtracking the same runway saw the aircraft take-off and start a normal climb but did not see the aircraft from that point as he continued to backtrack. It was only after line-up that he saw the smoke from the crash site. The impact site was 200 metres to the left of the upwind threshold and 900 metres from the start of take-off ... the wings hit almost simultaneously with the aircraft in a near vertical attitude, then bouncing 1.5 metres and coming to rest with the tail against a small tree, 60° nose down, right side up ... facing away from the take-off point ... indicates that the aircraft ... had turned back towards the runway, stalled and spun in with 180° rotation." 6.3.4 Popular precursors to a stall/spin: use rudder to hasten the turn or hold-off bank in a descending turn The precursors to a stall/spin event in a low-power descending turn are the same as those for such an event in a level turn: if an excess of bottom rudder is applied the aircraft will be skidding and, unless some other factor is dominant, whenever an aircraft is slipping or skidding in a turn the wing on the side to which the rudder is deflected will usually stall before the other, with a consequent instantaneous roll in that direction. At descent speeds the aircraft is usually flying at a higher CL, and thus higher aoa, than when on the downwind leg for example. So a reduction in available aoa margin exists before allowing for the additional aoa required for the turn. The descending turn from base leg onto the final approach to landing is the most obvious place for a pilot to attempt to hurry a turn with rudder, because of the need to align with the runway. A tailwind component on base leg to a crosswind landing will increase the tendency to hurry the turn with rudder as may other crosswind situations. If skidding, the excess bottom rudder is yawing the nose down, the rotation about the normal axis reduces lift from the inner wing and increases lift from the outer wing and the tendency is to use elevator to keep the nose up — which is going to bring aoa towards critical. Also because of illusory ground reference cues, there may be a tendency to increase the rate of turn by applying additional bottom rudder whilst maintaining the bank angle with opposite aileron — "holding-off bank". You should never hold-off bank in a descending turn (but see 'Note 2: holding-off bank'). If control column back-pressure is purposely or inadvertently applied the aircraft may enter a cross-controlled stall where it is going to roll further into the bank and enter an incipient spin. In some aircraft it is quite possible that the pilot doesn't recognise that initial roll as an incipient or partial stall and allows it to continue, accepting it as part of the planned turn. The pilot will realise when he/she finds that applying corrective aileron increases the roll rather than reducing the bank. In similar situations there have been cases where the pilot has no doubt wondered why the elevators are completely ineffective when the control column is pulled right back to get the nose up. Apart from the turn from base to final, such stalls might occur on final when avoiding bird strike or attempting a late correction to an out-of-line crosswind approach, or any time when you try to hurry a turn with bottom rudder. Stalls on the final approach, caused by failing to increase power when raising the nose to stretch the approach or reduce a high sink rate, will be exacerbated if the aircraft is also slipping. Possibly the most deadly low-level descending turn is the turn-back following engine failure after take-off. Here is an extract from an RA-Aus serious injury incident report: "The 8000 hour instructor (and student) had just returned from a flight and were over the top of the airfield when he thought the engine hesitated but then continued running. Considerable sink was experienced ... The instructor used rudder to yaw the aircraft toward the short runway then used rudder again to yaw the aircraft more to the right so that a landing could be made on the longest runway. The aircraft stalled and contacted the ground right wing first." If flying cross-controlled when banked with an excess of top rudder — as in the sideslip manoeuvre or a slipping rather than skidding turn — then if it stalls the roll will probably be in the direction of the upper wing; i.e. towards an upright position, which is not quite so alarming and perhaps provides a little more time to react. The following is an extract from an RA-Aus fatal accident investigation. A motor glider was returning to its home airfield after being airborne for about one hour 40 minutes; morning flying conditions were good with a five knot south-easterly. The accident occurred within a ground area considered quite safe for forced landings. The engine, propeller and pylon had been retracted and stowed within the fuselage; in such configuration the motor glider behaves as a pure glider and achieves its best glide ratio of 33:1 at 46 knots and minimum sink rate of 150 ft/min at 40 knots. "The aircraft approached the airport from the west at approximately 400 feet agl, overflew the runway and continued straight ahead. It conducted a left hand turn back towards the runway before entering a stalled state and spiralling one and a half turns into the ground ... approximately 600 metres west of the western airport boundary and 400 metres north of the northern boundary ... it is the opinion of RA-Aus that the accident was attributed to pilot error and lack of situational awareness." Note 2 — holding-off bank. Sailplane pilots probably spend more than 50% of flight time conducting small diameter circling turns within a lift source such as a thermal. The airspeed used to minimise diameter may only be 5–10% greater than the turning stall speed and under these conditions the outer wing tip will be flying at a significantly greater airspeed than the inner wing tip; for a 22-metre wing-span sailplane flying at 44 knots CAS in a 100-metre radius turn, the outer wingtip could be flying at 48 knots while the inner maintains 40 knots. Thus such aircraft develop more lift from the outer wing than from the inner even though the inner wing will have a higher aoa in the gliding turn, so there may be a need for sailplanes to hold-off bank. 6.3.5 What about loss of control in low-level climbing turns? As we saw above, the increased lift force in the turn is provided by an increase in aoa. Now what will happen if you are climbing at Vx (the speed for maximum climb angle) using maximum power and decide — because of rising terrain or other obstruction (the latter particularly occurring in a delayed or misaligned go-around), an approaching aircraft or just natural exuberance — to make a quick 30° left turn using a 45° bank angle, while still maintaining the climb? Coordinated climbing turn: if not keeping a close eye on the ASI and the airspeed has decayed just a little, the general aoa at Vx could be around 12°. To initiate a 45° bank turn, wing loading and thus aoa must increase by 41% which will take the aoa to 17°; i.e. past the critical stall aoa of 15° or 16°. Such full-power stalls in a coordinated climbing turn tend to result in the outer wing stalling first — because in a climbing turn the outer wing has a slightly higher aoa than the inner — with a fairly fast outer wing and nose drop. The roll towards the outside of the turn would initially level the wings but the increasing aoa of the down-going wing continues to accelerate the lift loss and increases the drag on that wing — a particularly rapid action if the propeller torque effect is such that it also reinforces the roll away from the original direction of turn. P-factor may also cause the aircraft to yaw when flying with high power at high angles of attack. Such stalls are likely to result in a stall/spin event if corrective action is not taken as soon as the initial loss of lateral stability — the uncommanded roll, or just a wing rocking warning — is apparent. Cross-controlled climbing turn: if the turn is skidding (excessive bottom rudder applied) then the lower wing may stall first with the consequent roll into the turn — because only one wing is stalled — possibly being sufficiently pronounced to flick the aircraft onto its back. The propeller slipstream from a tractor engine will also be slightly asymmetric supplying more dynamic pressure and thus lift to one wing while reducing the effective aoa. We will discuss cross-controlled climbing turns further when we look at illusory ground reference cues. Climbing at Vx, the best angle of climb speed, should always be regarded as a very short-term emergency procedure. Even a 30° banked climbing turn at Vx might produce an aoa of 14°, very close to the stall aoa and providing no margin for even minor turbulence, slight mishandling or inattention. Of course climb performance will be degraded unless extra power is available, which is unlikely because full power is normally used for the climb until a safe height is reached. The aoa margin that you should always have in hand to cope with such likely events is 3° or 4°, which indicates that, when climbing at Vx, turns should not be contemplated. When climbing at Vy — the best rate of climb airspeed with aoa around 8° — then until a safe height has been gained turns should be limited to rate 1 (3° in azimuth per second or 180° per minute requiring perhaps 15° bank) to ensure an additional margin if wind/gust shear is encountered in the climb-out. When entering a turn during a full-power climb the aircraft must slow, because of the increased induced drag at the higher aoa required to make the turn with no excess power available to counter it. Consequently the aircraft's pitch attitude in the turn must be reduced sufficiently to maintain safe airspeed. Here is an extract from an RA-Aus serious injury incident report: Weather conditions: wind calm, nil turbulence, 23° C. Witness report: "The Gemini took off from the 950 metre runway, and after initially climbing, appeared to slow with a nose high attitude approaching trees. The aircraft was then seen to bank to the left then rotated 180° whilst rapidly losing height before impacting the ground at an approximate 45° angle 100 metres from the runway ... the motor sounded to be operating normally". Elevator trim stall Most light aircraft are not particularly longitudinally stable at approach speeds. At each stage of the landing approach, a flap-equipped aircraft should be properly re-trimmed to maintain the desired airspeed at the current cg position and selected flap configuration and the elevator trim tabs exert quite a large control force at flight speeds. With full flap deflection on the approach some aircraft may need quite an amount of nose-up trim; under these conditions applying full power following a go-around decision may induce a very strong nose-up movement — exacerbated by the elevator trim setting — and this attitude change must be anticipated by the pilot. If the pilot is slow in applying forward stick pressure and adjusting the elevator trim, the pitch-up may result in a highly dangerous 'elevator trim' stall and particularly so if the aircraft is also turning while low in energy. In addition, a 'heavy' aircraft with an aft cg may require considerable forward stick pressure. And, of course, the pilot must make allowance for the normal go-around conditions such as engine torque effects and density altitude. 6.3.6 When a stall with wing drop is recognised, what's the best way to recover? One standard recovery procedure is generally applicable to all stall events or attitude upsets in a three-axis aircraft, whether or not overbanked and/or overpitched — i.e. nose high/low — though this recovery procedure is not applicable to a fully developed spin, whether erect or inverted. Stall recovery generally requires the following concomitant stages: Ease stick back-pressure to reduce aoa of the most stalled wing below critical — which immediately gets the aircraft flying and restores normal 3-axis control. For any aircraft type, the amount of elevator deflection required to unstall the most stalled wing depends on many variables and may range from just an easing of back-pressure to a firm but smooth push towards the neutral position. All aircraft have their own handling idiosyncrasies and pilots must be aware of them. The nose should be positioned sufficiently below the horizontal to achieve safe flying speed while still well clear of the terrain. It's a matter of balancing height loss and proximity to terrain against a quick return to a safe flight speed. If the forward stick movement is both excessive and abrupt, the result could be an aoa movement below the zero-lift aoa, in which case there will be a reversed lift force on the wings that hinders recovery. This may be particularly apparent with trikes. The negative g due to the bunt could adversely affect some engines at a critical time. In instances of extreme overbanking (past 60° or inverted) — where although the upset may be the result of a cross-controlled stall or perhaps wake turbulence — the inverted or near-inverted wing will not be stalled but the aircraft will be in an inverted descent. The forward control column movement is needed to reduce the angle of descent. However, there may be the possibility of an inverted stall if the control column is pushed into its extreme forward position. Warning: never pull BACK on the control column as the initial response to a perceived stall or an overbanked nose-low attitude. Halt downward wing movement with rudder or centre the slip ball. Increase power smoothly, possibly up to maximum. The slipstream will also increase rudder and elevator authority, and aircraft stability, through its effect on fin and horizontal stabiliser; though if the aircraft is near the wings-vertical position — or is inverted — the throttle must be closed. In the recovery from a stall in a climbing turn, full power should be maintained unless the nose is pitched too far down. Roll the wings level with aileron so that all the lift force will be directed away from the ground. If inverted, choose the roll direction that provides quicker return to a wings-level attitude and, of course, the right way up. Following the preceding actions: adjust power as necessary; if flaps were fully lowered then adjust by stages to take-off position; hold attitude until speed has built up to Vy (perhaps Vx if there are terrain problems); then ease into a climb to a safe altitude, where you can assess what went wrong. Never attempt to continue a landing approach after such an event; go around, allowing plenty of time to assess the environment before re-approaching. If the aircraft is properly balanced (i.e. cg is within the limits for that all-up weight), any cross-controlled stall condition is readily countered. Of course if the pilot doesn't wait for the airspeed to build to a safe speed before again applying control column back-pressure, there will be a high risk of a secondary stall which may be very hazardous, depending on the height loss from the first stall. 6.3.7 What are these illusory ground reference cues? It is thought that some ground reference optical illusions may be a contributing factor in loss of control situations near the ground. Such illusions can cause no problem in the circuit if the pilot confines external scanning to the intended flight path and checks for conflicting aerial traffic, while maintaining the appropriate instrument scan and a minimum safe flying speed. The latter is 1.5 times Vs, or perhaps as low as 1.3 times Vs in the latter part of a stabilised final approach as long as 20° bank angle is never exceeded. Fixing the circuit pattern on particular ground reference points, rather than the landing strip (for example "turn downwind around the big tree"), may contribute to illusory ground reference cues. Wind drift illusions When wind speed is reasonably high relative to aircraft speed, then the aircraft's drift with reference to the ground is very apparent to the pilot operating at lower levels, and particularly at short, difficult airstrips. The diagram above represents the ground track of an aircraft conducting a level 720° coordinated turn with constant speed and constant bank angle, such that in the second 360° turn, the aircraft would be encountering its own wake from the first 360° turn — assuming that the wake didn't sink below the flight path. The movement of the air mass in which the aircraft is borne is toward the west (with an easterly wind) and the turn is clockwise when viewed from above. When in the region above the red line, ground speeds will be lower; when below the red line, ground speeds will be higher. The separation of the tracks for each 360° is exaggerated for clarity. When entering the south-west quadrant of the first 360°, the ground speed is initially high but reducing. The drift away from a central ground reference would provide the illusion of skidding out of the turn. Passing through the north-west quadrant, the skidding illusion will disappear as ground speed reaches the minimum. Ground speed starts to increase slightly through the north-east quadrant. However, the increasing drift towards the reference point provides a very noticeable illusion of a slip into the turn. This reaches a maximum as the aircraft enters the south-east quadrant, where it abates as ground speed increases to the maximum. So, in a 360° coordinated level with constant speed and constant bank, the aircraft (and its wake) drifts downwind relative to the ground at the wind speed rate. The cockpit instruments will of course show a constant airspeed, bank angle and a centred slip ball. However, the reference cues seen by a pilot looking at the ground during a low-level turn indicate increasing and decreasing airspeeds, alternating with decreasing and increasing slip into the turn. The downwind turn illusion An unaware pilot may get into a difficult situation in the low-level circuit when an aircraft is turning 90° from crosswind to downwind (as in the progress through the SE quadrant of the diagram above), when drift cues create an illusion of slipping into the turn. At the same time, the increasing ground speed might suggest increasing airspeed. The reaction of an unwary pilot is to increase bottom rudder pressure. This will increase the bank angle and lower the nose. The pilot's reaction may well be to apply opposite aileron to reduce the bank, while increasing control column back-pressure to bring the nose up and possibly reducing power to reduce airspeed. Thus the aircraft is cross-controlled and flying at an aoa with little margin in reserve. This is coupled with decreasing airspeed, reducing lift and the aircraft sinking with a consequent increase in effective aoa. Under such circumstances, there is a likelihood of the aircraft stalling and snapping over. The downwind turn illusion seems to have more potential for error if the aircraft is climbing in a downwind turn, as described previously. Note: sometimes you may read material which purports that an aircraft loses airspeed and might stall when turning from crosswind to downwind because the aircraft is changing direction relative to the wind direction, which of course is nonsense. However, airspeed must decrease in the turn if power is not increased to counter the extra induced drag. Although an aircraft can only stall if the critical angle of attack is reached, a combination of aircraft inertia and a wind shear or turbulence event encountered in the turn could result in a stall (particularly if it is still climbing) or, more likely, a loss of height. If turning very close to the ground to follow a particular ground path (close to trees when stock mustering, for example) the increasing drift into the turn must be allowed for. Pivotal height and reversal height Pivotal height or pivotal altitude is a term used by proponents of ground reference manoeuvres such as 'eights on pylons'. It is one particular height above ground at which, from the pilot's sight line, the extended lateral axis of an aircraft doing a 360° level turn (in nil wind conditions) would appear to be fixed to one ground point, and the aircraft's wingtip thus pivoting on that point. Imagine an inverted cone with its apex sitting on the ground reference point and an aircraft flying around the periphery of its inverted base while maintaining a constant airspeed. The vertical distance from the reference point to the centre point of the inverted base is the pivotal height, and the distance from the edge to that centre point is the turn radius. The bank angle is formed between the outer wall of the cone and the radius line. The pivotal height in nil wind conditions is readily calculated by squaring the TAS in knots and dividing by 11.3. So any aircraft circling at a speed of 80 knots would have a pivotal height (80 × 80 / 11.3) around 550 feet, no matter what the bank angle. In other than still air conditions the pivotal height varies with the ground speed. If the wind was northerly and the aircraft was turning anticlockwise (viewed from above), then ground speed would be lower on the eastern side of the turn and higher on the western side. When in the northern quadrant the aircraft would be drifting towards the centre point, while in the southern quadrant it would drift away. Drift would not be noticeable in the eastern and western quadrants but changed ground speeds would. At 70 knots ground speed, the pivotal height is reduced to 450 feet, at 90 knots it is about 750 feet. (Thus an exercise requiring a continuous 360° balanced turn at constant speed around a ground reference point, whilst holding pivotal height, involves continually changing the height above ground so that the line of pivot around each point is held constantly — rather than maintaining a constant distance from the 'pylon'. The bank angle must also be changed constantly as the wind drifts the aircraft towards or away from the pivot point. It is not an easy exercise to do well, and requires an ability to manoeuvre accurately whilst including the ground reference point in the normal scan pattern. Usually two ground reference points, about five seconds apart, are included for a figure eight pattern — otherwise known as 'eights on pylons'.) Now imagine two cones — the upper one is the inverted cone with the aircraft flying around the edge of its inverted base and below that is a second cone with its base on the ground and its apex connecting with the apex of the upper cone. The vertical distance from the ground through the cone intersection to the centre point of the inverted base is the aircraft height. So when an aircraft is turning at pivotal height in nil wind conditions, the wingtip appears to be fixed to a single point in the landscape. But when at any height other than the pivotal height, the wing tip will appear to move across the landscape. When an aircraft is turning at a height greater than the pivotal height, which is the normal situation in flight, the wingtip appears to move backwards over the landscape — path A in the diagram. However, when an aircraft is turning at a height less than the pivotal height (thus close to the ground), the wingtip appears to move forward over the landscape — path B in the diagram. Thus, when a turning and descending aircraft descends below pivotal height there is an apparent reversal of the wingtip movement from backward to forward, which is the reason why pivotal height is sometimes termed reversal height. There is some thought that the reversal illusion may cause problems to unaware pilots during the final turn on approach to landing, because the turn may well pass through reversal height — at 50 knots ground speed, the reversal height is about 200 feet, at 60 knots it is about 300 feet and at 70 knots it is about 450 feet. If the aircraft is in a banked turn below reversal height, and if the pilot looks down over the wingtip, she/he may get the impression that the aircraft is not turning and may then add additional bottom rudder so that the wingtip then appears to move backwards in the turn — the normal movement. This will cause a yaw and the aircraft's nose will move down, the aircraft may then appear to be nose-low and the pilot's reaction is to increase back-pressure on the control column. Low speed, excessive bottom rudder and an increasing control column back-pressure are the prerequisites for the aircraft to stall and roll toward the lower wing — an entry to incipient spin. All pilots should be aware of this illusion and that wind drift will exacerbate it — the base to final approach turn is probably the most important ground reference manoeuvre that recreational pilots regularly perform. 6.3.8 So how can low-level stall/spin events be avoided? The rules to avoid low-level stall/spin situations are: Always expect the unexpected. (A rather trite statement but, hopefully, it conveys the message.) Good energy management: if potential energy of height is very low then kinetic energy should be reasonably high; i.e. maintain a safe speed (1.5 × Vs1) near the ground. Avoid distraction: maintain a scan appropriate to the situation. Never concentrate on one task, or a ground object/surface scenery, or a search for another aircraft thought to be in the circuit. Envisage the wing aoa while manoeuvring, keep the wing flying and don't exceed 30° bank angle. A good pilot is able to feel the onset of a stall — before any wing-drop — and catch it with just a slight forward stick input. Fly accurately. Keep the slip ball centred and never apply an excess of rudder in an attempt to tighten any turn or change direction. Never turn while still climbing at Vx. Restrict climbing turns at Vy to less than 15° bank angle. STRICT COPYRIGHT JOHN BRANDON AND RECREATIONAL FLYING (.com)
 -
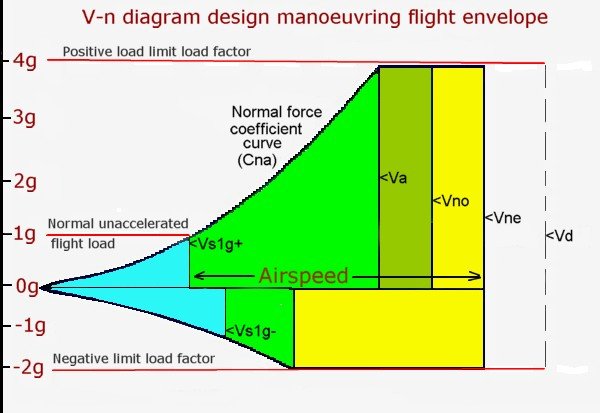 6.2.1 How fast is too fast? The term 'very high speed' is entirely relative. In an aluminium tube and fabric aircraft it might be 70 knots; in an aircraft that cruises at 100 knots, excessive speed in non-turbulent atmospheric conditions may be less than 130 knots. The airspeed that constitutes 'too fast' can change depending on the load carried and how it is distributed There are limits to the payload an aircraft may carry safely and load must be distributed so that the aircraft's balance — the position of the aircraft's centre of gravity — is contained within defined limits. In addition there is a maximum safe operating weight permitted by the aircraft designer for all flight conditions. So, before you load a 90 kg passenger and 30 kg of gear into your light sport aircraft with full tanks, check the weight and balance charts in your Pilot's Operating Handbook or aircraft flight manual. Weight and balance affect control and stability at all speeds. Excess weight reduces the designed structural load limit factors. Cg positions outside the designated fore-and-aft limits may enhance elasticity reactions to aerodynamic loads, or reduce controllability because of moment arm changes, or delay (even prevent) recovery from unusual and/or high-speed situations. How are airspeed limits, especially Vne, determined? For type certificated aeroplanes FAR Part 23 section 23.335 requires Vd — the 'design diving speed' — to be not less than 1.4 times the design cruise speed for a normal category aircraft. To receive type certification, it must be demonstrated, possibly by analytical methods, that at Vd, the propeller, engine, engine mount, and airframe will be free from over-speeding, severe vibration, buffeting, control reversal and most importantly flutter and divergence. To provide some safety margin, Vne (the IAS that should never be exceeded in level flight, descent or manoeuvre) is set at 90% of the lower of Vd or Vdf. Vdf is a diving speed that has been worked up to by a test pilot and demonstrated to be without problem — though without pulling heavy airframe loads — and which must be lower than or equal to Vd. Vd is not required to be demonstrated in an in-flight test. Vne is always specified in the pilot's documentation as an indicated airspeed and should be marked on the ASI (the red line) but unlike the performance airspeeds (also specified as indicated airspeeds and perhaps marked on the ASI), Vne is related to those structural characteristics and limitations associated with bending, twisting and elasticity, and which affect stability, control and even structural integrity. Limiting speeds are also associated with structural reaction to pilot-induced loads and to gust-induced loads. Limiting speeds could also be associated with other potential problems; for example, suction effects at particular speeds and attitudes might lead to canopy departure, or door or cowling security problems , but normally Vne is limited by the critical flutter speed. Does the indicated speed for Vne stay the same no matter how high you fly? The answer is generally affirmative because the airspeed indicated (Vis) is a reflection of one particular dynamic pressure (½roVis²) no matter what the aircraft's altitude might be. But there is a qualification in that one of the conditions that limits maximum safe airspeed is the onset of flutter, which is a function of the speed of the airflow, the elasticity of the airframe, the balance of the control surfaces and the condition of the flight control actuating systems, rather than just the dynamic pressure. See 'Aerodynamic reactions to flight at excessive speed' but also read 'You can also induce structural damage at moderate speeds!' For most sport and recreational aviation light aeroplanes only one Vne is specified in the Pilot's Operating Handbook or aircraft flight manual. That value is possibly conservative and applicable for operations below 10 000 feet amsl. The designers of most piston-engined GA aircraft specify one fixed-value Vne for operations up to the aircraft's service ceiling; that value is represented by the fixed red line on the ASI. (Note that some EFIS displays may be able to continually adjust the redline display so that it reflects the IAS proportional to a Vne expressed as a true airspeed.) The flight testing program would have determined that the aircraft has no potential flutter problems at Vdf up to the service ceiling. However, some GA aircraft have supplementary lower-value IAS Vne for operations in altitude bands above a stated altitude — perhaps above 10 000 or 15 000 feet. This approach to Vne specification is normal with sailplanes and powered sailplanes whose long, elastic, high aspect ratio wings are likely to develop flutter problems at high true airspeeds, also long wings vibrate less rapidly than short wings, i.e. have lower natural frequencies. Random inflight airflow perturbations may cause wings to bend upward and downward i.e. flap, the degree of oscillation or flapping is more pronounced with high aspect ratio wings. While bending upward the wing adds a vertical velocity* to its forward velocity — the true airspeed — which results in a decreasing angle of attack reducing the lift of the up-moving wing and thus producing an aerodynamic damping of the flapping motion. Similarly the downward flapping motion results in an increasing angle of attack, increasing the lift of the down-moving wing and again producing an aerodynamic damping of the flapping oscillation. *A somewhat similar resultant velocity calculation to a vertical gust encounter. As true airspeed increases the vertical component of a flapping wing's velocity becomes increasingly less significant, so the aerodynamic damping of the flapping oscillation lessens as the aircraft's TAS increases; consequently increasing TAS will increase flutter potential. Where the aircraft designer selects a true air speed value as a limiting airspeed applicable when flying above a nominated altitude, FAR Part 23.1545 (c) requires that "If Vne varies with altitude, there must be means to indicate to the pilot the appropriate limitations throughout the operating altitude range". The 'means' is normally a placard next to the ASI. So, in such circumstances, designers must specify a series of Vne IAS values, corresponding with all possible operating altitude bands. For example, the RA-Aus registered Pipistrel Sinus has the altitude capability of 28 500 feet and can build speed rapidly even in a shallow descent. The Pipistrel designers have deemed it wise to limit maximum speed to a particular TAS at all altitudes. The following table reflects the Sinus flight manual and the ASI placard; the maximum true airspeed target is 122 knots. Note that density altitude rather than altimeter-indicated altitude, is specified — which is significant in Australian climatic conditions. Density altitude/IAS for nominal Vne 122 knots IAS/CAS Density altitude Vne knots IAS 0 122 3300 116 6500 111 10 000 105 13 000 100 16 500 95 19 700 90 23 000 85 26 300 80 If there is insufficient manufacturer's information available for the aircraft you fly — and you are uncertain about the appropriate Vne for an operating altitude — then multiply the density altitude, in thousands of feet, by a factor of 1.5 to get the percentage decrease to apply to the specified Vne to establish a safe Vne appropriate to the altitude. For example if density altitude is 8000 feet and specified Vne is 100 knots then 8[000] × 1.5 = 12%. Corrected Vne = 88% of 100 = 88 knots IAS/CAS. 6.2.2 I like flying my aircraft fast. If I stay below Vne, I won't have to worry about structural failure, right? Vne is assessed at or near MTOW, with the cg at, or within, the fore and aft limits for the aircraft's specified category; it does not apply if weight, manoeuvring loads or cg positions are outside the specified limits. As a maximum airspeed it applies only in reasonably smooth atmospheric conditions for moderate, smoothly applied control movements and symmetrical aerodynamic loads. Even gusts associated with mild turbulence or sudden control surface movements greater than perhaps several degrees travel might lead to some unpleasant surprises, if operating close to but below Vne. Remember that dynamic pressure increases with the square of the true airspeed. At high speed the controls should be quite stiff and are very effective, with a probability of over-control applying extreme loads to the structures. Asymmetrical aerodynamic loads, such as combined rolling and pitching, reduce the maximum allowable airframe load by perhaps 30%. Take care because some aircraft control systems provide inadequate feedback of the load being exerted; i.e. a high load can be applied at high speed with a relatively low stick force, see 'The stick force gradient'. (The effect of gust loads is expanded in the section on wind shear and turbulence.) If an aircraft is operated within its specified manoeuvring and gust envelopes and weight and balance limits — observing the limiting accelerations and control movements, and maintaining airspeeds commensurate with atmospheric conditions — then the only possibilities of inflight control or structural failure relate to: improper modification or repair of the structure control actuating system deficiencies cumulative strain in ageing aircraft, eroding the designed safety margin, remembering that structural fatigue may not have been adequately assessed at the aircraft's design stage failure to comply with the requirements of airworthiness notices and directives poor care and maintenance of the airframe. Flight at airspeeds outside the design manoeuvring flight envelope (or when applying inappropriate control loads in a high-speed descent or, indeed, at any time) is high risk and can lead to airframe failure. Be aware: deliberately exceeding Vne is the realm of the test pilot — who always wears a parachute! The following text is an extract from an RA-Aus accident investigation report illustrating aileron flutter and wing divergence: "(Witnesses) observed the aircraft in a steep dive at what appeared to be full power. The port wing appeared to detach from the aircraft … That wing had the attach points intact but had pulled the mountings out of the top of the cockpit. This action would have released the door, which landed close to the wing. The wings were intact but the ailerons were detached. There was no delamination of the fibreglass structure. The ailerons were not mass-balanced. The aircraft was a conventional design being a high-wing, monoplane of composite construction. While the fuselage was a proven design the pilot/builder had designed his own wing, including the aerofoil section. The workmanship was excellent and there is no evidence of any lack of structural integrity. The eyewitnesses reported seeing "a sort of shimmying" from the aircraft. It is believed that this 'shimmying' was aileron flutter, which led to the detaching of both ailerons. This same flutter condition would account for the massive forces required to detach the wing from the aircraft in the manner that occurred. Flutter could have been triggered by the wing aerofoil design combined with the manoeuvre the pilot was conducting, or from the aileron control design … The aircraft suffered a massive inflight structural failure almost certainly caused by severe aileron flutter and the aircraft speed in the dive. Any flutter would have been exacerbated by the lack of mass balancing." 6.2.3 How strong are the aeroplanes we fly? Design regulations Aircraft structures, engineered by aeronautical professionals, are designed for adequate strength and stiffness while being as lightweight as possible. To receive type certification the design of an aircraft must conform with certain standards, including the in-flight manoeuvring loads plus the turbulence or gust-induced loads that the structure must be able to sustain for the category in which the aircraft may be operated. Even if not seeking certification the designer would still conform to the standards, but this may not apply to those aircraft not designed/engineered by professionals. Even design by professionals may not provide a guarantee that the aircraft is safe. Read this United States Federal Aviation Administration special review team report [pdf format] which identified issues with a LSA category aircraft's wing structure, flutter characteristics, stick force gradients, airspeed indicator calibration, and operating limitations. FAR Part 23 is a recognised world standard for light aircraft certification and the following is an extract: "... limit loads [are] the maximum loads to be expected in service [i.e. the highest load expected in normal operations] and ultimate loads [are] limit loads multiplied by [a safety factor of 1.5]. [FAR Sec. 23.301] … The structure must be able to support limit loads without detrimental, permanent deformation. At any load up to limit loads, the deformation may not interfere with safe operation. … The structure must be able to support ultimate loads without failure for at least three seconds …" [FAR Sec. 23.305] In FAR Part 23 the minimum limit load factors that an aircraft must be designed to withstand at maximum take-off weight are: +3.8g to −1.5g (or −1.9g*) for the normal operational category (which would include most factory-built recreational aircraft); +4.4g to −1.8g (or −2.2g*) for the utility category (which includes most GA, and perhaps some RA, training aircraft); and +6.0g to −3.0g for the acrobatic (i.e. aerobatic) category; for light sport aircraft [LSA] the ASTM International standard is +4.0g to −2.0g; sailplanes and powered sailplanes are generally certificated in the utility or acrobatic categories of the European Joint Airworthiness Requirements JAR-22, which is the world standard for sailplanes; aerobatic sailplanes have limit loads of +7g and -5g. *The increased negative g limit load factors for normal and utility category are required if the designer made use of FAR 23 appendix A allowing simplified design load criteria for single-engine aeroplanes less than 2700 kg weight. There is an increasing risk of structural failure when exceeding the limit load factors, and each instance of excessive loading will accumulate airframe strain and add to the failure risk. See 'Metal fatigue in airframes'. We use load factors in terms of both g and total wing loading.There is an amplification of this relating to gust-induced loads, rather than manoeuvring loads, in the article 'Wind shear and turbulence'. Remember that aerodynamic forces increase with the square of the airspeed; i.e. dynamic pressure = ½roVis². An increase in IAS from 125 knots to 150 knots represents a 44% increase in dynamic pressure. Notes: 1. Uncertificated minimum recreational light aircraft, even with their low wing loading, can readily be overstressed just by flying straight and level at maximum speed and increasing load in a pull-up (positive g) or a full push-over (negative g). 2. Many GA aircraft are type certificated in both normal and utility category, and some are certificated in those plus the acrobatic category. In such cases the MTOW, cg limits and limit load factors are not fixed values but vary according to the intended flight operating category. Airframe elasticity All aircraft structures exhibit some degree of elasticity. That is, they deflect a little, changing shape — flexing, bending and/or twisting — under applied aerodynamic loads. Those short-lasting structural distortions also contribute to a change in the aerodynamic forces, so the distortions and forces are mutually dependent. This is particularly so with the wings, tailplane and control surfaces. However, structures usually spring back to the normal position when the load is removed. Aeroelasticity may lead to some problems at high speed, but reducing elasticity means increasing rigidity, which perhaps involves an unwarranted increase in structural weight. So, aircraft structural engineering must be a compromise between rigidity and elasticity. See the notes on 'stress and strain' in the 'Builders guide to safe aircraft materials'. Aircraft design manoeuvring flight envelope The V-n (or V-g) diagram below is a typical representation of a few aspects of a three-axis aircraft's flight envelope. It displays the aerodynamic load factor on the vertical axis — in terms of g acceleration units — between the certificated limit loads for a LSA category aircraft of +4g to −2g, and airspeed would normally be displayed along horizontal axis. The load is that which parallels the aircraft's 'normal' axis (hence V-n); i.e. the load at right angles to both the longitudinal and lateral axes in erect or inverted flight. The structural load limits shown are for symmetrical airframe loading only. They don't apply if a manoeuvring load is asymmetrical; for example, rolling or yawing, while pulling back on the control column, can place excessive loads on parts of the airframe. Asymmetrical loadings might reduce the acceptable limit load by 30%. The 'clean' (i.e. flaps/spoilers stowed) three-axis aircraft can be flown within the speed and load limits of the light green region at any time. It is only possible to manoeuvre a light aircraft in the reduced-g band between +1g and –1g (light blue) for seconds rather than minutes. Controlled flight at speeds less than the Vs1g stall speed may be accomplished with any manoeuvre that 'unloads' the wings; for example, 'push-overs', which reduce apparent weight (make you feel light in the seat). Aerobatic aircraft can be pulled into a full-power vertical climb where the aoa is held close to the zero lift (zero load) aoa until the airspeed drops close to or below Vs1, then rudder and the slipstream energy is used to cartwheel the aircraft through a 180° hammerhead turn into a vertical descent. And of course an aerobatic aircraft would be able to sustain 1g negative (i.e. inverted) flight for a period. The aircraft will stall if flight is attempted outside those aerodynamic load/speed limits defined by the curved lines. It can be operated above the Va manoeuvring speed without limits on smooth control use, and within the olive-green area in light to moderate turbulence, but it should not be operated above Vno (in the yellow area) except in a reasonably smooth atmosphere. If operating in the region outside the structural load limits, or at velocities greater than Vne/Vd, structural distortion then failure may result. All the foregoing is only applicable to a totally airworthy aircraft. If the airframe is not always properly maintained then the design manoeuvring flight envelope is not applicable; nor is it applicable if aerobatics are performed in an aircraft that is not certified for aerobatics. The following are extracts from a report concerning certain engineering aspects of a fatal accident involving a Skyfox CA22. The aircraft had taken off from an airfield some 20 km from the accident site. The aircraft was seen to break-up in flight while overflying the pilot's house. The port aileron (or a portion of it) and the port wing were seen to detach from the aircraft and descend separately and relatively slowly. The fuselage with the starboard wing attached struck stony ground at high speed. Conclusions: "The most probable primary cause of failure was exceedance of the aircraft's structural design envelope, primarily in regard to speed in conjunction with negative load factor due to a gust, leading to compression failure of the forward strut. Aileron flutter, due to an out-of-balance condition, may have been a factor. It seems probable that the aircraft was flying close to, or above, its Vne of 93 knots. The permissable flight envelope is very small, and would not be at all difficult to exceed inadvertently, especially in a shallow descent." Also, read the Coroner's findings in regard to a double fatality following the inflight structural failure of a Drifter aircraft. 6.2.4 Perilous aerodynamic reactions to excessive speed: flutter and other booby traps We all like to experience the sensation of rapidly gaining speed in a dive, however, the pilot must watch the ASI throughout; airspeed builds very rapidly and dive recovery must be initiated well before Vne is reached. Flutter Wing structures are akin to a very-low-frequency tuning fork extending from the fuselage. When a tuning fork is tapped, the fork vibrates at a particular frequency; the stiffer the structure, the higher its natural frequency. The natural frequency of a wing or tailplane structure may apply another limiting airspeed to flight operations related to a self-exciting interaction between elastic, aerodynamic and inertia forces that result in 'flutter' of control surfaces and the structure to which the surface is attached. For example, when the airflow around a wing, tailplane or control surface is disturbed (by aerodynamic reactions, turbulence or pilot inputs) the structure's elastic reactions – twisting and bending – may combine as an oscillation or vibration of the structure that will quickly damp itself out at normal cruise speeds because of the structure's resistance. It is possible that the oscillation does not damp out but is sustained at a constant amplitude (perhaps felt in the airframe as a low-frequency buzz) that is not, in itself, dangerous but may contribute to structural fatigue. At some higher airspeed — the critical flutter speed, where the oscillations are in phase with the natural frequency of the structure — the oscillations will not damp out but will become resonant, rapidly increasing in amplitude. (Pushing a child on a swing is an example of phase relationships and amplification.) This flutter condition is very dangerous, and unless airspeed is very quickly reduced, the increasing aerodynamic forces will cause control surface (or even wing) separation within a very few seconds. For more information on flutter see 'Aerodynamic reactions to flight at excessive speed'. Twisting the wings off! Wing divergence refers to a state where, at the very low angles of attack at high speed where the nose-down pitching moment is already very high, pressure centres develop pushing the front portion of the wing downward and the rear portion upward. This aerodynamic twisting action on the wing structure — while the rest of the aircraft is following a flight path — further decreases the aoa and compounds the problem; finally exceeding the capability of the wing/strut structure to resist the torsional stress and causing the wing to separate from the airframe — with no warning! This could be brought about if turbulence is encountered at high speed. High-speed control reversal: will it always roll in the direction you want? As airspeed increases, control surfaces become increasingly more effective, reaching a limiting airspeed where the aerodynamic force generated by the ailerons, for instance, is sufficient to twist the wing itself. At best this results in control nullification; at worst it results in control reversal. For example if the pilot initiates a roll to the left the downgoing right aileron might twist the right wing, reducing its aoa, resulting in loss of lift and a roll to the right, probably with asymmetric structural loads: all of which would make life difficult when attempting to roll the wings level during the recovery from a high-speed dive. This could be exacerbated if the wing incorporates significant twist or washout, because the aoa of the outer section could be reduced below the normal zero -lift aoa and thus reverse the lift force on that section. Spars may fracture under those conditions. Many of the uncertified minimum ultralights, and perhaps some of the certificated aircraft, have low torsional wing rigidity that will not only make the ailerons increasingly ineffective with speed (and prone to flutter), but also will place very low limits on Vne and allowable wing loadings. Vne may be so low that it can be readily achieved in a shallow descent at normal cruise power. The problem is that in some home-built aircraft Vne may not be known and could be unexpectedly low! Wing washout: handy at low speed, not so good at high speed! Wings incorporating geometric washout have a significantly lower aoa towards the wing tips. At high speed when the wing is flying at low aoa there are high aerodynamic loads over the wings. But, the outer sections could well be flying at a negative aoa and the reversed load in that area — or just a badly distributed load due to the wing shape — will bend the outer wings down, possibly leading to outer spar fracture. Note: it can happen to certified GA aircraft; two recent (Victoria 2007 and Tasmania 2004) high-speed crashes of Shrike Commander aircraft both exhibited simultaneous negative load failure of both main wing spars at their outer splice joints. This aircraft incorporates 6.5° washout. The atmosphere will demonstrate how puny you are: vertical gust shear and gust loads The effective angle of attack of an aircraft encountering an atmospheric gust with a significant component parallel to the aircraft's normal axis (updrafts, thermals, down-currents, downdrafts, microbursts, macrobursts and lee waves) will be momentarily increased if the air movement is upward relative to the aircraft's flight path, or momentarily decreased if the air movement is downward. Thus an updraft will increase CL and lift causing an upwards acceleration of the aircraft, the magnitude of which is largely determined by the aoa change, the aircraft speed (higher speed — greater g load), the design wing loading and the aspect ratio. The higher the aspect ratio, the greater the change in load factor for a given increase in aoa and the easier it is to overstress the wings at high speed. The effects of shear and gust loads are expanded in the section on wind shear and turbulence. And there are other effects to think about! It is not just the preceding items that may provide problems at high speed. The maximum speed may be limited by the ability of the fuselage to withstand the bending moments caused by the loads on the tailplane necessary to counter the wing's high nose-down pitching moment at very low aoa. Also when nearing the zero-lift angle of attack in a high-speed descent, many cambered wings suddenly experience a very strong nose-down pitching moment and the aircraft will 'tuck under' or 'bunt' rapidly. This instability will certainly make any pilot wish they had not been flying so fast. The symmetrical aerofoil wings often used in powered aerobatic aeroplanes don't have this problem. Also the possibility of a runaway propeller in a fast dive is always there for those aircraft with a constant-speed propeller governor. There is nothing much you can do about that except close the throttle and reduce to minimum flight speed by easing the nose up. Once everything is settled down fly slowly, consistent with the default fine pitch stop blade setting, to a suitable airfield using minimum throttle movements. Another problem is the possibility for extreme loads to be applied in a high-speed pull-up. You can also induce structural damage at moderate speeds! Excessive speed is not always a factor in an aircraft structural failure. In Britain, June 2007, a 900-hour Europa Classic (a type that is represented in the RA-Aus aircraft register) suffered an in-flight break-up. Witnesses said the aircraft had been flying normally but then the tailplane started to make significant up-and-down movements. Then the horizontal stabilisers detached from the rear fuselage, and the wings folded up before separating from the aircraft. The engine stopped and the fuselage plummeted to the ground. The primary cause was probably tailplane flutter, possibly initiated by excessive play developing between the stabiliser torque tube and a mass balance arm. Also, for example, mishandled manoeuvring of weight-shift aircraft can lead to a very fast-acting and uncontrollable pitch autorotation or tumble that imposes extreme transient loads on the structure. The following is a condensed version of an Australian Transport Safety Bureau 'Technical Analysis Occurrence Report' into three fatal accidents. Note: the Coroner's findings in relation to the fatal accident near Atherton does not support any view that the accident was caused by pilot mishandling; rather, the Coroner's "preference is towards port side wing tip separation as a consequence of the un-airworthy state of the aircraft ..." An Airborne Edge trike impacted terrain near Atherton, Qld during a 2005 flight. In 2006 a similar Airborne Edge aircraft impacted terrain at Cessnock, NSW. In both instances, RA-Aus initiated safety investigations during which similarities in the structural failures of both aircraft were observed. In addition, a third accident occurring in 1996 near Hexham involving an HGFA registered Airborne aircraft with similar structural failure was identified. ATSB was asked to conduct technical examination and analysis on recovered parts from the Atherton and Cessnock accidents. Information regarding the 1996 accident was taken from coronial findings. In all three accidents, the failure of the main wingspars had occurred near the wingtip. Qualitative analysis of the structural design and loading of the part and the examination of the coronial findings from the Hexham accident, revealed that all main wingspars had failed under negative g loading. Such loading was likely if the aircraft entered or encountered flight conditions outside the manufacturer's specified flight envelope. Examination of material characteristics of the failed wingspars did not show evidence of material deficiencies that could have contributed to these accidents. The manufacturer's operating handbook prohibited all aerobatic manoeuvres including whipstalls, stalled spiral descents and negative g manoeuvres. The manual specified that the nose of the aircraft should not be pitched up or down more than 45 degrees, that the front support tube of the microlight and the pilot's chest limit the fore and aft movement of the control bar, and that the aircraft should not exceed a bank angle of 60 degrees. Review of photographs of the Airborne Edge, indicate that the wing adopts a degree of twist while in flight. Twist will effect the load distribution by shifting some of the lift from the tips inboard (i.e. more lift is generated in the middle of the wing). Given the structural restraint of the tip struts and battens located at the tip of the trailing edge of the wing, the aerofoil at the wing tip must adjust and try to align with the relative airflow. This results in a smaller amount of lift generated near the wing tips due to a reduced angle of attack to the relative airflow. (Or an aoa reduced below the zero lift aoa; i.e. reversed lift ... JB) 6.2.5 How should I recover from flight at excessive speed? Recovery from an erect dive Generally excessive speed can only build up in a dive, though just a shallow descent can build speed — and rate of descent — quite quickly, particularly in aircraft with high L/D. Table 2 is a calculation of the rate of descent after a few seconds at dive angles of 10°, 30° and 45° — for a moderately slippery light aircraft. It can be seen that even a non-turbocharged aircraft entering a 10° or 15° descent from 8000 feet or so could quickly be exceeding Vne. Recovery from an inadvertent venture into the realm of flight near, or even beyond, Vne is quite straight-forward but requires pilot thought and restraint when initiating the recovery procedure, particularly so if the aircraft is turning whilst diving. Considerable height loss will occur during recovery, so restraint is required when the ground is rapidly expanding in the windscreen. Halt the build-up in airspeed by closing the throttle. Unload the wings to some extent by moving the control column to just aft of the neutral position. The aircraft will be difficult to keep in trim but try to keep the slip ball centred — excess rudder at very high airspeed may strain the tailplane and rear fuselage. Gently roll off any bank while using coordinated rudder; this will ensure the total lift vector is roughly vertically aligned. You must remove the bank before easing back on the stick. Maintain that near-neutral control column position to avoid any asymmetric airframe loading arising from simultaneous application of aileron and elevator at high speed. When the wings are level start easing back on the control column until you are near pulling the maximum load factor for the aircraft — perhaps as much as +4g but allow for turbulence. Hold the applied loading near the maximum until the aircraft's nose nears the horizon then level off. The aircraft will have sufficient momentum to reach this position before opening the throttle. Do not pull back so harshly that subsequent to the sudden rotation about the lateral axis the aircraft's momentum (mass × V) ensures it continues along its original flight vector rather than following the curved recovery path. The result produces a very high aoa, which either induces an extremely high load or goes past the critical aoa and prompts a high-speed stall. Both conditions are very dangerous. If the wing stalls, the aircraft is likely to 'snap roll', applying dangerously high asymmetric loads and quickly losing much height. If it doesn't stall, the sudden very high load is likely to pull the wings off. If you have ample height at the commencement of recovery then there is no need to pull the high g — particularly if the atmosphere is bumpy when gust loads, added to the high manoeuvring g, may prove excessive. A problem with this procedure is that most light aircraft do not have an accelerometer fitted, so it is difficult to judge the g being pulled. However, if properly executed 60° steep turns are practised then you can gain some idea of the 2g load on your own physiology. At the higher end, the average fit person will probably start feeling the symptoms of greyout by 4g. Recovery from a spiral dive In a well-developed steep spiral dive, the lift being generated by the wings (and thus the aerodynamic loading) to provide the centripetal force for the high-speed diving turn, is very high. The pilot must be very careful in the recovery from such a dive, or excessive structural loads will be imposed. If back elevator force is applied to pull the nose up while the aircraft is turning, the result will be a tightening of the turn and rapid increase in rate of descent — thus further increasing the aerodynamic loading or possibly prompting a very high speed stall. Reducing power and levelling the wings must start first, with the rudder and elevators held in the neutral position. As the wings become level with the aircraft still diving at high speed, all the lift that was providing the centripetal force may now be directed vertically (relative to the horizon) and if up elevator is applied the aircraft may start a rapid high g pitch-up — even into a half loop. Thus to prevent this the pilot must hold the elevators in the neutral position while rolling level and even be prepared to start applying forward stick pressure even before the wings become level. Remember: the theme common to all problems encountered when moving at very high speed is that there is little or no warning, and little time to do anything about it! The ONLY safe procedure is not to push the high end of the envelope at any height, don't exceed Vno if the atmosphere is exhibiting any other than light to moderate turbulence, and keep the aircraft airworthy. STRICT COPYRIGHT JOHN BRANDON AND RECREATIONAL FLYING (.com)
 -
6.1 Recent RA-Aus fatal accident history
Admin posted a tutorial in Decreasing exposure to aerodynamic risk
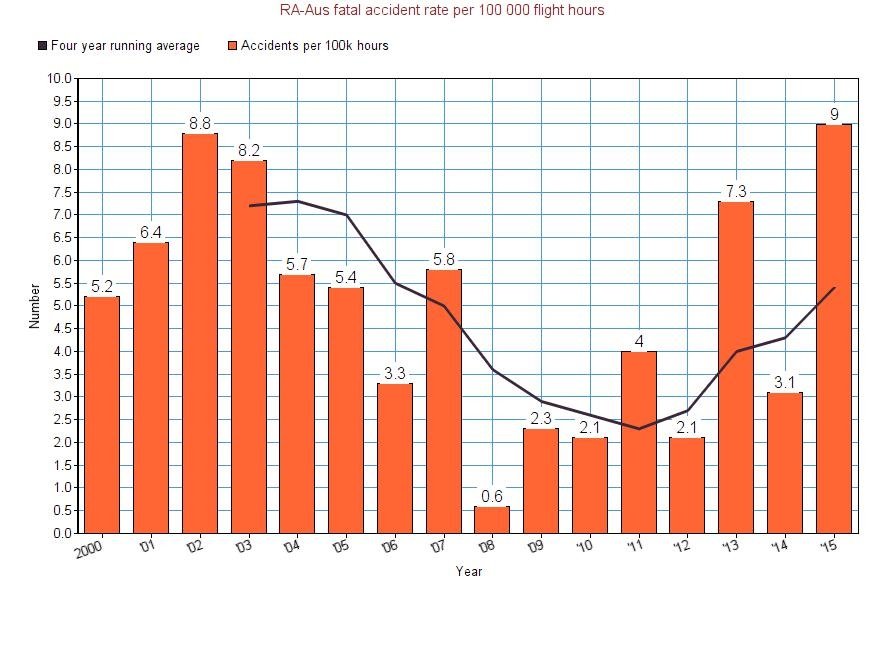 6.1.1 'Lies, damned lies and statistics' We seem to have heard of more fatal accidents in recent years. Why are these accidents occurring? Are RA-Aus sport and recreational pilots and/or aircraft less safe than they were in the 1990s? A person believing that fatalities are inevitable in sport and recreational aviation and examining the fatal accident statistics for the five years 2008 through 2012 (an average of 3.6 per annum) might have concluded that the RA-Aus membership — being representative of powered, fixed-wing, sport and recreational aviation — had, perhaps, then been achieving near-reasonable safety results, after taking into account the fading away of the older ultralight types and the continuing introduction of faster, heavier, more complex and less docile aircraft; together with a marked reduction in the average years of experience of the RA-Aus pilot base. The latter is because of the accelerated intake, and training, of new pilot members during the years 2005-2010 — although there was a very high turnover in newer members. But RA-Aus total voting membership peaked at 10 008 in January 2012 and subsequently experienced a net reduction during 2012-2014. The RA-Aus aircraft register also peaked in early 2012 at 3414 and has reduced to around 3200 in early 2015. However with 11 fatal accidents in 2013 the statistics increased to average 5.8 p.a. for the four years 2010 through 2013; then there were 6 fatal accidents during 2014 increasing the 4-year average to 6.5 p.a. Compounding this were 9 fatal accidents during the January through July period of 2015; IF there are no further accidents during August to December 2015 those 9 accidents will increase the 4-year (2012 through 2015) average to 7.3 p.a. The worst period since the mid-1980s, but the year still has 5 months to go! Such cold, bare statistics fail to reflect the family heartache and economic difficulties resulting from fatal accidents and severe injuries – and the distress that ripples out into the wider community. What adds to the distress, for all of us, is the knowledge that so many current and future accidents have been, or will be, assessed as 'pilot error' or 'human error' and the association just seems incapable of doing anything about it! Generally, shortcomings in knowledge, awareness and task management plus misjudgement and/or unwise decision-making or poor planning, and perhaps neglect plus complacency ("we won't bother checking the take-off distance, we'll be OK!) figure prominently as causal factors in those accidents. Accidents also happen when we attempt to operate in circumstances beyond our experience and/or ability. Quite often, just two or three misjudgements, possibly not that significant in themselves and sometimes combined with a bit of bad luck, lead on to a heap of wreckage. And, of course, there are those few occasions where pilot incapacitation is possibly the cause. For those older members be aware that our abilities (including judgemental ability) and both the speed and appropriateness of our reactions does continue to deteriorate as we age, but some tend to deny it to themselves and to others. (Speaking as an octogenerian who has been able to observe the ageing process on myself and acquaintances for quite a number of years). One acquaintance of similar age told me 'I am still licensed but don't fly pilot-in-command any more – found myself making too many small mistakes and figured I'd better quit before I made the big one'. We — the entire sport and recreational aviation community — must do all we can to bring the number of all such accidents to zero. Fatalities are not inevitable, even an engine failure over heavily forested terrain is survivable and, possibly, some forms of pilot incapacitation accidents could be avoided if pilots follow the pre-flight safety and legality check procedures. Non-conformity to the appropriate aircraft maintenance schedule and procedures is high-risk. Of course there are events that an individual pilot might have little control over, such as a bird strike at a critical time or being struck by an overtaking aircraft on final approach, but again, there may be aspects of situational awareness involved. So, the only statistic that sport and recreational aviation should be striving for is 'zero'; no fatal accidents and no disabling injuries. 'Pilot error' The term appears extensively in safety investigation reports but is often a most unsatisfactory summation of an event and its causal factors; in some cases a police accident investigator can be led to conclude, quite incorrectly, that an accident cause was 'pilot error'; see this Findings of Inquest. In the 1980s the International Civil Aviation Organization [ICAO] — the administrative authority for the world's international air transport system — finally accepted the inevitability of some human error in flight, maintenance and other aviation operations. Consequently, in 1989 ICAO introduced a 'human factors' training and assessment requirement for pilots (and others) and circular 227-AN/136 'Training of operational personnel in human factors' was issued. In 2008, RA-Aus, at last introduced human factors to the flight training syllabus. The Australian Civil Aviation Safety Authority also decided that, from 1 July 2009, 'threat and error management' would be added to the existing human factor aeronautical knowledge examinations, within the day VFR syllabus. A Civil Aviation Advisory Publication CAAP 5.59-1(0) 'Teaching and Assessing Single-Pilot Human Factors and Threat and Error Management' was published in October 2008 and is recommended reading. AUF/RA-Aus fatal accident statistics 1985 to 30 July 2015 There were 149 fatal accidents during the 31 year period 1985 through July 2015. The following bar chart shows the annual distribution of those fatal accidents while the chart line has the effect of smoothing the data by displaying a 4-year running average; the first 4-year period commencing in 1985. The ultralight pioneers were having terrible problems in the formative years of the 1980s (roughly one fatality per annum per 250 members). 90% of the fatal accidents then occurred in ANO 95.10 aircraft; the remainder in ANO 95.25 aircraft. There were about 18 fatal ultralight accidents reported to BASI during 1980 to 1984, then 30 fatal accidents in the period 1985 through 1989 during which period membership grew from around 800 to 2200. The recommendations of the House of Representatives Standing Committee on Transport Safety 'Report on Sports Aviation Safety' began having effect in 1988. The fatal accident rate in those years is not comparable with the current recreational aviation scene as, prior to 1988, the aviation regulations stupidly forced those pioneers to confine their operations to that most dangerous altitude band of no higher than 500 feet above ground level. CAOs 95.32 and 95.55 were introduced in 1990. During the 8-year period 1992 to 1999 AUF ordinary (i.e. voting) membership plateaued at around 3500; the membership turnover was low, pilot training — and the improved availability of choice in aircraft — started to take effect and the fatal accident numbers decreased steadily each year. CAO 95.10, CAO 95.25 and CAO 101.55 types each contributed about 25% of the accidents, with the remaining 25% split evenly between CAO 95.32 and CAO 101.28 aircraft. The factory-built types (95.25, 95.32 and 101.55) were involved in 62% of fatal accidents, and the home-builts in 38%. However, in 1998 the advanced 544 kg 'AUF amateur-built (experimental) ultralight' (the 19-xxxx registrations) was introduced, which did much to provide the platform on which the rather astounding AUF/RA-Aus expansion was based. But this expansion also led to an alarming increase in the number of fatal accidents during the period 2000 through 2006. The amateur-built aircraft figured in 47% of fatal accidents, other home-builts in 10% and factory-builts in 43%, reversing the home-built/factory-built distribution of the 1992 to 1999 period. 6.1.2 Are we getting safer? Recent history 2007-2015 No RA-Aus pilot believes that they will die in an aircraft accident, but the fact remains that during the last 5 years – a period of consolidation rather than expansion of membership and aircraft numbers – the average yearly fatalities are seven pilots and two other occupants, about double the deaths in that prior 5-year period of continuing growth. Note: I occasionally mention an accident causing severe injuries in the following notes but those represent only a few of such accidents where pilots and passengers are admitted to hospital with severe – possibly disabling/disfiguring – injuries. I don't have any reliable statistics for such events but I expect they would exceed the number of fatal accidents; ATSB describes a severe injury as one where the person requires hospitalisation within seven days of the accident. In 2007 RA-Aus membership was still increasing at an annual rate around 13%, which resulted in almost 7800 members at the end of the year. Sadly, 2007 ended as our worst year recorded to that date — eight fatal accidents in which 13 people died, eight pilots and five passengers. In addition there were two other accidents where three occupants were severely injured. A passenger died in nearly two-thirds of the fatal accidents, recording a disastrous increase in such casualties. However, 2008 recorded a great improvement. There was only one fatal accident in an RA-Aus registered aircraft during the year, but sadly both occupants died. There were two accidents where the pilots sustained severe injuries. Since the AUF/RA-Aus was established in 1983 there has been one other year (1996) where only one fatal accident occurred. The average number of aircraft on the register during 2008 was 2850, a 230% increase in aircraft since 1996 so, considering that, 2008 was our safest flying year ever. But the combined 2007 and 2008 total was still nine fatal accidents in which 15 people died. The average annual number of fatal accidents for the four-year period 2005-2008 was 4.5 — less than the 6.0 for the 2001 to 2004 period. The 2009 year started very well; there were no fatal accidents in the first seven months and it looked like the human factors training programs introduced in 2008 were starting to produce the required results. Then there were four fatal accidents between August and December. Two of the accidents involved trikes and a passenger also died in one of the trike accidents. In addition, there was a fifth accident where an RA-Aus three-axis pilot died in a trike registered with HGFA. There were five accidents in which an occupant suffered severe injury. So, a year that started with a lot of promise ended very badly; in effect maintaining the historical average annual number of fatal accidents. The number of aircraft on the RA-Aus register at the end of 2009 was 2955 and there were 9186 ordinary members. There were three RA-Aus fatal accidents in 2010 causing the deaths of three pilots and one passenger, while another passenger was severely injured. Four persons were severely injured in three other accidents. The 2011 year started very badly with two fatal accidents in January and continued in that vein throughout the year to total six fatal accidents. The death toll was eight — five certificated pilots, one student pilot under instruction (i.e. an instructor was in command) and two passengers. It was another very bad year, but it could have been horrific — it was only extraordinarily good fortune that there were no serious casualties when an RA-Aus aircraft, with two persons on board, flew into an operating fairground Ferris wheel. See the Australian Transport Safety Bureau final report. There were three fatal accidents in the first half of 2012 but none during the remainder, two of the accidents involved trikes. The death toll was five — two pilots and a passenger in the trikes, an instructor and a pilot-under-instruction in a Sportcruiser (PiperSport). The 4-year moving average accident rate is now 4.0 per annum, much the same as it had been for the previous four years. 2013 was a disastrous year, we experienced a stunning tally of 11 pilot and two passenger fatalities, a magnitude we have never experienced before. Those 11 fatal accidents are just one less than the total accidents during all of 2010, 2011 and 2012 and increased the annual average to 5.8 p.a. for the four years 2010 through 2013. During 2014 there were six fatal accidents in which eight persons died; six pilots, one passenger and one pilot examiner conducting a biennial flight review, increasing the 5-year average to 6.5 p.a. A small child passenger was severely injured in one of the fatal accidents. To date (1 August 2015) there have been 7 fatal accidents in 2015 in which 8 pilots have died, but thankfully no passengers. One of the accidents involved the worst type of pilot error – a mid-air collision between a Thruster and a Drifter flying in company during a local recreational flight, resulting in the death of both pilots. Not included in these figures is a fatal accident in a nominally non-RAAO associated powered-parachute aircraft that had been allocated an RA-Aus registration number for construction. If there are no further accidents during August to December 2015* those 7 (or 8?) accidents will increase the RA-Aus 4-year (2012-2015) average to 7.3 p.a. *Historically the 3rd quarter of the year has the least accidents but there doesn't appear to be any seasonal influence in the accident rate for the 1st, 2nd and 4th quarters, though there is a tradition (but little backing data) that the 4th quarter has the worst record. The powered recreational aviation scene: 36 deaths in the last 31 months! Of course RA-Aus is not the only association where recreational pilots operate powered aircraft under the exemption CAOs. HGFA pilots also operate trikes under CAO 95.10 and CAO 95.32 plus powered hang-gliders and powered paragliders under CAO 95.8. Also there are non-associated pilots who operate outside an RAAO and thus not under an exemption CAO, i.e. the persons who have inadvertently or deliberately allowed membership/registration to lapse or the few who have never bothered to join RA-Aus/HGFA. The rotary wing gyroplanes operated by Australian Sport Rotorcraft Association members have not been included. Using this broader approach to 3-axis and weight-shift controlled powered aircraft operated by RA-Aus and HGFA members – plus the non-associated fliers – then the total fatalities in just the 31 months – January 2013 to July 2015 inclusive – has reached the very disturbing total of 36 persons – 31 pilots-in-command (25 RA-Aus, 5 HGFA, 1 non-associated), one RA-Aus pilot examiner and 4 passengers (3 RA-Aus, 1 HGFA); 29 of the deaths were associated with RA-Aus, 6 with HGFA and 1 non-associated, the latter seems to have, perhaps inadvertently, allowed RA-Aus documentation to lapse. This broader presentation reflects powered recreational aviation as the general public sees it. The answer to the question — "Does it look like recreational aviators are now getting safer and that there is less chance of fatal accidents?" — is that they are most certainly not getting safer, despite the 2008 introduction of human factors training and the more recent managerial measures — and despite some recent RA-Aus board member statements. Four of the recent RA-Aus fatal accidents involved non-recreational stock and station air work operations, which reflects the lack of compulsory training in such work. Assuredly, we are not improving; perhaps the adage 'The more things change, the more they stay the same' is appropriate? Comparison of the RA-Aus accident rate and the total annual flight hours The following bar and line chart is derived from the annual number of RA-Aus fatal accidents and the total annual aircraft flight hours (reported by aircraft owners at the time annual registration is renewed) to provide the number of fatal accidents per 100 000 flight hours. RA-Aus staff, of course, presume that the annual aircraft flying hours reported by the owners is reasonably accurate. The bars* indicate the number of fatal accidents divided by the number of 100 000 flight hour blocks flown that year and the line indicates a four-year running average of the annual rates. * For example, if there were four accidents in a year when 75 000 flight hours were recorded the calculation would be 4/0.75=5.3 accidents per 100k flight hours. The pattern is interesting. The fatal accident rate per 100k flight hours peaked in 2002* and in the 4-year period 2000-2003, when we were averaging nearly 80 000 flight hours per year, the fatal accident rate was 7.2 per 100k hours, which was nearly as bad as the toll in the early 1980s (which prompted the investigation by the House of Representatives Standing Committee on Transport Safety). During the 2004-2007 period flight hours averaged about 110 000 hours annually and the rate reduced to 5.1 per 100k hours. Then in 2008-2011, when flight hours increased to around 155 000 per annum, there was a big improvement to 2.4 accidents per 100k hours. RA-Aus report 482 000 flight hours accumulated during 2012, 2013, 2014 and I have guessed 100 000 hours for the first 7 months of 2015 so with the 29 fatal accidents recorded for that period, then the rate has jumped up again to 5.4 fatals per 100k flight hours, so we seem to be reverting towards where we were in 2004-2007. A very poor result, particularly considering all the work that has been done. *Note: in 2002 the CAO 95.10, 95.25, 101.28 and 101.55 aircraft accounted for about 75% of hours flown, but by 2012 those aircraft represented less than 10% of flight hours. So, what are the reasons? RA-Aus introduced human factors (HF) training in 2008 and from August that year all student pilots were studying HF in their training and all existing Pilot Certificate holders were required to complete an HF course, or just an examination, by August 2010. Obviously RA-Aus pilots are still not getting the message. HF training is part of airmanship development and is not designed to worsen the safety record, so there must be something wrong in the RA-Aus HF training syllabus — and/or lacking in its implementation by the flight schools and/or in the quality assurance assessment outcome — of both the association's HF training for student pilots and the 2010 HF 'examination' of the, then existing, certificated pilots. In addition, there are concerns whether it was appropriate for the RA-Aus board to persist in its long-standing failure to rapidly disseminate some factual information concerning the occurrence of a serious accident, and the later distribution of the RA-Aus accident investigator's report containing the causal factors. The situation has been that the fatal accidents were not mentioned by the Board executive or RA-Aus management in the website news section or the monthly journal 'Sport Pilot'; not even when the member concerned was well known to, and well respected by, the broad membership. The RA-Aus has not negotiated any arrangement with the State Coroners to allow the fast distribution of some factual causal factor information to the membership – for all fatal accidents – without having to wait, possibly up to six years, for the release of just those rather few, non-restricted, coronial findings. The unpublished policy was that it was left to the membership to learn of the event via the public media's uninformed reports and the internet forums' sometimes grossly speculative chatter, and thus the membership learned nothing of real value from the accident, except, when necessary — but very occasionally — an aircraft airworthiness notice might be issued as a result of the RA-Aus investigative work. All they learned is that their elected representatives did not choose to provide factual causal factor information to the members they represented! Certainly, this negative attitude was doing absolutely nothing to improve safety outcomes and the governance of the Association was neglectful of member and passenger safety — including the safety of those members who need to be protected from their own wilful actions, possibly by re-training or grounding them for a period. There has been considerable tumult in the Board during the past few years and this seems to have contributed to an unusually high turnover in Board members and in the staff, reaching the point where concerns about an apparent lack of corporate knowledge are apparent. For example, the RA-Aus President's report appearing in the July 2014 issue of the monthly RA-Aus members' journal 'Sport Pilot' contained this statement: "The data used in the [Aviation Safety Regulation Review Panel] report covers the period 2008 - 2013. Our fatality rate over this period is pretty steady and some could argue that, aside from 2013, it is downward trending. This is somewhat reassuring and suggests that as pilots (and other participants in our sport) we are less likely to be killed today than we were some years back. To me this is a great result." The ASRR report data referred to purposely excluded all weight-shift controlled aircraft (and stated so) and also did not include other fatal accidents that had not been reported to the ATSB, so the report failed to list eight of the fatal accidents that occurred in 2011 - 2013 and of course 2013, with 13 deaths, was the worst accident year ever recorded and assuredly not 'a great result'. The President's rather odd statement disclosed a notable lack of knowledge ot the RA-Aus fatal accident history and consequently would misinform/mislead those RA-Aus members who were not better informed than he. Perhaps the reason the membership is not 'getting the message' is that the reality is not being publicised vigorously enough in the members' monthly journal and in www.raa.asn.au? The RA-Aus safety management system still seems ineffective. See page 12 of CASA's Sport Aviation Self-administration Handbook 2010 for the elements of a safety management system; also see the text of the 2012-2013 and 2013-2014 CASA/RA-Aus Deeds of Agreement in the members section of www.raa.asn.au. Paragraph B.7 in the statement of purpose section of the RA-Aus constitution is a reminder to all ordinary members and all board members. It states: "To set promote and maintain standards of safety for recreational aircraft by the specification and dissemination of information concerning standards of airworthiness for aircraft, standards of workshops and standards of knowledge for pilots and in particular, to specify, impose and enforce standards of skill and competence reactive to all stages of flying operations and to require any Member to meet such standards to the satisfaction of the Association before authorising such Member to engage in flight operations or any stage or aspect thereof and to grant, issue authorise, modify, cancel, suspend or revoke under the rules of the Association for the time being in force certificates and authorisations relating to aircraft, aerodromes, flying instructing and flying schools and to the skill and qualifications of pilots, instructors, navigators, drivers, mechanics and all persons managing, flying, driving, constructing, repairing or otherwise engaged in connection with recreational aircraft or recreational activities and to do all things relating thereto as may be deemed expedient and to make reports and recommendations to any clubs, authorities or persons concerning the same." I leave it to the reader's own experience to judge whether the actions stipulated by paragraph B.7 are currently being carried out and, as B.7 contains the constitution's sole reference to 'safety', does the constitution as drafted really express any concern with the need for an effective safety management system and the ongoing safety (and safety education) of all the membership and their so-called 'informed participant' passengers? Six passengers (plus one pilot examiner and two student pilots under instruction) died during 2011-2014 which raises the point of how is a passenger made aware of the potential risks inherent in sport and recreational aviation so he/she can make an informed decision about their participation? Various rather bland warning placards, not particularly addressed to the passenger, must be displayed in the aircraft cockpit, but that's hardly sufficient. As the association chooses not to report any information regarding persons fatally or severely injured — for the pilot to include in the pre-flight passenger briefing — how can any person, even the pilot, be regarded as well informed? Can a young passenger make an informed decision? The association doesn't even actively pursue the wearing of suitable safety helmets in flight, particularly for passengers. The role of the Australian Transport Safety Bureau All recreational aircraft accidents/incidents are, or should be, reported to the Australian Transport Safety Bureau. Section 12AB of the Transport Safety Investigation Act 2003 states 'the ATSB is not subject to direction from anyone in relation to the performance of its functions or the exercise of its powers'. Thus a coroner cannot control the release of information by the ATSB. Unfortunately ATSB is not a large organisation, perhaps around 100 personnel (it was required to reduce its numbers by about 10% in 2014) and is also responsible for rail and marine safety investigations. It is rather obvious that ATSB lacks the resources to investigate recreational aircraft accidents, fatal or otherwise, and will not do so unless it considers the safety of the general public may have been threatened or private property damaged. ATSB does provide valuable laboratory assistance to RA-Aus investigations in the fields of metallurgical testing, extract of data from avionics etc. *In a May 20, 2013 document titled 'Focusing our investigative resources' Martin Dolan, the Chief Commissioner and CEO of the Australian Transport Safety Bureau wrote: 'We often get asked how we decide whether to investigate a particular accident or incident that's reported to us. ... we direct our investigative resources to accidents and incidents involving operations that have mature safety systems and will likely uncover a safety benefit or improvement for industry and the travelling public. ... As a result, we generally do not investigate private activities such as sport and recreational flying where there is a voluntary acceptance of a higher level of risk. Those sectors of aviation are largely self-administering and have their own investigation capabilities, working with the police and coroners in the case of fatal accidents. ... When an accident has a high public profile, though, that is one of the considerations we openly take account of in deciding whether to investigate. We recognise that the community sometimes expects we will try and find out what happened, even when it's unlikely that we'll learn something to improve safety. ' ATSB perceives RA-Aus as the organisation responsible for investigating RA-Aus fatal accidents, which results in a negative impact on the dissemination of information to the RA-Aus membership because coroners, in turn, only regard the RA-Aus investigators as part of the police investigation team assisting coroners and thus subject to coronial control in respect to dissemination of their fatal accident investigation reports. Our investigators should be regarded as RA-Aus members trained and appointed by RA-Aus management to do the crash investigation on behalf of the general RA-Aus membership and, to some extent, on behalf of the ATSB. The effect of delayed dissemination or non-dissemination of information from coronial investigations The state police services have coronial jurisdiction to manage and control the site of a fatal recreational aircraft accident thereby preventing unauthorised entry, locating deceased or injured persons, arranging attendance of a medical authority and the transport of deceased or injured persons and, subsequently, coordinating the initial accident investigation. Police may invite participation of accident investigators from a recreational aviation administration organisation. Fatalities are reported to the coroner as a 'non-suspicious reportable death' and the police will maintain charge of the aircraft wreckage until all coronial procedures are concluded. The coroner may be a full-time coroner or a magistrate coroner who will advise the officer in charge as to whether or not further police investigation is required and perhaps order a post mortem examination. The coroner will investigate – with the further aid of police, other investigators and witnesses – the circumstances surrounding the death. For a reportable death the law requires the coroner to establish the identity of the deceased; the medical cause of death (e.g. fatal injuries sustained in an aviation accident); when and where the death occurred and the circumstances surrounding the death i.e. what caused, or contributed to, the aircraft accident. After concluding an initial investigation a coroner may issue his or her findings without holding an inquest ('Findings without inquest') but an inquest may be held if the coroner believes it is in the public interest to do so and/or a 'senior' relative of the deceased requests it. The coroner maintains contact with the family during the coronial process. About 15% (22 000 p.a.) of all deaths in Australia are investigated by coroners of which perhaps less than 3000 result in a coronial inquest. An inquest is a public enquiry by a coroner's court into the cause of a death where various persons associated with the event, or persons thought able to provide 'expert' input, are required to attend and be questioned as witnesses. The coroner's findings, whether 'Findings of inquest' or 'Findings without inquest', may include recommendations to authorities in regard to systems, procedures and regulations with the intention of reducing the likelihood of similar accidents in the future. The coroner will also deliver a cause of death document to the state registrar of births, marriages and deaths, thus enabling the family to obtain the death certificate needed to finalise legal arrangements. However a full coronial investigation is a long (sometimes unbelievably long) but worthwhile, legal process. For example, the coroner's findings from the inquest into the death of research scientist Doctor Barry Uscinski provide informative, perhaps disturbing, reading; but the time elapsed between the accident and release of these findings was 50 months. The police investigator's report concluded that the accident was due to pilot error however the coroner had doubts and the family requested an inquest. The Findings of Inquest, determining that the accident was not due to pilot error, can be read at www.courts.qld.gov.au/__data/assets/pdf_file/0005/337622/cif-uscinski-20141229.pdf". The RA-Aus investigator's opinions as an expert witness seem to form the basis of the coronial findings. Surprisingly 'Findings without inquest' might also take a similar period to be published; for example, see the non-inquest findings for the Zenith Zodiac CH601 crash off Surfers Paradise in March 2008. Although this aircraft was VH registered the ATSB passed it on to RA-Aus thus confirming ATSB's good regard for RA-Aus investigative capabilities. RA-Aus was asked to assist the police investigation and it seems the coroner based his findings on the RA-Aus conclusions. The findings were published in October 2014 (6 years and 7 months after the accident) although in January 2009, RA-Aus issued an airworthiness notice AN070109-1 titled 'Compulsory fitment of a secondary canopy locking device, on Zodiac/Zenair/Zenith aircraft canopy'. This AN just states 'Several reports have been received indicating that the canopy fitted to Zodiac/Zenair /Zenith aircraft are opening in flight causing air turbulence around the tailplane and elevators' and does not mention that the death of two persons 10 months earlier was most likely caused by canopy detachment. Choosing this soft approach rather than making a statement providing more impact on RA-Aus members may have been done to avoid pre-empting the coroner's findings however a bit of judicious wording could have informed the membership of the likelihood of canopy detachment being involved in the deaths of two persons. The findings of the inquest into the death of Philip Henry Scholl took 39 months to publish but are well worth reading, particularly for any member contemplating purchase of a second-hand trike. However the bulk of coroners' findings are not publicly available, distribution being restricted to the next-of-kin and perhaps the police and associated investigators. It is not easy to locate the remaining non-restricted coronial findings on the internet; for example the RA-Aus website contains only two references* to coronial findings, one reveals 32 months between the accident and the date of the finding, the other is 54 months. Obviously a report on an event that occurred 4-6 years previously would be regarded as history by most RA-Aus members reading the coronial findings (particularly those many members who joined the association well after the reported accidents). Grossly delayed accident reporting lacks immediacy in its impact on the membership. It appears that the current national standard for coroners’ courts is that no lodgements pending completion are to be more than 24 months old, so perhaps recreational aviation accidents are regarded as less important and tend to drift toward the back-burner. *The fact that the RA-Aus website contains only two references to unrestricted coronial findings is rather strange as one would presume RA-Aus, as active participants in the coronial investigations, would be on the distribution list when the findings are published. Fatal recreational aviation accidents keep accumulating while coronial investigations drag on. The Doctor Barry Uscinski inquiry took 50 months to complete but in a 50 month period between January 2011 and February 2015 inclusive, 29 RA-Aus accidents killed 38 persons and destroyed 30 aircraft. On top of that it was only extraordinarily good fortune that the October 2011 controlled flight collision with an operating Ferris wheel at Old Bar, NSW did not add members of the public at large to the toll. Self-education - a good pilot is always learning The supply of material for self-education is most important. Martin Dolan, the Chief Commissioner and CEO of the Australian Transport Safety Bureau wrote (May 17, 2013 in answer to a query concerning boating accidents): 'In many cases they reflect what we see with smaller aircraft: the same accidents happening over and over. The best way to tackle these problems would seem to involve clear, targeted safety education [JB's emphasis] about how accidents can be avoided – as many of them are easily avoidable.' The RA-Aus constitution should require dissemination to the membership, as one form of safety education, those very valuable RA-Aus investigator reports that summarise the facts and the investigator's conclusions. Accident investigator's reports were last published in the AUF website in 2004. The following are previously published examples of AUF investigators reports, without the photographs. You will note that the reports do not name any persons. Capella 3 November 2002 combination of factors including pilot misjudgement. Chinook 31 May 2003 student pilot lack of capability (and a query on the wisdom of AUF condoning aircraft ownership — para B.7). RANS Coyote 5 July 2003 illegal non-qualified low flying. Drifter 22 February 2003 'get-home-itis' – flight into low-level IMC. Airborne Edge X 19 December 2002 combination of factors including pilot misjudgement (drag effect of external load on glide path). Harrier 23 March 2002 wing divergence due to aileron flutter in aircraft test dive. Bantam B22S 22 February 2005 EFATO turn back. Corby Starlet 4 October 2003 misjudged speed in forced landing. Drifter 30 July 2003 mustering, no low-level training. Recreational aviators are most certainly not getting safer, possibly the biggest problem is that many, perhaps most, pilots seem to have a feeling of invulnerability believing 'it can't happen to me!' We don't need regulatory changes; recreational aviators need more self-motivation and more consistent, continuing self-education – including some shock treatment. Probably only extensive, graphic and persistent publication of the causal factors and the resultant wreckage of all 82 fatal accidents that have occurred since January 2001, plus a link to the relevant coroner's findings if available, might provide sufficient shock value when printed and distributed to all RA-Aus Pilot Certificate holders. Such material, when seen by their own family members, could place additional pressure on recreational pilots to add improved discipline to their flight activities. I expect the families of fatal accident victims, if approached sensitively, would support such publications; I'm sure they would wish to reduce the number of families that will undoubtedly undergo the suffering and hardship that they have experienced. 6.1.3 I'm a good pilot; I have my pilot certificate, my endorsements and 100s of hours; I feel I am competent enough and sensible enough to avoid an accident, why should I worry? Competency is more than making an excellent landing after a calm flight around the area in fair weather. It has been defined as the combination of knowledge, skills and attitude required to perform a task well — or to operate an aircraft safely and in all foreseeable situations. A flight operation — even in the most basic low-momentum ultralight aircraft — is a complex interaction of pilot, machine, practical physics, airspace structures, traffic, atmospheric conditions, planning and risk. When each and every flight is undertaken it is not only the aircraft that should be assessed for airworthiness; the total environment — airframe, engine, avionics, pilot, atmospheric conditions and flight planning (even the simple planning of how a local fun flight will be conducted) — must support the safe, successful conclusion of each operation. A good pilot never stops learning. The remarks of an instructor, following a very hazardous landing on icy grass, are pertinent: "I have been flying for 45 years and been an RA-Aus instructor for 12 years, but that flight taught me THERE IS ALWAYS MORE TO LEARN". Airmanship is the cornerstone of pilot competency. It is the perception — founded on the acquired underpinning knowledge — of the state of that total environment and its potential risks that provides the basis for good airmanship and safe, efficient, error-free flight. Good airmanship is that indefinable something, perhaps just a state of mind, that separates the superior airman/airwoman from the average. It is not a measure of skill or technique or hours flown, nor is it just common sense (i.e. 'good sense and sound judgement in practical matters'); rather it is a measure of a person's awareness of the aircraft and the current flight environment, and of their own capabilities and behavioural characteristics, combined with sound judgement, wise decision-making, attention to detail and a high sense of self-discipline. For example: "The aircraft, with instructor and student on board, was returning to the airfield when a pitch-down occurred; not known to them the elevator control horn assembly had failed. Control stick and trim inputs failed to correct the situation, but a reduction in power did have a correcting influence, although not enough to regain level flight. A satisfactory flight condition was achieved by the pilots pushing their bodies back as far as possible and hanging their arms rearward. A successful landing at the airfield was accomplished." Insufficient perception, poor judgement (e.g.'I think I can make it!' or worse, 'I think I can make it this time!'), complacency (e.g. 'It'll be OK!') and insufficient self-discipline create a pilot very much at risk. 6.1.4 What kind of flying makes up your hours? Do you often practise engine failure procedures, accelerated stall/unusual attitude recoveries, precise turns and so on, or have you just continually repeated the same operation? Do you try to improve your skills in each flight? Are you aspiring to recognise threats and errors, and manage the risk? Most sport and recreational pilots, as with most general aviation recreational pilots, accumulate only a small number of hours each year. The average annual hours currently reported by RA-Aus Pilot Certificate holders, excluding instructors and students, is only 35 hours; which means that about 50% are flying less than 35 hours. Aircraft owners would put in more hours, aircraft hirers less hours. Perhaps 30 to 40 annual flight hours is enough to maintain just those physical flying skills learned at the ab initio flight school — if the pilot has established a program for self-maintenance of that level of proficiency — but maybe not enough to maintain a high level of cognitive skills: for example situation awareness, judgement and action formulation. Note: the average annual hours flown by RA-Aus aircraft during the last 15 years — including the flight school machines — ranges from 44 to 60, but most years are between 50 and 55 hours, though, of course, some might accumulate ten times that number. Of course, at any time, there are numbers of Pilot Certificate holders – even aircraft owners – who may not have flown for 6 months or more and their lack of recency adds significant risk to flight. The difficult decision for many recreational pilots lies in the situation that, for various reasons, they are only able to undertake those few flight hours. Should flying for enjoyment take a back-seat to the imperative for skill improvement and further inflight educational training? In addition, having completed flight theory studies sufficient to pass the basic aeronautical knowledge test and achieve the Pilot Certificate, it seems that many, perhaps most, pilots leave it at that, failing to expand their knowledge by further in-depth studies of flight dynamics — or even ultralight essentials like microscale meteorology. Possibly because it involves sometimes difficult detail rather than the broad-brush approach of the flight school manual, and perhaps assuming that such knowledge will be accumulated through subsequent flight experience — also hoping, I guess, that they will inherently know how to survive every learning experience. For example, here is a learning experience that the trike instructor was lucky to escape from relatively unscathed, as was his paying passenger: "the pilot intended to conduct a trial instructional flight from a grass strip over 250 metres long. The strip was soft after rain but several solo take-offs had been carried out, each clearing the fence at the end of the strip by 75–100 feet. After some test runs with the passenger on board the pilot elected to take-off using a short field technique. The aircraft accelerated until the nose wheel lifted off the ground and then slowed — with the nose wheel sinking back onto the ground. Because he still believed he had sufficient speed in hand, the pilot tried to make it over the fence; but tripped over it. The aircraft was destroyed." Like the 'Sunday driver', many pilots are just continually repeating the same flight experience — each year is much the same as the last — so all they accumulate is a repetition of one year's experience. They have no program of deliberately accumulating advanced knowledge or skills, nor have they really absorbed the safety basics that should have been instilled into them over the years: always maintain a safe attitude and a safe airspeed when operating at lower levels; if the engine has been misbehaving never take off until the problem is identified and fixed; if the engine goes sick in flight, don't try to make it back to base — land as soon as feasible; don't continue flight into marginal conditions; and so on. The bulk of recreational aviation is undertaken by 'amateur' pilots (using the original meaning of the term; i.e. a lover of a particular activity or pastime) with modest piloting skills. But such pilots, whether PPL or Pilot Certificate holders, must still approach aviation with the attitude of a professional. Too many pilots regard their biennial flight review as a bit of a nuisance, rather than demanding from the reviewer a professional in-depth audit of their competency. Beware your 'friend' the examiner who waives the flight check because he/she is satisfied, by 'discussion and observation', that you are competent. Pay to do the check in a two-seater if your own aircraft is single-seat. 6.1.5 So does a safety problem exist with 'experienced' pilots? Some, perhaps many, pilots are just not ensuring that they continue to accumulate adequate post-Certificate knowledge and skills. In short they never really learn much more about flight dynamics and they lack other pertinent knowledge; and worse, they are just not listening and hearing. On the other hand, there are the very puzzling instances, where those who might be regarded as very experienced and knowledgeable, expose themselves to extreme risk — when surely they know the dice are loaded against them? For instance we have the 10 000 hour pilot who lost his life and that of his passenger near the top of the Great Dividing Range, possibly just because he believed "We can make it under the cloud base!" What may have contributed to that belief and may have led to that possible decision? We just don't know; the only certainty was the location of the wreckage. Some accumulated beliefs may be dangerously false. For example, the long-time pilot who is convinced that a very light aircraft, caught in a strong lee-side down-flow, will always be safe because it will 'go with the flow' when the down-flow flattens out near the bottom of the slope. The sound pilot must understand how the environment parts relate and interact with each other, and judge the likely consequences of any action, deliberate non-action or random event. A systematic approach to continuing improvement in airmanship, plus self-discipline and an ability for self-appraisal, is necessary to achieve that understanding. Don't expect that you can enrol for advanced flight training and somehow that training will reduce your risk exposure to minimum levels. Certainly it will help, but risk management/decision-making is very much in your own hands – do not ignore those rather simple rules that have been established by the cumulative experiences of the pilots that have gone before you during the 110 years of powered aviation history. The Flight Manual or Pilot's Operating Handbook for the aircraft model being flown must be fully understood, and the content re-collectable, when needed in an emergency. You must be totally familiar with the fuel and electrical systems. For an aircraft type that is regularly flown every switch, knob and lever position must be instantly locatable and identifiable without having to hunt for it. Can you find the alternate static vent lever by feel only? Every item in the pre-start and pre-take-off check-lists should be physically verified before opening the throttle — EVERY TIME. It's often the pilot who doesn't do the full checks — because he (usually a male) did them only an hour ago — that gets caught out. Every flight should be prepared and conducted correctly and precisely, using procedures appropriate to the airspace class and without taking shortcuts — even if just a circuit and landing or flight over to the neighbour's strip is contemplated. Pilots should be aware that fatigue, anxiety, emotional state — or flying an aircraft that stretches their skill level, or just flying an aircraft they don't like — will affect perception, good judgement and wise decision-making. If you lack flight experience in a wide range of aircraft types you may find that you have insufficient skill to handle an aircraft that introduces new flight behaviour characteristics and which you are flying for the first time, see this Darwin Coroner's finding resulting from a trike accident (14 months previously). Most studies of aircraft accidents or incidents reveal not a single cause but a series of interrelated events, warnings or actions which, being allowed to progress without appropriate intervention, march on to a possibly catastrophic crash site. Sometimes the final trigger may be relatively innocuous, but sufficient in itself to totally remove a safety margin previously eroded by other events. A U.S. Navy pilot once wrote "In aviation you very rarely get your head bitten off by a tiger — you usually get nibbled to death by ducks." However U.S. Navy pilots are well-trained, well-informed, self-disciplined team players who do not expose themselves to those situations where the tiger concealed out there WILL leap out and bite your head off. For example, take the young male pilot, deemed to have been above average at his flight school two years previously and thought likely to become a very capable aviator, who — in a fit of exuberant youthful bravado — succumbed to temptation and took his equally young female friend for a totally illegal non-qualified low flying demonstration in a RANS Coyote and, when a wing-tip hit a fence line, ended two lives before they had hardly begun, and deeply scarred the lives of the people who loved them.Non-qualified low flying is a killer; checking stock, mustering, checking tanks, buzzing houses, beating-up airfields, low-level photography and power line collisions all figure actively in accident reports. Many years ago, the Australian gliding community demonstrated that there were two main cyclic periods (for them) where people were accident prone. This was about the 100-hour mark, where pilots were beginning to think they were immortal, and about 200-250 hours when they were sure they were; being survivors of the incidents of the first period. Other aviation organisations have indicated similar findings in the 50 to 350 hour period. STRICT COPYRIGHT JOHN BRANDON AND RECREATIONAL FLYING (.com)
 -
Fixed
-
Neck making all the woman in the ladies bathroom run out screaming that just because he is wearing a dress, a woman he does make,...
-
"hi there" from...
-
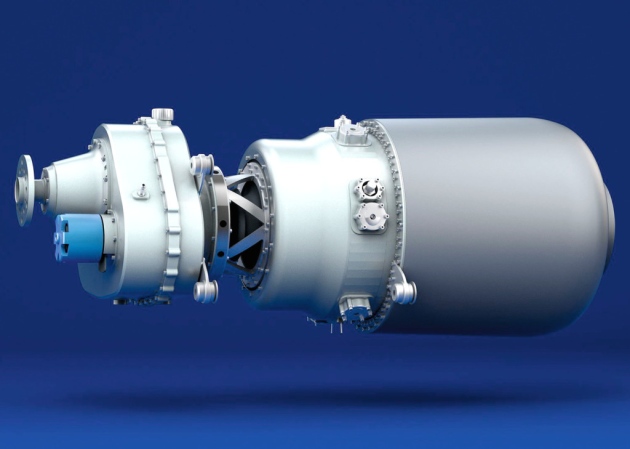 To say aviation and turbines is a happy marriage is true−albeit mainly in the airline, business aircraft and helicopter world. Light aviation, especially the ultralight segment, remains essentially a turbine-free field−apart from noble exceptions, in the form of single-engine jets and ‘experimentals’. Now French newcomer Turbotech is on a mission to challenge the dominance of piston engines and−unheard of in this field−is promising turboprop fuel consumption comparable to piston engines. The company also has an interesting turbogenerator proposal for new e-VTOL and electric aircraft. Currently small turboprops are practically non-existent, although Czech company PBS has in its portfolio the TP100, which should soon be ready for aircraft installation (a few units have apparently been delivered to interested aircraft manufacturers). The TP100 is not in focus of this article as it is way too powerful for typical four-seaters and ultralights, producing 241shp (shaft horsepower). Today’s focus is on Turbotech’s brand new product, the TP-R90 turboprop, which is rated at 90kW (120shp)−neatly falling in the ultralight segment, where aircraft are typically powered today by 100-115hp Rotax piston engines. Turbotech is also offering−based on a similar, but smaller turbine core−another interesting powerplant, the TG-R55 turbogenerator−a ‘range extender’ solution for hybrid-electric powered aircraft. Seeking to establish a toehold in the market, Turbotech showcased its products last year at the most important exhibition in the field, AERO Friedrichshafen in Germany. At their booth I met company CEO and founder Damien Fauvet, who described his products to me. It must be said that many exhibitors hype their wares and you find their miracles tend to take a long time till they prove to work, even if the company doesn’t simply disappear prior to them actually coming to the market. However, Damien’s credibility and the very professional look of his company’s products intrigued me−especially the almost unbelievable claim that Turbotech fuel burn would be comparable to existing piston engines−so I decided to take a closer look. By the end of February this year, the company and the engine’s state of development were apparently at least half-way ready to host a visit. While there was the opportunity, I wanted to see the turboprop running and be able to figure out how they managed to dream up a turbine sipping so little fuel. So I dropped in on Turbotech, which is based at Toussus-le-Noble Airport in the western outskirts of Paris. In Turbotech’s offices, Damien showed to me a video of the first tests of the proof-of-concept engine, run in 2016. That day, the turbine was run up to 41.3kW (56hp)−which approximates the cruise power setting for most ultralights−and the fuel flow was 28.7 litres per hour, a specific fuel consumption (SFC) of 557g/kW hr, to use the yardstick preferred by engineers. At a slightly lower power setting of 38.9kW (53hp) the fuel flow dropped to 25.2 lph (507g/kW hr). Discussing the figures with Turbotech technicians, I gathered that these were only the preliminary data, and that the fuel consumption of the second-generation prototype unit now on test would be further reduced with improvements to the igniters, fuel nozzles, EEC (Electronic Engine Control) and many other components, which were far from being developed production items. Damien proved these predictions correct when, just prior to producing this article, I received the data of the second engine, tested in March this year, where the fuel flow figures were−in line with Turbotech’s promises−slashed dramatically. Running at 66.4kW (90.2shp−just over 70% power), the development engine was now burning only 29.4 litres per hour of Jet-A1, an SFC of 354g/kW hr. At 31kW (42hp), the fuel consumption was just 15.2 lph. According to Turbotech, the definitive version will reach its 90kW target rating and will demonstrate a specific fuel burn close to the target of 340g/kWhr−wow! AERO TG-R55 turbogenerator display It shouldn’t be possible... Turbines are generally taken to be compact and lightweight relative to the amount of power they deliver, only fuel-efficient when operating close to their maximum power output and most suitable as high-power units (2,000shp-plus) for aircraft flying at medium to high altitudes. As benchmark for ‘the turbine advantage’, one of the latest arrivals on the turboprop market, the 7,000shp powerplant for the A400M military transporter, is actually more fuel-efficient than the typical diesel car engine. Thanks to its high pressure ratio and turbine operating temperature, it extracts something like forty per cent or more of the energy contained in the fuel. The advantage over piston engines in airliner and commercial aviation applications is very difficult to match in small turbines. One design path−followed widely in the industry−is to scale down big turbines, but this is unfortunately accompanied by great loss in fuel efficiency. According to Daniel Fauvet, simply scaling down established designs would lead to a very low efficiency microturbine “perhaps extracting only around ten per cent of the energy contained in the fuel”. This is the fundamental reason why we do not have on the market small turbines which are as fuel efficient as modern piston engines. The other stumbling block is that the usual business case for a microturbine−given the large financial investment needed and uncertain market−simply doesn’t make any economic sense. evident quality - Turbotech EEC unit ... So how did Turbotech do it? The key to the possible success of small turbines is solving the problem of their fuel efficiency−specific fuel consumption has to be lowered, and drastically so. Turbotech has done its homework and the configuration of its unit has been refined through CFD (computational fluid dynamics), CAD (computer-aided design) and CAE (computer-aided engineering) using Dassault product Catia and Ansys software, Jean-Michel Guimbard leading the mechanical and aerodynamic design aspects. The result is that the Turbotech microturbine operates at 26 to 30 per cent efficiency. It’s not just the turbine wheel design; when I first saw the Turbotech’s TP-R90 and TG-R55 (TP for turboprop and TG for turbo generator) I thought they looked bulky and over-long, giving the impression of being overweight. Other small turbines are way sleeker and shorter. Aha, but within this extra volume lies Turbotech’s unique selling proposition and the main reason for their engine’s parsimonious fuel consumption. In technical terms, the company says its designs are ‘regenerative’ (i.e. heat recuperating) cycle turbines that re-use energy that is otherwise wasted. Using a proprietary, patented heat exchanger, Turbotech has engineered a breakthrough in small turbine design that will surely be a game changer. To appreciate why, you need to understand how a turboprop engine works. In simple terms, the compressor blows air into the combustion chamber where fuel is introduced and the mixture burns continuously. Energy is taken from the combustion gas by passing it through the turbine, which acts rather like a wind, or water mill. The turbine in turn drives the propeller and compressor. All well and good, but as the turbine is an imperfect device, the exhaust gas, emerging at 700°C or more, still contains a lot of energy. Rather than allow this to go to waste, Turbotech circulates the exhaust gas through a heat exchanger (think of it as radiator) that heats−puts energy into−the air flow from the compressor. And the hotter the air going into the combustion chamber, the smaller the amount of fuel you need to sustain operation. To give an idea of how effective this is, in the absence of Turbotech’s heat exchanger, air emerges from the compressor to enter the combustion chamber at 200°C. With the heat exchanger, it is warmed to 530°C, representing a considerable proportion of energy recovered from the exhaust. As they say, there is nothing new under the sun. What Turbotech is doing is novel in the field of small aircraft turbines but not for large ones. There have been several attempts since WWII by big names in the turbine field like Rolls-Royce, Pratt & Whitney and Allison to use heat recuperation in their designs but none of them was successful, as in practice the weight penalty was excessive and they were too bulky and complex (and therefore too expensive) to justify their use. (Sadly forgotten now, British car maker Rover’s turbine powered Le Mans racer was in 1964 fitted with a rotary regenerator that halved its fuel consumption, and the company came close to putting a similarly equipped saloon car in to production−Ed.) Heat exchangers have been used in stationary turbine powerplants, marine applications and even in the Abrams battle tank (1,500hp, 28% thermal efficiency)−all applications where the extra weight and complexity are acceptable and justified by the fuel saving. Aside from the heat exchanger, the TP-R90 and TG-R55 have the same basic architecture as the typical large-aircraft APU (auxiliary power unit)−a single spool turbine in which a single-stage centrifugal compressor and a radial-flow power turbine are mounted on the same shaft. The clever bit is the way Turbotech makes the compressed air follow a considerably longer path through its heat exchanger before coming to the combustion chamber. To achieve a higher temperature exchange ratio, and to contain its total length, the heat exchanger has been ‘folded’, reducing its installed length by half. In this case he compressed air first travels toward the rear, around the outside perimeter of the annular combustor, and through a first stage of the heat exchanger, and is then turned through 180° to flow forward to combustor, making a second pass through the heat exchanger. Closely guarded IP The heat exchanger is Turbotech’s ‘secret weapon’ in slaying the fuel consumption dragon. I have seen it but unfortunately−and understandably−the company has not allowed me to take any images of it, fearing possible theft of intellectual property. What I am at liberty to say is that it comprises thousands of microtubes made of Inconel, approximately 300mm long which are grouped in two packs of cylindrical shape: one outer ring−running cooler and one inner ring−running hotter, being closer to the exhaust gas path. (Inconel is a registered trademark of Special Metals Corporation for a family of austenitic nickel-chromium-based high temperature superalloys that have a low coefficient of expansion) “The key to a successful microturbine is to build the heat exchanger channels using careful design and the right kind of microtubes,” says Jean-Michel Guimbard. “They need to be as light as possible and they have to have a long life-cycle.” Accordingly, the heat exchanger was designed and manufactured to resist vibration and mechanical and thermal stress. The mechanical stress was of particular relevance as the exhaust gas velocity and temperature varies between the two banks of Inconel microtubes. Probably the most important moment in the process of development of the Turbotech powerplant and of the heat exchanger was the contact with the aerospace supplier Le Guellec, which was asked to manufacture the heat exchanger and became a partner and investor in the Turbotech project after it received insight to the project. Le Guellec is manufacturing its own microtubes on a very cost-effective basis. One important side effect of use of the heat exchanger is that the gases exit the turbine way cooler, at 350°C and at lower velocity compared to traditional turbine engines, so the noise and thermal ‘footprint’ are radically lower. The outer metal casing of the heat exchanger doesn’t exceed 250°C, which makes the Turbotech engine suitable for use in UAVs where a minimal heat signature is essential, and for aircraft made of carbon composites which are particularly sensitive to excessive heat. prototype engine Availability and certification Turbotech is testing and refining the TP-R90 and TG-R55 units, which should be commercially available by mid/end of 2021. A more powerful version of the TG-R55, the 90kW TG-R90 is in the pipeline. Almost identical to the turboprop version, this will weigh 64kg dry/74 kg installed, and should be commercially available by mid 2022. The electric generating efficiency is expected to be 23 per cent (from fuel tank to inverter output). EASA certification for all units will be pursued and is expected to follow in two to three years. Capitalising on the low noise and low thermal signature of the TP turboprop, Turbotech is targeting the UAV market and is a considering number of light aircraft applications including experimentals, ultralights and small helicopters. The promised ‘fuel-burn on apar with the best piston engines on the market’ is almost there, as the latest tests confirm. Of course, Turbotech has yet to prove the reliability of their products in everyday use−so important in aviation world−but having the turbine experts they do in their team I’m confident they will succeed. In my opinion, the emerging market of electrically driven aircraft, and especially the countless e-VTOL door-to-door air taxi designs, will be interested in the TG turbine generator as these applications are power-hungry and we’ve spent years forlornly waiting for promised but not yet delivered high density, lightweight batteries. According to Turbotech, multiple TG-R90 units can be coupled together for electric installations demanding 500kW and more−a heaven-sent power pack for new eVTOLs? For my part, I’m already dreaming about a fast European composite ultralight with a TG-R90 under the cowling. Get ready for an exciting Pilot flight test! development turboprop on test A development turboprop Bringing their skills with them To understand how such a small group of people was able to bring the project to today’s status we have to look at the company’s origins. Turbotech is a French start-up founded by four members in 2009. Their secret is that they previously worked for the Safran Group which is today, together with Go-Capital, one of their principal investors. Ile-de-France (the Paris region) and DGAC (Direction Generale de l`aviation civile) have provided further aid in the form of grants. Damien Fauvet developed a proof-of-concept and then sought and found partners among his former colleagues at Safran. The small group consisting of Fauvet (founder), Jean-Michael Guimbard (Co-founder, CFO & CTO turbomachinery), Baptiste Guerin (co-founder, COO) and Marc Nguyen (co-founder, CTO mecatronic) formed the core team that embarked on fund raising. Success was ensured when Le Guellec (precision tubes and profiles) joined the project and started delivering its microtubes. Le Guellec co-founder and CEO Francois Korner is now part of Turbotech’s management team. turboprop schematic The product range Turbotech has as now, two products in their portfolio, the TP-R90 turboprop and the TG-R55 turbogenerator (the R standing in either case for regenerative and the numbers indicating the turbine power output in kW). Both units feature dual fuel injectors and sparkplugs for ignition, are driven by a proprietary EEC (Electronic Engine Control) system. The EECis similar to the FADEC systems on larger turbines and piston engines, and beside turbine control is capable of the logging data from numerous turbine and gearbox/generator sensors as well as controlling a variable pitch propeller on TP units. The projected TBO is 3,000 hours. A variety of fuels can be used, including Jet-A1, diesel fuel, UL91 avgas and biofuel. Stated fuel consumption (Jet A1, cruise power) is 18-25 lph for the TP-R90, and 15-22 lph for the TG-R55. TP and TG units have only two ceramic bearings (1 ball, 1 roller) where ninety per cent of oil flow is used for cooling and only some ten per cent serves for lubrication. The 90kW TP-R90 single-spool turbine drives a propeller trough the propeller gearbox at the turbine intake end, reducing the turbine’s 80,000 rpm to 2,272 prop rpm. The unit is capable of delivering additional 10kW boost power - in total 100kW - supplied by starter/generator mounted on the gearbox. Price: 65,000 Euro (net) A heat exchanger detail gas turbine modules being produced TP-R90 gearbox casing dimension check compresser intake and volute production TP-R90 drawing production TG-R55 drawing The TG-R55 the turbine drives an generator delivering 53kW electric continuous power at generator output (400 to 900V DC or to customers specs). Engine starting is by the generator running in starter mode. The TG-R55 weighs 55/65kg dry/total and has an electric efficiency of 26 percent. According to Turbotech, as the range extender, the 115kg weight of a package of TG-R55 plus 50kg of Jet A1 fuel offers 155kW hr of electric energy, equivalent to the output of 1,000kg of batteries. Price: 70,000 Euro (net)
 -
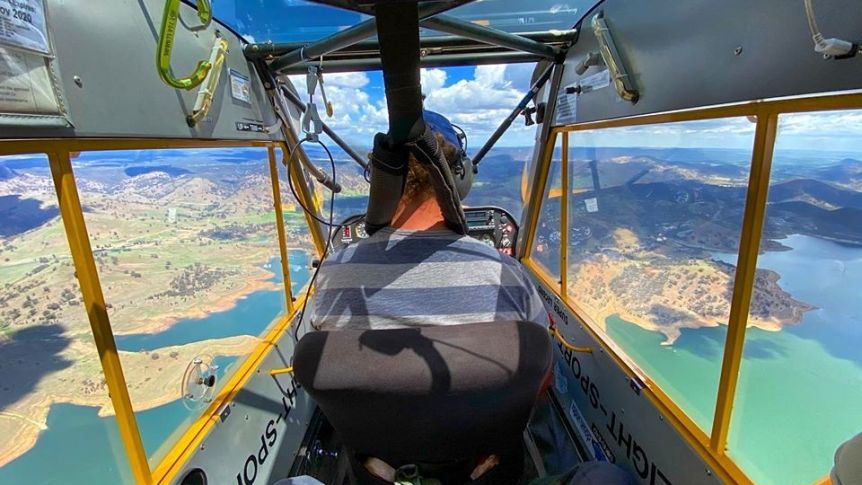 It costs Martin Hone less to fly and maintain his two aircraft than it does his old farm ute. He is one of the 10,000 Australians who have worked out how to fly for fun, and on the cheap — with a recreational pilot's certificate. With safer aircraft, cheaper training and relaxed rules, flying schools and hobbyists are reporting that more people are taking up flying for recreation. At least those who know about it. Turns out you do not have to be Richard Branson or John Travolta to own your own plane or fly to Crab Claw Island for breakfast. 'Pastime just about anybody can afford' The recreational certificate allows people to fly smaller, simpler aircraft, like this two-seater kit ultralight from Florida.(Supplied: Australian Aviation Archives) Mr Hone grew up riding his bike to Moorabin Airport to watch the planes take off. Worried his eyesight was not good enough or he would never be able to afford it, he put his flying dream behind him. That was until he found Recreational Aviation Australia. Formerly the Australian Ultralight Federation, RAAus provided a window for Australians looking to fly small aircraft for fun in 1983. "It wasn't for the average person effectively to go flying for fun," Mr Hone said. We exploded in popularity An Australian Lightwing GR582 sits at the Top End Flying Club in Darwin.(Supplied: Lloyd Greenfield) Under the recreational pilot's certificate, pilots can fly with one other person in a recreation registered aircraft weighing under 600kg at take-off. They cannot fly at night or charge for their flying services (unless instructing). RAAus CEO Michael Linke said it was not until 2007 when light-sport aircraft — heavier and more sophisticated than their ultralight predecessors — came on the market that Australians took to the air in droves. When it comes to medical requirements, RAAus CEO Michael Linke said the same Austroads private driver's licence health standard applied for recreational pilots. So if you are fit to drive a car, you are fit to operate a RAAus aircraft. You can assemble your own kit plane You can pay anywhere from $5,000 for a two-stroke motor aircraft to well over $200,000 at the upper end.(Supplied: Lloyd Greenfield) It took Josh Mesilane 32 hours and $5,760 to get his certificate. The 34-year-old had just bought a house, started a business and was looking to start a family when he realised his flying dreams in 2018. Before that he had no idea recreational aviation existed. The certificate requires a minimum of 20 hours, five of which are solo hours. With schools typically charging between $200 and $300 an hour, you are looking at a bare minimum of $4,000 for your certificate. A Cross Country endorsement will take an extra 12 hours and allows you to fly anywhere in uncontrolled air space (about 95 per cent of Australia). Ross Kilner flies with his dog Bongo from Robe in South Australia's Limestone Coast.(ABC South East SA: Bec Whetham) Comparatively, a general aviation licence issued by CASA costs a minimum of $16,000 and 40 hours of flight time. When it comes to owning an aircraft you can pay anywhere from $5,000 for your "rag and tube", two-stroke motor aircraft to well over $200,000 on your top end. If you're really good with the tools, you can assemble your own kit plane. The return of old-school bush flying Recreational Aviation Australia offers a maintenance course that allows pilots to maintain their own aircraft. Another way to save money... if you are good with the tools that is!(Supplied: Lloyd Greenfield) Former Air Force pilot Dan Compton has made a business teaching recreational pilots at his airfield in Dubbo, 388 kilometres north-west of Sydney. Despite advancements in aviation and aircraft, he has been inundated with people wanting to experience flying "the way it was". Part of the "survival flying" Mr Compton teaches at Wings Out West is the ability to land anywhere. "Everything other than an airport looks big (and) scary." — Dan Compton(Supplied: Dan Compton) He said it was all too common for people to learn to only fly and land on airports, which is problematic. "Then everything other than an airport looks big (and) scary," Mr Compton said. Oh, the places you'll go! Dan Compton says most of his students are in their 20s and 30s.(Supplied: Dan Compton) Being able to land anywhere gives pilots the confidence to fly anywhere. The Top End Flying Club does a really good job of that. Club member Fiona Shanahan has enjoyed learning to fly in Darwin since moving from Melbourne. "You (can) go out to the Adelaide River floodplains and see buffalo and pigs and kangaroos and birds, all sorts of things," Ms Shanahan said. "Occasionally you can see some crocodiles sitting in rivers… you don't get to see that from the ground." A recreational aircraft flies over the Northern Territory at sunset.(Supplied: Lloyd Greenfield) Weekend fly-ins are a regular occurrence at the club. "It's not uncommon for a group of us to go and fly to Crab Claw Island for breakfast," Ms Parker said. Peter Brookman bought the Keith airfield from council a few years ago. He has two planes in the hangar there.(ABC South East SA: Bec Whetham) Mr Linke said pilots could land just about anywhere — with a few requirements, such as a windsock and indicators. Is it safe? Two young aviators at the Top End Flying Club in Darwin.(Supplied: Lloyd Greenfield) Mr Linke said recreational aircraft were just as safe as CASA aircraft. "They're obviously not as safe and don't have the same controls as Qantas and planes like that — they're carrying 500 people." Amateur-built aircraft must meet similar standards. "They've got to be inspected, they've got to get a second person inspecting when you're putting an aircraft together, you've got to get checks and balances together when you're building the aircraft," Mr Linke said. 'It'd be nice to see women' Mr Compton said most of his students are in their 20s and 30s. Then there are the teenagers looking to get a head start. Fiona Shanahan had no idea she would become an avid pilot when she moved from Melbourne to Darwin for work.(Supplied: Fiona Shanahan) "The most lacking thing here in my school… is female pilots and I think that's generally everywhere. 'We use it to bribe them' Tony Wulff and his wife, Peta, added car seats to the back for their two young kids.(Supplied: Tony Wulff) Tony Wulff, in central Victoria, flies the family's plane Percy from their farm strip at Heathcote. He and his wife, Peta, added two car seats in the back to accommodate their two favourite passengers "They really love it. They sit in the back in their car seats and have their little headsets on and hang out the window," Mr Wulff said. "We use it to bribe them quite regularly.
 -
I think it is pretty clear that Recreational Flying it is. I think you know me by now...I am always looking at ways to make the site better for everyone, so I had to ask
-
 ACMA – Australian Communications and Media Authority (managers of the RF spectrum) ADF – Automatic direction finding equipment ADS-B – Automatic dependent surveillance – broadcast AERIS – Automatic en route information service (continuous broadcast network) AFRU – Aerodrome frequency response unit A/G – Air-to-ground (communication) AIP – Airservices Australia Aeronautical Information Publication AIP GEN – The general part of the AIP book AIP ENR – The en route part of the AIP book AM – Amplitude modulation AMSA – Australian Maritime Safety Authority (reponsibilities include all search and rescue; see AusSAR) ATC – Air traffic control sector of ATS ATIS – Automatic terminal information system (continuous broadcast) ATS – Air Traffic Services AUF – Australian Ultralight Federation, now RA-Aus AusFIC – Airservices Australian Flight Information Centre [1800 814 931] AusSAR – AMSA's Australian Search and Rescue organisation AWIB – Automatic weather information broadcast AWIS – Automatic weather information system AWS – Automatic weather station CAA – Civil Aviation Act 1988 CA/GRS – Certified air/ground radio service CAO – Civil Aviation Order CAR – Civil Aviation Regulation CASA – Civil Aviation Safety Authority CASR – Civil Aviation Safety Regulation CAVOK – [cav-okay] Ceiling and visibility better than the minimum VMC conditions for VFR flight CB – The 40 UHF citizen's band channels between 476.425 and 477.400 MHz CENSAR – AusFIC Centralised SARTIME database software — see SARWATCH CL2006 – Current Radiocommunications (Aircraft and Aeronautical Mobile Stations) Class Licence COM or COMMS – The aviation VHF communications band: 118.00 to 136.975 MHz COSPAS – The Russian search and rescue satellite-aided tracking system CTA – Control area CTAF – [see-taff] Common traffic advisory frequency (in the vicinity of an airfield) CTR – Control zone ELB – Electronic locator beacon (obsolete system, not Cospas-Sarsat compatible) ELT – Emergency locator transmitter (aviation distress beacon) EPIRB – [e-perb] Emergency position-indicating radio (maritime distress) beacon ERC-L – En Route Chart–low ERSA – En Route Supplement–Australia ETA – Estimated time of arrival FIA – Flight information area FIR – Flight information region (BN and ML) FIS – Flight information service Flightwatch – Callsign of Airservices Australia's on-request flight information service FM – Frequency modulation GHz – Gigahertz – 1 GHZ = 1 billion cycles per second GNSS – Global navigation satellite system GPS – Global positioning system HF – The 12 aeronautical sub-bands, between 2850 and 22000 kHz, in the domestic and international high-frequency networks HGFA – The Hang Gliding Federation of Australia ICAO – International Civil Aviation Organisation ID – Identification (callsign) IFR – Instrument flight rules kHz – Kilohertz: 1 kHz = 1 thousand cycles per second LCD – Liquid crystal display LED – Light emitting diode LOS – Line of sight (distance) MAYDAY – Prefix to an R/T distress broadcast MTOW – [em-tow] Maximum take-off weight MEM – Memory (electronic) METAR – Routine aviation meteorological report MHz – Megahertz: 1 MHz = 1 million cycles per second Multicom – General airfield communications frequency: 126.7 MHz NAV – Aviation VHF navigation facilities band: 108.1 to 117.975 MHz NAV/COM – The inclusive aviation VHF band from 108.00 to 136.975 MHz NDB – Non-directional (radio) beacon OCTA – Outside controlled airspace PAN-PAN – Prefix to a radiotelephony urgency broadcast PCA – Planning Chart–Australia PEP – Peak envelope power PIC – Pilot in command PLB – Personal locator (distress) beacon POB – Persons on board PROG – Program (microprocessor) PTT – Press-to-talk (button or switch) QNH – The mean sea level pressure derived from the barometric pressure at the station location RA-Aus – Recreational Aviation Australia Inc RCC – AusSAR's Rescue Coordination Centre, Canberra RF – Radio frequency RIS – Radar information service (replaced by SIS) R/T – Radio telephony RPT – Regular public transport SAR – Search and rescue SARSAT – Search and rescue satellite-aided tracking system SARTIME – Time nominated by a pilot for the initiation of SAR action if a report has not been received by the nominated unit SARWATCH – Air Traffic Services SAR alerting system based on position reporting, scheduled reportings and other procedures for IFR flights but also includes VFR flights operating under ATS airways clearance or SIS SIS – ATS radar and ADS-B surveillance information service replacing RIS TAF – Aerodrome weather forecast TTF – Trend forecast UHF – Ultra high frequency band: 300 MHz to 3 GHz Unicom – Ground-based private operator aerodrome communications frequency UTC – Coordinated Universal Time VHF – Very high frequency band: 30 MHz to 300 MHz VFR – Visual flight rules VMC – Visual meteorological conditions VNC – Visual navigation chart VOR – VHF omni-directional radio range VTC – Visual terminal chart