Admin
-
Posts
9,304 -
Joined
-
Last visited
-
Days Won
109
Content Type
Profiles
Forums
Gallery
Downloads
Blogs
Events
Store
Aircraft
Resources
Tutorials
Articles
Classifieds
Movies
Books
Community Map
Quizzes
Videos Directory
Everything posted by Admin
-
I think it is pretty clear that Recreational Flying it is. I think you know me by now...I am always looking at ways to make the site better for everyone, so I had to ask
-
 ACMA – Australian Communications and Media Authority (managers of the RF spectrum) ADF – Automatic direction finding equipment ADS-B – Automatic dependent surveillance – broadcast AERIS – Automatic en route information service (continuous broadcast network) AFRU – Aerodrome frequency response unit A/G – Air-to-ground (communication) AIP – Airservices Australia Aeronautical Information Publication AIP GEN – The general part of the AIP book AIP ENR – The en route part of the AIP book AM – Amplitude modulation AMSA – Australian Maritime Safety Authority (reponsibilities include all search and rescue; see AusSAR) ATC – Air traffic control sector of ATS ATIS – Automatic terminal information system (continuous broadcast) ATS – Air Traffic Services AUF – Australian Ultralight Federation, now RA-Aus AusFIC – Airservices Australian Flight Information Centre [1800 814 931] AusSAR – AMSA's Australian Search and Rescue organisation AWIB – Automatic weather information broadcast AWIS – Automatic weather information system AWS – Automatic weather station CAA – Civil Aviation Act 1988 CA/GRS – Certified air/ground radio service CAO – Civil Aviation Order CAR – Civil Aviation Regulation CASA – Civil Aviation Safety Authority CASR – Civil Aviation Safety Regulation CAVOK – [cav-okay] Ceiling and visibility better than the minimum VMC conditions for VFR flight CB – The 40 UHF citizen's band channels between 476.425 and 477.400 MHz CENSAR – AusFIC Centralised SARTIME database software — see SARWATCH CL2006 – Current Radiocommunications (Aircraft and Aeronautical Mobile Stations) Class Licence COM or COMMS – The aviation VHF communications band: 118.00 to 136.975 MHz COSPAS – The Russian search and rescue satellite-aided tracking system CTA – Control area CTAF – [see-taff] Common traffic advisory frequency (in the vicinity of an airfield) CTR – Control zone ELB – Electronic locator beacon (obsolete system, not Cospas-Sarsat compatible) ELT – Emergency locator transmitter (aviation distress beacon) EPIRB – [e-perb] Emergency position-indicating radio (maritime distress) beacon ERC-L – En Route Chart–low ERSA – En Route Supplement–Australia ETA – Estimated time of arrival FIA – Flight information area FIR – Flight information region (BN and ML) FIS – Flight information service Flightwatch – Callsign of Airservices Australia's on-request flight information service FM – Frequency modulation GHz – Gigahertz – 1 GHZ = 1 billion cycles per second GNSS – Global navigation satellite system GPS – Global positioning system HF – The 12 aeronautical sub-bands, between 2850 and 22000 kHz, in the domestic and international high-frequency networks HGFA – The Hang Gliding Federation of Australia ICAO – International Civil Aviation Organisation ID – Identification (callsign) IFR – Instrument flight rules kHz – Kilohertz: 1 kHz = 1 thousand cycles per second LCD – Liquid crystal display LED – Light emitting diode LOS – Line of sight (distance) MAYDAY – Prefix to an R/T distress broadcast MTOW – [em-tow] Maximum take-off weight MEM – Memory (electronic) METAR – Routine aviation meteorological report MHz – Megahertz: 1 MHz = 1 million cycles per second Multicom – General airfield communications frequency: 126.7 MHz NAV – Aviation VHF navigation facilities band: 108.1 to 117.975 MHz NAV/COM – The inclusive aviation VHF band from 108.00 to 136.975 MHz NDB – Non-directional (radio) beacon OCTA – Outside controlled airspace PAN-PAN – Prefix to a radiotelephony urgency broadcast PCA – Planning Chart–Australia PEP – Peak envelope power PIC – Pilot in command PLB – Personal locator (distress) beacon POB – Persons on board PROG – Program (microprocessor) PTT – Press-to-talk (button or switch) QNH – The mean sea level pressure derived from the barometric pressure at the station location RA-Aus – Recreational Aviation Australia Inc RCC – AusSAR's Rescue Coordination Centre, Canberra RF – Radio frequency RIS – Radar information service (replaced by SIS) R/T – Radio telephony RPT – Regular public transport SAR – Search and rescue SARSAT – Search and rescue satellite-aided tracking system SARTIME – Time nominated by a pilot for the initiation of SAR action if a report has not been received by the nominated unit SARWATCH – Air Traffic Services SAR alerting system based on position reporting, scheduled reportings and other procedures for IFR flights but also includes VFR flights operating under ATS airways clearance or SIS SIS – ATS radar and ADS-B surveillance information service replacing RIS TAF – Aerodrome weather forecast TTF – Trend forecast UHF – Ultra high frequency band: 300 MHz to 3 GHz Unicom – Ground-based private operator aerodrome communications frequency UTC – Coordinated Universal Time VHF – Very high frequency band: 30 MHz to 300 MHz VFR – Visual flight rules VMC – Visual meteorological conditions VNC – Visual navigation chart VOR – VHF omni-directional radio range VTC – Visual terminal chart
 -
 5.7.1 Aviation Search and Rescue [SAR] Formation of AusSAR A Ministerial decision was taken in early 1997 to amalgamate the two aviation and the one maritime Rescue Coordination Centres in Australia into a single agency. The report that the Minister acted upon offered a number of reasons for this approach including the fact that modern communications provided the capacity to coordinate aviation and maritime incidents from a single point bringing with it an improved national response capability. A factor influencing this decision was the increasing use of 121.5 MHz distress beacons where the environment of the unit or person in distress was unknown. As a result, the Australian Maritime Safety Authority was given the responsibility and set up Australian Search and Rescue (AusSAR) as one of its divisions. AusSAR assumed the responsibility for aviation and maritime SAR on 1 July 1997 and maintains the national Rescue Coordination Centre (RCC) in Canberra. The Federal Government, as part of its community service obligations, meets the majority of its operating costs. Aviation SAR In general terms, AusSAR coordinates the response to aviation SAR incidents across Australia except where the incident is covered by other specific arrangements such as an Airport Emergency Plan. AusSAR is reliant on a number of external organisations, the distress frequency monitoring satellite system (Cospas-Sarsat) and the public to provide the SAR alerting function. For aircraft, Airservices Australia is the major SAR alerting agency and its staff notify AusSAR when an aircraft is overdue after communications checks on Air Traffic Service (ATS) frequencies fail to make contact. Airservices Australia also notify AusSAR when there is information concerning imminent or known aircraft crashes, missing aircraft, or distress beacon activations detected by aircraft or ATS. Relationship with Airservices Australia There has been some confusion within the aviation community between the roles of AusSAR and Airservices Australia in regard to the SAR function. Airservices Australia provides In-flight Emergency Response and SAR alerting while AusSAR is responsible for SAR response. In-flight Emergency Response includes air traffic staff providing reasonable advice to assist the pilot in-flight to (1) operate in safe airspace; (2) resume normal operations; and (3) land the aircraft safely. SAR alerting by Airservices Australia (or a flight note holder) occurs when a problem is reported with an airborne aircraft, when no contact can be established following a missed report (arrival, departure, position, operations normal, lost contact following frequency change, etc) or at the expiration of a nominated SARTIME. SARWATCH is a generic term covering SAR alerting based on either full-position procedures, scheduled reporting times, or SARTIME. Full-position procedures and scheduled reporting times are only applicable to IFR flights in all airspace classes and most monitored VFR flights operating in controlled airspace. SARTIME is a time nominated by a pilot for the initiation of a SAR action if a report has not been received from the pilot by the nominated Airservices Australia unit. A VFR pilot operating in Class G airspace may nominate a SARTIME to ATS but the progress of the flight is not monitored, though SAR action will be initiated if there is no communication from the pilot cancelling the SARTIME. Rather than nominating a SARTIME with ATS a flight note lodged with a responsible person, who will raise the alarm should the pilot not report in as scheduled, is preferred for VFR Class G operations. 5.7.2 The SARTIME database As part of its responsibilities, Airservices Australia has introduced a centralised SARTIME database (CENSAR) where SARTIMEs are managed for aircraft arriving at or departing from all aerodromes or where a SARTIME has been submitted through a flight plan or by radio communication. CENSAR alerts the operator when a SARTIME has expired, at which time communications checks are commenced. If this process produces no results at the end of 15 minutes then the situation is passed to AusSAR as an Uncertainty Phase (INCERFA). From an Airservices Australia perspective, a SARTIME can only be cancelled or varied at the request of the pilot. Incidental information that the aircraft has arrived safely at its destination cannot be used to cancel a SARTIME. However, this information is passed to AusSAR by the Airservices Australia CENSAR operator along with the declaration of the phase. AusSAR then takes whatever action is required to ensure the aircraft has arrived safely. Although not a required field in the flight plan, a destination telephone number (which may be a mobile phone number) can often bring a declared emergency phase to a quick conclusion. A SARTIME held by CENSAR is cancelled by the pilot via radio to FLIGHTWATCH before changing to the CTAF or (the preferred method) after landing, via a telephone call to CENSAR (1800 814 931), see AIP ENR 1.1 paragraph 67. (Given the similarity between the names CENSAR and AusSAR, it is not surprising that AusSAR is frequently contacted by pilots wishing to amend or cancel their SARTIME.) Other SAR Alerting and Intelligence Sources Other major SAR alerting sources for AusSAR are the public, police, concerned relatives and friends, and people holding flight notes. The effectiveness of the SAR response is directly related to the timeliness, quality, and accuracy of the information that can be provided on missing aircraft to AusSAR. When other people agree to hold SARWATCH on behalf of a pilot, they should be aware of their responsibilities in the event of an incident and be made aware of the AusSAR aviation contact number (1800 815 257). The importance of early advice so that a search can be mounted before last light should not be missed. While the flight note format at AIP ENR 1.10-23 is a good starting point for the type of information required, accurate intelligence is essential for the early location of an aircraft in distress. A detailed description of the aircraft, its occupants, its planned route, a list of safety equipment carried, whether an ELT and/or Personal Locator Beacon were being carried, whether the pilot and/or passengers usually carry a mobile phone, and so on are all valuable details to assist search planners. Personnel at the departure point such as refuellers and/or other aviators are often valuable sources of intelligence in this regard. Obviously, the most difficult SAR event is one where there is no SARTIME and no details. 5.7.3 AusSAR Aviation Activity Levels During the previous month [March 1999] AusSAR conducted two major searches for missing aircraft. The first was a missing Bell 47 with two POB that was overdue on a flight from Coober Pedy to Kulgera. Following a wide search, the crash site was located on the third day but, unfortunately, there were no survivors. Twenty fixed wing and six rotary wing aircraft were involved at one stage during the search. The second major search incident in March started with a concerned wife phoning AusSAR mid-afternoon saying that she had not heard from her husband. Except for crew details, the only information that she could provide was that it was a Jabiru with two POB expected to fly from Casino to Wangaratta that day. Following a rapid intelligence collection process, it was established that the aircraft had departed Casino at 1035 (local time) intending to track via Tenterfield, Moree and Narromine. Three aircraft conducted an initial search along the planned track before dark and a wide area search commenced the following day. Early into the wide area search a helicopter located the crash scene around 0800 (local) in rugged terrain 15 NM east of Tenterfield. Again, there were no survivors. On the second day, thirty fixed wing and fourteen rotary wing aircraft were involved in the search. In addition to major searches, AusSAR was involved in numerous other activities relating to the aviation environment including a double fatality mid-air between a tug and a glider in the Waikerie area, the forced landing of an aircraft at Bungendore and responding to the ditching of a helicopter in the Cairns area with six of the seven people recovered safely. The aviation section of the statistical summary for the month of March shows that there were 741 aviation SAR phases acted upon and 37 incidents (which includes maritime incidents) where aviation assets were tasked. The aviation SAR phases included 128 IFR fail to report and 515 VFR fail to cancel SARTIME. However, the vast majority of the fail to report or fail to cancel SARTIME were 'technical' phases as the aircraft was safe but the appropriate procedures had not been followed to cancel it from the Airservices Australia system. There is obviously a need for education in this area. Although these 'technical' phases are generally resolved quickly, they do impose a heavy workload and displace other staff efforts in improving the SAR system. The real difficulties are when a major SAR action is in progress and staff resources are being stretched to the limit. On these occasions, the number of 'technical' incidents can detract from marshalling the resources required to assist other aviators whom are believed to be in grave and imminent danger. 5.7.4 Informing the SAR System The Requirement It is fashionable to ponder on what the next decades will bring us. In the aviation sector ICAO has been very active in planning the introduction of technological systems that will enhance air traffic management especially on international routes. These types of systems will add a high degree of accuracy to the current aircraft position in the case of emergency and may take the search out of search and rescue (SAR). Some of these technologies may flow down to the regional and general aviation communities but, due to their initial cost, will be some time in coming. In the meantime if you experience an emergency requiring a forced landing or ditching, how can you best ensure you have provided the SAR system with sufficient information for it to render assistance. This will largely depend upon the ability of the SAR system to respond and your actions in providing it with sufficient information to respond effectively. Marshalling the Response The coordination of a SAR response to an incident involving CASA or RA-Aus registered aircraft rests with Australian Search and Rescue (AusSAR) in Canberra. The word coordination is used as AusSAR has no allocated resources to respond to an incident and it seeks the assistance of response assets from the civil sector through standing or informal arrangements. When the civil sector cannot provide the resources or the available resources are unsuitable, AusSAR is then able to seek assistance from the Australian Defence Force. A SAR incident is defined as a specific situation that causes the SAR system to be activated. In general terms, there are two parts to any SAR response with the first being the search and the second being the rescue. Initially, the degree of search planning is determined by the environment in the incident area, the accuracy of the reported location, the elapsed time since the incident occurred and the availability of suitable search assets. This process is informed by the amount and detail of intelligence that can be gained about the missing aircraft. The rescue plan is conducted in parallel and this is generally undertaken by fixed or rotary wing aircraft that have a standing arrangement with AusSAR or are a specialised emergency response unit located in the vicinity. For incidents on the water, marine craft may also be used. With regard to search assets, aircraft are usually used due to their comparative speed that gives them the ability to cover large areas quickly. The number of aircraft involved will be determined by the size of the area to be searched, the capability and endurance of the aircraft being used and the characteristics of the area to be searched. AusSAR maintains an extensive database of general aviation, police, and specialised emergency service aircraft that are suitable for conducting searches. While twin engine aircraft with good visibility, an accurate navigation system, possessing good endurance and the capacity to carry observers are ideal; it depends on the circumstances as to which aircraft are considered suitable especially in rural and remote areas and search operations to seaward. Some of the more recent larger searches have seen a variety of aircraft types and configurations used including single engine aircraft. While there is a mechanism to pay civil owner/operators on a case-by-case basis for SAR operations, there are occasions when private operators volunteer their services at no charge as a service to the aviation community. There are also many trained police, SES and volunteer observers around the country and they become an important part of any large scale SAR operation. The timeliness of a response to an incident depends not only on the accuracy of information regarding the missing aircraft's flight intentions but also on the accuracy of information held in the AusSAR Aviation Database. AusSAR is interested in obtaining all aircraft details from all aircraft owners/operators and readers are asked to submit their details; a proforma for this purpose can be gained by contacting AusSAR. Any information provided will be subject to the Privacy Act 1988 provisions and will only be used for SAR and emergency response purposes. Please call AusSAR on 1800 815 257 for further details. AusSAR is also interested in non-licensed airfields especially those on properties around Australia. Again, a proforma for this purpose can be gained by contacting AusSAR. AusSAR GPO Box 2181 Canberra City ACT 2601 Telephone: 1800 815 257 Fax: 1800 622 153 5.7.5 Pilot pre-flight preparations Building an Intelligence Picture Now that we have the response organised, it's time to take stock about what preparations you have made to assist the situation if you are the unfortunate soul waiting for the SAR system to perform. In addition to your normal pilot-in-command responsibilities, which include regularly reviewing the Emergency Procedures Section of ERSA, the following points would seem appropriate if AusSAR is to build a rapid intelligence picture: How will your flight be reconstructed if you did you did not submit a flight plan to Airservices Australia, or another organisation, or leave a flight note with a responsible person? In the case of the latter, is the responsible person aware of the AusSAR contact number and the importance of last light regarding the conduct of an initial search? Did the flight plan or flight note include a destination or mobile telephone number, and the phone or mobile number of the pilot? Was there a SARTIME submitted to Airservices Australia? Is there a good description of your aircraft available (external appearance description with a recent colour photograph, equipment fit, emergency and survival equipment including whether an ELT is fitted or a Personal Locator Beacon (PLB) is being carried)? Is there someone aware of your experience, qualifications and aviation habits? How will your passengers and their points of contact be identified? Do the passengers have mobile phone numbers that can be used as an alternative means of contact? Other Points of SAR Significance While many aviators carry a PLB, they leave it in their flight bag in a place that is not easily reached while in flight. The briefing of passengers of its location and purpose may be appropriate. BASI recommends that you and your passengers dress for the terrain and not the destination. It is a sign of good airmanship to monitor 121.5 MHz before engine start and after engine shutdown to ensure that your ELT or PLB or others in the area are not active. All distress beacon detections are treated as distress situations and if you or your passengers inadvertently activate your beacon for longer than ten seconds then turn it off and advise AusSAR of the circumstances via ATS frequencies or telephone. There are no punitive measures for inadvertent activations and early advice will assist in the early resolution of a potential incident. Lastly, if you have activated a distress beacon because you are in grave and imminent danger, if you are able don't forget to take measures to be a cooperative target for search aircraft by using signalling devices such as flares, etc, if available. The imprecision of homing devices mean that the general position can often be quickly determined but the exact position, especially in rugged and covered terrain such as that found on the eastern seaboard, can present major difficulties. Conclusion The coordination of the response to aviation SAR incidents is handled by AusSAR from the Canberra RCC and the effectiveness of the response depends not only on the effectiveness of the search but also on the measures taken by the pilot of the missing aircraft to assist AusSAR by leaving an intelligence trail from which the flight can be reconstructed for search planning purposes. SAR alerting is carried out by a number of means with Airservices Australia being the primary advisory agency for aviation incidents for which Airservices Australia has introduced the centralised SARTIME database (CENSAR). A flight plan or flight note with a destination contact number is most important should an aircraft go missing. Early advice, especially in relation to last light, and good intelligence are both vital to the search planners. AusSAR remains committed to providing an effective SAR response service and it seeks your assistance to ensure that its resources are not dissipated on non-SAR incident responses. STRICT COPYRIGHT JOHN BRANDON AND RECREATIONAL FLYING (.com)
 -
 Distress beacons have been used in aviation for many years and, with some flights now being conducted without the lodgement of flight plans or flight notes or reporting progress, there is increasing importance on having an effective distress beacon as a means of last resort to alert the SAR system that you are in grave and imminent danger. The carriage of aviation distress beacons has been the subject of much debate in the past and this article is designed to bring readers up to date on some of the related issues. The Cospas-Sarsat System The Cospas-Sarsat satellite based system provides distress alerting and location information to search and rescue (SAR) authorities in the aviation, maritime and land environments. The system, which has been in operation since 1982, was originally designed to service a discrete distress frequency on 406.025 (generically stated as 406) MHz but the requirement was expanded to include a service on the aviation distress frequency of 121.5 MHz. In the case of the latter, the physical characteristics of the radio frequency and the output signal mean that there is coarser resolution with beacons operating on this frequency compared to those operating on the higher frequency. There has been major penetration of the 121.5 MHz beacons into non-aviation environments because of their relatively low cost. The Cospas-Sarsat space component comprises a minimum of four Low Earth Orbit SAR (LEOSAR) satellites in polar orbit (two Russian Cospas satellites and two US SARSAT satellites with some reserve units) which monitor 121.5 and 406 MHz. Additionally, the Sarsat satellites monitor 243 MHz which is the military aviation distress frequency. More recently, a number of 406 MHz repeaters have been added to satellites in an equatorial geostationary orbit (termed 'GEOSAR') which provide a supplementary source for near instantaneous alerting of a distress alerting signal should the LEOSAR satellites not have the source in view. A more detailed explanation of the Cospas-Sarsat System can be obtained from the Cospas-Sarsat website. Australia, through Australian Search and Rescue (AusSAR), is responsible for operating the nodal Cospas-Sarsat ground segment in the South West Pacific region. This is done by monitoring satellite intercepted signals from three ground stations, termed Local User Terminals (LUTs), in Albany, Bundaberg, and Wellington (NZ). With 121.5 MHz signals, the three elements in the process (ie the beacon, the satellite and the ground station) must be in view of each other. This is often termed 'local' coverage. With the 406 MHz signal, the satellite has the capacity to time tag the digital information and repeat it when it is next interrogated by a LUT. Through this means, 406 MHz beacons provide 'global' coverage. Beacon Terminology There have been a number of conventions used in the past to describe the various types of distress beacons that have been available in the market place. The current [1999] practice is to use Emergency Locator Transmitter (ELT) to describe those that are fitted to an aircraft, Emergency Position Indicating Radio Beacon (EPIRB) to describe those that are designed to float when immersed in water, and Personal Locator Beacon (PLB) to describe the portable units that are designed for personal use. Compatibility of Older Technology Beacons The 1960s saw the emergence of aviation distress beacons that operated on 121.5 MHz. These beacons met the FAA TSO C91 standard and provided an audible tone on the frequency with the likelihood that other aircraft or air traffic services in the area would intercept it and become aware that an aircraft was in distress. A large number of aircraft were fitted with crash activated fixed ELTs during this period and many commercial operators carried the man-portable Electronic Locator Beacons such as the Garret Rescue 99. These systems are not covered by the Cospas-Sarsat system and continue to rely on the aviation sector for SAR alerting purposes. When a decision was taken to extend the Cospas-Sarsat system to include 121.5 MHz, the standard pertaining to aviation beacons was revisited and a new standard (FAA TSO C91A) was set making the beacon emission suitable for intercept by satellite. The new standard was not made retrospective and many aircraft in Australia still have non-Cospas-Sarsat compatible units fitted. Benefits of Later Technology Beacons The 121.5 MHz beacons in current production are relatively lightweight and inexpensive (with lower end of the market PLBs costing in the vicinity of $A200). They provide an affordable alternative to the more expensive 406 MHz beacons, (which currently [1999] cost from $A1600 but expected to get cheaper) but at an operational cost. There are also 406 MHz beacons being released on the market that have an embedded GPS and automatically report the beacon position in digital form via the satellite system when activated. A comparison of the 121.5 MHz versus 406 MHz beacon technologies is shown below: 121.5 MHz 406 MHz Location Accuracy 15 – 20 km [design specification] 2 - 3 km [design specification] Coverage Local – the beacon, the satellite and the LUT must be in sight of each other Global – the satellite has the capacity to store the information and repeat it for subsequent processing Signal Power 0.1 Watt 5 Watts Signal Type Analog audio signal with no identification feature and subject to high false alert rate due to interference signals Digital with encoded identification of beacon registered owner and capacity to overlay externally provided or embedded GPS position Alert Time Depends on location and varies from 2 hours to the system being ineffective outside coverage areas with ambiguous fix positions often being provided on the first pass Near instantaneous with GEOSAR assisting to provide alerting data if a LEOSAR is not in range. The exception is polar regions where very short delays can be expected. Doppler Location One satellite pass but an ambiguous fix position until resolved by other means or another satellite pass Single satellite pass GPS Location Functionality not available 160 m accuracy (if fitted) Homing Aircraft and vessels use the 121.5 MHz audio signal for homing These types of beacons simultaneously transmit on 121.5 MHz for homing purposes As a result of the location of the three LUTs servicing the Australian region, there are approximately fifty satellite passes serviced per day by AusSAR which results in a typical coverage area and average times for detection of a 121.5 MHz beacon. It should be noted that there are areas, mainly in open ocean areas, around the world where there are gaps in 121.5 MHz coverage. Specific areas not covered of interest to Australia include the Antarctic area, the western Indian Ocean, the southern two thirds of Africa, the mid-southern Pacific Ocean and a gap on the regular Australia to United States air route between the Wellington and Hawaii ground sites. The gap in the southern two thirds of Africa is being addressed in two ways. The first is through ICAO which has mandated that international carriers are to be equipped with 406 MHz beacons when operating in Africa and the second is the planned location of a new LUT site in South Africa which is expected to be operational by late 1999. The major implications for general aviation aircraft operating in Australia using 121.5 MHz beacons is that if the beacon is of the older type, then there is a reliance on other aircraft to detect the 121.5 MHz signal and raise the alarm. This may be problematic in many parts of Australia as only the larger commercial aircraft regularly monitor this frequency. If the beacon is Cospas-Sarsat compatible, the system will generally detect the signal but produce an ambiguous fix position either side of the satellite pass. Follow-on passes, collateral information, or the use of aircraft to investigate both possible positions are used to refine the correct distress beacon position. This evolution takes time and the accuracy of the Cospas-Sarsat derived position is less accurate than with the more technically advanced 406 MHz beacon which usually provides an accurate position on the first pass. These beacons are also encoded with the details of the registered owner and, through the GEOSAR supplementary repeaters, provide near instantaneous advice that an emergency situation exists prior to a Cospas-Sarsat satellite pass. If an embedded GPS is fitted, a position will be passed along with this initial alert advice. The time critical nature of an adequate response is a major consideration when considering the safety of life. Recent ICAO Decisions The ICAO Council agreed in March 1999 that new aircraft operated on extended flights over water or flights over designated land areas shall be equipped with a 406 MHz beacon from 1 January 2002 and existing aircraft will be required to carry them from 1 January 2005. The Council also agreed to write to the Cospas-Sarsat governing body recommending that satellite processing of 121.5 MHz signals cease from 1 January 2009. [This came into effect February 2009] There is an expectation that the international maritime community will follow this lead. A decision regarding the carriage of distress beacons by domestic aircraft in Australia rests with CASA. The FAA has announced that, at this stage, it plans not to mandate the carriage of 406 MHz beacons for general aviation aircraft. One of the major reasons for this position is that emerging technologies may have the potential to offer better and more cost effective solutions for this sector of the industry. There has also been some discussion that, given the dense aviation environment experienced in the US, that 121.5 MHz beacons may remain an effective option without the need for satellite monitoring given that all large commercial operators guard this frequency. However, this is not the case in Australia where many remote operations are conducted without SAR details being lodged and where there is a reliance on distress beacons to act as the primary SAR alerting method. For remote area operations, the low frequency of other traffic in the area must be a consideration in the Australian context when selecting a replacement distress beacon. Conclusion Understanding the division of responsibilities between agencies, informing the system when you are in difficulties and understanding the limitations of distress beacon technology are all important aspects of airmanship. The professional response by the aviation community to the numerous SAR incidents that occur around Australia is publicly acknowledged for, without your assistance, the coordination role of AusSAR would be impossible. STRICT COPYRIGHT JOHN BRANDON AND RECREATIONAL FLYING (.com)
 -

5.5 Safety and emergency communication procedures
Admin posted a tutorial in VHF Radio communications
 5.5.1 Communications when in difficulties Assess the probable outcomes of the available alternative actions When a non-instrument rated recreational pilot realises that he/she is likely to be in difficulties (very low on fuel, lost or in failing light, encountering low cloud and rising terrain) or is already in difficulty (the engine or a control circuit has failed), the top priorities are: (a) fly the aircraft, (b) continue flying the aircraft whilst running through the pre-planned emergency drills and (c) decide the best landing area. During this period an assessment must be made of the probable outcome in terms of possible injury and/or survival following the landing. If the aircraft is a low-momentum type, is normally controllable, pilot only onboard, visibility is okay and the area is clear terrain with a normal rural population density and road infrastructure, then the landing should not be life-threatening to a reasonably competent pilot. If unable to remedy the fault on the ground, the pilot won't have to walk far to find assistance. In this circumstance many recreational aircraft pilots, particularly those in single-seat taildraggers, would not consider communicating any form of alert except, perhaps, to advise an accompanying aircraft. This brings to mind the RA-Aus pilot who underwent three forced landings, due to engine stoppages, on one journey to NATFLY before he finally made it. On the other hand if the pilot is experiencing control difficulty, or the terrain is rough and/or heavily treed, or in a more remote area, or the type of aircraft is such that it is likely that the landing cannot be carried out without some risk of occupant injury then the pilot would be well advised to initiate a distress broadcast — a MAYDAY call — even if there is little time available. Distress is defined as a situation where — in the opinion of the pilot in command — an aircraft (or vessel, vehicle or person) is in grave and imminent danger and requires immediate assistance. The word 'Mayday', an anglicised version of the French 'm'aider' [help me], was adopted in 1927 as the standard radiotelephony distress call. The VHF frequency chosen, at the pilot's discretion, depends on circumstances and should be that which is most likely to provide a quick response or rapid assistance at the scene. The first choice response station will usually be Brisbane or Melbourne Centre on the flight information area frequency or a terminal area frequency. If aircraft height is such that Air Traffic Services are not contactable and the frequency already tuned is a CTAF and other aircraft or a Unicom operator are known to be listening out then use that frequency (but bear in mind CTAFs are not monitored by Air Traffic Services). In very remote areas another option is the international VHF voice distress frequency of 121.5 MHz, which, though also not monitored by Air Traffic Services, is continually monitored by RPT aircraft and others with a good citizen attitude and the communications equipment capability to monitor more than one frequency; see Boyd Munro's comments. But the pilot's primary task is to fly the aircraft while selecting the best landing site and minimising risk to all persons; it is not productive to stall the aircraft while attempting to change frequencies (or just to find an appropriate frequency) or communicate, and you certainly don't want to risk dropping a hand-held transceiver. Requesting assistance There are circumstances that make some form of alert or urgency communication advisable, even if the pilot doesn't want to ask for help or feels a bit embarrassed about it. (But — in my book — better red than dead.) The pilot who is encountering difficulties might decide to request assistance from the ATC on-request flight information service Flightwatch — if contactable on the flight information area frequency — advising the difficulty, the aircraft's approximate location and the pilot's intentions: without the pilot initiating an emergency status. The Flightwatch operator may arrange to directly assist or may decide to treat the situation as an emergency and declare the appropriate emergency phase — uncertainty, alert or distress. See AIP GEN 3.6. The call format might be: FLIGHTWATCH* THRUSTER ZERO TWO EIGHT SIX EXPERIENCING NAVIGATION DIFFICULTIES IN DETERIORATING VISIBILITY REQUEST NAVIGATION ADVISORY *Note: ERSA-GEN-FIS 3.2 indicates it is not necessary to prefix the generic 'Flightwatch' callsign with the callsign of the ATC unit e.g. 'Brisbane Centre'. If the pilot considers there is some uncertainty and/or urgency in the situation, and that assistance may be needed, then he/she may decide to advise of an urgency condition and initiate a PAN-PAN broadcast — stating the nature of the alert, pilot's intentions and assistance desired. Pan derives from the French 'panne' meaning 'breakdown'. Declaring an emergency in an appropriate situation displays good airmanship — and people do like to help. Read the article 'Salvation from above' in the January–February 2001 issue of the Australian Civil Aviation Safety Authority's Flight Safety Australia magazine. A categorised index of articles of interest to recreational pilots contained in Flight Safety Australia since 1998 is available on this site. The VHF urgency and distress calls PAN-PAN and MAYDAY calls are internationally recognised emergency transmissions that initiate ICAO prescribed procedures and offer decided advantages to the pilot in difficulties. Distress calls have absolute priority over all other communications on that frequency, and the word MAYDAY commands immediate radio silence. Radio silence should continue until listeners have determined that communication has been properly established between the station in distress and a responsible authority, and that assistance is being provided. Similarly PAN-PAN urgency communications have priority over all other communications except distress calls. The Flightwatch flight information service or the ATS alerting service will immediately acknowledge any distress or urgency message received, coordinate communications and alert the Australian Search and Rescue organisation [AusSAR] on receipt of a distress call. If any station monitoring a distress or urgency message becomes aware that Flightwatch either has not received the message or, having received it, cannot establish contact with the originator, that station has a responsibility to contact Flightwatch and/or the aircraft, and offer assistance — possibly as a relay station — which may entail remaining in the area. There is an understanding that "In an emergency requiring immediate action, the pilot in command may deviate from any rule ... to the extent required to meet the emergency." However, you would need to ensure that any such departure doesn't cause risk to someone else. Nothing in the CASRs acts to protect the pilot against civil liability in the case of damage to persons or property. Also declaration of an emergency while entering an active restricted area does not guarantee safe passage. For transponder-equipped aircraft also see transponder emergency procedure. MAYDAY call format To remove any uncertainty whether a monitored call is an emergency call, it is most advisable to precede the call with the recognised priorities PAN-PAN or MAYDAY, then transmit as much of the following detail as circumstances allow — bearing in mind the pilot's first priority is to fly the aircraft. If experiencing controllability problems or an engine failure when close to the surface, there won't be much time to bother about formal communication formats. If time is available, distress calls have the preferred format: Priority = MAYDAY (repeated three times) Calling station ID (repeated three times, if time permits) and aircraft type Nature of distress Calling station position, heading and altitude Intentions Other useful information For example, with an engine failure over rough, hilly terrain: MAYDAY MAYDAY MAYDAY THRUSTER ZERO TWO EIGHT SIX / ZERO TWO EIGHT SIX / ZERO TWO EIGHT SIX ENGINE FAILURE ESTIMATED POSITION THREE ZERO MILES SOUTH EAST ALBURY / HEADING EAST / NOW DESCENDING THROUGH THREE THOUSAND INTEND FORCED LANDING IN MITTA VALLEY TWO POB / THRUSTER ZERO TWO EIGHT SIX / MAYDAY Note the last line includes the information that there are two persons on board [POB] and repeats the call sign and the MAYDAY priority. It might help an Air Traffic Services operator, managing several frequencies, if the frequency in use was also transmitted. PAN-PAN call format Urgency calls have the preferred format: Priority = PAN-PAN (three times) Called station ID Calling station ID and aircraft type Nature of emergency Calling station estimated position, altitude and heading Request or intentions Utilising GPS If the pilot in distress is able to communicate, or has established contact, a functioning GPS is a great advantage to everyone concerned, because the pilot is then able to provide a latitude and longitude position probably accurate to 100 metres. Consequently any search only entails a direct flight to that position by one aircraft. Some distress beacons also include Global Positioning System input capability. Other communication means UHF citizen's band [CB]. In rural and outback areas, particularly in the vicinity of the arterial roads, there is widespread usage of UHF CB radios by truck drivers, four-wheel drive vehicles, road crews, mustering crews and fencers. There are 40 CB channels located between 476.425 and 477.400 MHz in 0.025 MHz steps. The road vehicles listen out on channel 40, and channels 5 and 35 are emergency frequencies. Some VHF handheld transceivers might include UHF CB capability and there is quite a good UHF repeater system (channels 1–8/31–38) established in Australia. A cellular mobile communication device may be useful in advising your situation to others. An individual's ability to make radio frequency transmissions in the Australian cellular mobile communications 850, 900, 1800 and 2100 MHz bands is legitimised by the Radiocommunications (Cellular Mobile Telecommunications Devices) Class Licence 2002. An activated mobile communication device in a high-speed aircraft may cause channel interference across cells, but in July 2010 the Australian Communications and Media Authority [ACMA] amended the class licence (which previously prohibited the airborne use of mobile communication devices) to allow operation of a mobile communication device in an airborne aircraft above an altitude of 10 000 feet or, perhaps, 20 000 feet, but only to communicate with a licensed public mobile telecommunications base transceiver station (a 'pico cell' such as those used in large buildings) onboard the aircraft with connection to telecommunications satellites. A control unit blocks onboard devices from terrestrial signals. Under these conditions the mobile devices in the aircraft operate at very low power. So, the class licence authorises persons to use mobile communication devices in aircraft if they are in an airliner equipped with a 'pico cell' unit (and operating under a public telecommunications service licence). The class licence does not authorise the use of any other form of mobile communication device in any airborne aircraft at any altitude. However, in an emergency safety has priority so airborne pilots might contact the ATC centres by mobile 'phone. The telephone numbers of the state ATC centres and the SAR hotline (1800 215 257) are given in ERSA GEN-FIS 'Use of mobile 'phones in aircraft' — store the numbers in your 'phone. For recommended actions during and following an emergency please read all of the ERSA Emergency Procedures Section ERSA EMERG; particularly the 'Activation of ELT' and the survival sub-sections. 5.5.2 Distress beacons and AusSAR ELTs, EPIRBs and PLBs In a life-threatening situation the pilot may activate a radio distress beacon when approaching, or on, the surface. The signal from the beacon will be detected by the specialised search and rescue system — Sarsat (Search And Rescue Satellite Aided Tracking system) and the Russian Cospas. The satellite-mounted Cospas-Sarsat receivers monitor only the global distress frequency, 406.025 MHz and are reputed to have been involved in more than 7000 rescues since the system was introduced in 1982. Analogue transmissions might also be picked up by nearby aircraft — regular passenger transport aircraft usually continually monitor the 121.5 MHz frequency and military aircraft monitor 243.0 MHz. In the Australian aviation regulatory environment, the generic name for distress beacons is Emergency Locator Transmitters [ELTs]. ELTs are usually a fixed installation within larger aircraft, but may be demountable. When armed, ELTs are designed to be activated automatically (perhaps by a g-switch) under a high-impact deceleration; or they can be manually activated by the pilot. (Unfortunately ELTs may not survive a high impact landing or the antenna may be disconnected in a lesser accident.) Similarly, the generic name for 406.025 MHz maritime environment beacons is Emergency Position Indicating Radio Beacons [EPIRBs]. The significant difference between EPIRBs and ELTs is that the former are buoyant and work at their best when floating freely and upright, while the ELTs work best on land — though they should be waterproof. The most expensive EPIRB is the 'float free' or 'float-to-the-surface', automatically activated maritime only type. Smaller, lanyard-equipped, manually operated, category 2 EPIRBs are designed to be placed in the water and allowed to float upright. Personal Locator Beacons [PLBs] were originally designed for personal use by ground travellers in a rugged environment or by those recreational sailors who don't venture very far out to sea — they probably float but perhaps not upright. The manually activated, pocket-sized, analogue PLBs were extensively used by recreational pilots — among many other users. In the Australian aviation scene PLBs and manually activated EPIRBs are classified as portable ELTs so, for aviation regulatory purposes, the ELT term encompasses fixed-installation ELTs and portable ELTs; the latter being the digital PLBs and the manually activated digital EPIRBs. Recreational aviation pilots carry PLBs or, if undertaking significant water crossings, should carry the personal EPIRBs that can be attached to a lifejacket or to clothing. (The term ELB [Electronic Locator Beacon] is sometimes used but this term is no longer defined in aviation regulations or by the Australian Maritime Safety Authority — which has search and rescue responsibility in the Australian region — so the term has no valid usage and adds to the confusion between aviation and AMSA definitions. ELBs were once in use as a 121.5 MHz beacon but their transmission format was not satellite-compatible and production ceased in the early '90s.) The now superseded analogue versions of PLBs/personal EPIRBs transmitted on the 121.5 MHz voice frequency and simultaneously on 243.0 MHz, but not 406.025 MHz. For aural recognition and homing that continuous wave transmission is modulated with a swept tone sounding like a two-tone siren and audible via a VHF transceiver. The 121.5 or 243.0 MHz transmission is used as a short range homing signal by search aircraft or surface vehicles. On 1 February 2010 the class licence for the 121.5/243.0 MHz distress beacons was finally withdrawn by the Australian Communications and Media Authority [ACMA], consequently it is now illegal to use those beacons for any purpose. On land there might be a requirement that PLBs/EPIRBs, when activated, must be placed in the centre of a ground mat formed from a sheet of aluminium kitchen foil, about 120 cm square — which provides the 56 cm radius ground plane. Read 'Activation of ELT' within the emergency procedures section of ERSA. Remember the requirement (AIP GEN 3.6 para 8.2) that pilots should monitor 121.5 MHz before engine-start and after engine-shutdown, to check for the 'two-tone siren' distress transmissions — and to ensure that your own beacon is not activated inadvertently. Distress beacons have been used in Australian aviation for at least 45 years and are an essential item for pilots who fly in sparsely populated areas, and for vehicle drivers who operate in remote areas. The buyer of a distress beacon should be well aware of how to keep it secure and to use it correctly, effectively, and only when in a life-threatening situation; also how to finally dispose of it without possibly causing costly problems to AusSAR. For beacon disposal instructions see beacons.amsa.gov.au/batteries-disposal.html. The 406.025 MHz ELTs On 1 February 2009, the Cospas-Sarsat satellites ceased processing distress signals on 121.5 MHz and now only process signals from the 406.025 MHz digitally-encoded PLBs, ELTs or EPIRBs. So, search (and rescue) for persons using the 121.5 MHz only units is totally dependent on time-consuming, expensive and difficult — and possibly dangerous — air and ground searches. The digitally-encoded PLBs, ELTs and EPIRBs that operate on 406.025 MHz, quickly provide position accuracy to within 5 kilometres or so using satellite trilateration. If the beacon has an integrated GPS input the location coordinate data are transmitted to the satellite, pinpointing the site to within 100 metres or less. This makes redundant the search portion of the rescue operation and greatly aids rapid recovery; and rapid recovery is vital when the aircraft occupants are injured or in difficult circumstances. The 406.025 MHz beacons generally also transmit a low power analogue 121.5 MHz final stage aircraft homing signal; for example, the Australian MT410G PLB at left. When activated the 406.025 MHz beacons send a 0.4-second data packet every 50 seconds. The packet includes a 15 hexadecimal character beacon identity code plus the country/SAR authority code within a 30 hexadecimal character distress message. That message is retransmitted by the satellite to the two AMSA ground stations. The hexadecimal identity code, marked on the unit as purchased, must be known to AusSAR's database, and linked to your personal and aircraft details. Part of the functional working of the 406.025 MHz beacon search and rescue system is having the owner of the beacon register it with the Australian Maritime Safety Authority [AMSA]. Requirement to register and carry 406.025 MHz beacons The requirement for an Australian aircraft to carry an approved distress beacon or emergency locator transmitter is stated in CAR 252A (as amended 1 February 2009). Every two-place recreational aircraft operating beyond 50 nm from their departure point is required to carry a 406 MHz beacon registered with AMSA. Single-place aircraft are amongst those exempted in CAR252A, so carriage of a beacon is not mandatory for CAO 95.10 aircraft — but it is certainly wise to do so. So, recreational pilots should acquire a 406 MHz beacon with internal GPS input (for example, the MT410G costs about $650) and register that beacon. In order to make the process of registration and upkeep of details easier, AMSA have an online registration program. This system is available to all beacon owners to use and there is no charge for its use; go to beacons.amsa.gov.au to register your unit and to find more details regarding how to purchase PLBs. AMSA will provide a registration sticker to be placed on the unit, the stickers provide owners and Flight Operations Inspectors with proof of current registration. The ELT registration must be renewed every two years and a new sticker attached to the device; see 'Renewing your registration'. Note: if a beacon has been activated inadvertently, switch it off and notify the Rescue Coordination Centre Australia by calling 1800 641 792 to ensure a search and rescue operation is not commenced. There is no penalty for inadvertent activations. According to their website — 'since its inception in 1982 the Cospas-Sarsat System has provided distress alert information which has assisted in the rescue of 26,779 persons in 7,268 distress situations [land, sea and air]. In 2008 only, the System provided information which was used to rescue 1,981 persons in 502 distress situations. The locations of these events are depicted on the map below.' For further general information, the next page in this guide is a document Aviation Distress Beacons written some time ago by David McBrien of AusSAR. Personal flight tracking systems There are several flight tracking systems available which allow interested parties to follow the progress of a flight via the internet. For example, Spidertracks is a system developed in New Zealand that uses a small (12×6×3 cm) demountable transceiver in the aircraft (with its own GPS engine) to send location, heading, speed, altitude reports at nominated time intervals — via the Iridium satellite global communications network — to a host computer, which users can access via the internet. The display includes flight track, reporting times and locations overlaid on a Google Earth map. There is a facility available which will activate email or text notification — to a user-nominated person or group of persons — if three contiguous reports are missed. Cost may be a problem. Australian Search and Rescue (AusSAR) If a registered civil aircraft issues a MAYDAY call, or is seen to crash away from a controlled aerodrome or is reported missing, Australian Search and Rescue has national responsibility for coordinating the search and rescue. In addition, AusSAR monitors satellite-intercepted signals via two ground stations in Australia and one in New Zealand. AusSAR is responsible for delivering search and rescue coordination in response to an activated distress beacon within AusSAR's area of responsibility — which covers all the Earth's surface between 75° East and 163° East and roughly 10° South to 90° South. Further information is contained in the document Understanding SAR services. 5.5.3 Aircraft radar beacon transponders Mode A/C transponders Transponders are specialised radio devices that form the airborne part of the Air Traffic Control Radar Beacon System [ATCRBS "at-crabs"]. Transponders respond to a 1030 MHz interrogation pulse, from an air traffic control secondary surveillance radar [SSR], by returning a high-energy 1090 MHz pulse that strengthens the radar return signal. Lower power primary surveillance radar [PSR] exists only within about 50 nm of the major civilian and military airports but such radars don't interrogate airborne transponders. SSR range is at least 100 nm from the radar unit, depending on target height. The surveillance (i.e. computer-aided search and track) radars provide only bearing and distance from the radar site, target height is provided by the airborne transponder. In addition, the response from transponders fitted to smaller civilian aircraft normally consists of a 12-bit ATC assigned identity/status code plus a 12-bit altitude reading (in units of 100 feet) which appear on the controller's SSR screen with the aircraft 'paint'. Civilian units with this identity (Mode A) plus altitude encoding (Mode C) interrogation response capability are known as Mode A/C transponders, sometimes they are referred to as 'Mode 3A/C'; the '3' just refers to a US military classification. The transponders receive the Mode C altitude data from altitude encoding devices. The 12-bit Mode A identity code is separated into four three-bit numerals using octal rather than decimal notation. Thus each numeral will be in the range 0–7; i.e. the numerals 8 and 9 will not appear in any identity/status code. The standard four-digit non-discrete identity code 'squawked*' by VFR aircraft is '1200' (all non-discrete codes end in '00') until radio contact with Air Traffic Services, who might then instruct the pilot to squawk a particular discrete (i.e. individual) code; e.g. 4367. The maximum number of discrete identity codes available for assignment at any one time is about 4000 (in decimal notation). *(Note: the 'squawk' term originated in Britain early in the second World War when the Chain Home early warning radar network was used for the first ground controlled fighter interception system against incoming air raids. The RAF fighters were equipped with a rudimentary 'identification friend or foe' (IFF) transponder, code-named 'Parrot'. When the ground controller required a flight or squadron to switch on their transponders the instruction was "Squawk your parrot". Conversely, "Strangle your parrot" to switch off.) Mode A/C transponders have a very important 'identify' [IDENT] or 'special position identification' [SPI] facility which, when operated, momentarily adds an additional bit to the '1200' non-discrete identity code, or whatever discrete code is being used by the pilot. That causes the aircraft's 'paint' to brighten or change colour on the controller's display. So, for example, when the controller wishes to locate a particular aircraft on the display screen, among all those currently squawking '1200', the controller will request the pilot to "squawk ident"; i.e. operate the 'ident' button, knob or spring-loaded toggle switch. Pilots must not squawk 'IDENT' unless told to do so by ATC or when first squawking an emergency code. The non-discrete transponder squawk codes (for emergency use only) are: 7700 emergency 7600 VHF communications failure 7500 unlawful interference (i.e. hijacking). See transponder emergency procedure below. Mode S transponders The Mode A/C radar surveillance system is rather limited. The Mode S transponders, carried by regular passenger transport aircraft, use their National Airworthiness Authority [CASA for Australian aircraft] assigned permanent 'ICAO 24-bit Aircraft Address'. The 24 binary digits allow a total of 16.8 million individual addresses; thus every aircraft can be permanently assigned a unique address, generally based on the aircraft's country of registration and issued by their National Airworthiness Authority. Consequently, those aircraft can be selectively addressed by ground stations or other aircraft for transfer of information as digital data. This message format is called Mode S (for 'selective address') but the transponders also have the normal Mode A/C functions. *Note: Binary, octal, decimal and hexadecimal numerical notation. Our everyday decimal numbering system has a base of ten with 10 markers 0–9. Octal and hexadecimal notation refer to versions of computer numerical display that assist human perception of the binary digit representation used in computers. Binary numbering is base-2 with two states (on or off) per binary digit (bit) representing 0 and 1. Octal notation is base-8 with eight markers 0–7 and uses one group of three bits to represent any of the eight numerals 0–7. The hexadecimal (or hex) numbering system is base-16 with 16 markers 0–9 plus A–F, the latter representing the decimal numerics 10 through 15. A decimal number of '255' is represented by the hex number 'FF'. Hexadecimal uses one group of four bits to represent any of the sixteen numerals 0–15 rather than the 8-bit byte normally used for alphanumeric coding. For Australian aircraft the ICAO 24-bit Aircraft Address code, also known as the 'Mode S Transponder Code is usually stated in 6-digit hexadecimal notation format. All Australian civil aircraft with a Mode S transponder installed are required to have a registered permanent ICAO 24-bit Aircraft Address assigned; this is accomplished by emailing CASA at [email protected] who will assign a permanent ICAO 24-bit Aircraft Address code for that aircraft in the range '7C0000' to '7F0000'. For RA-Aus registered aircraft the code may be entered into a Mode S transponder by the aircraft owner; for aircraft with national registration (i.e. VH) the code must be entered into a Mode S transponder by an appropriately trained and rated licensed aircraft maintenance engineer (LAME), or CASA authorised person, at the time of transponder installation and re-tested at 2-year intervals. Note: only the CASA assigned aircraft address should be entered into the 24-bit hexadecimal field otherwise there is the possibility of duplication of aircraft addresses. If a CASA-assigned aircraft address has not been entered and verified in a Mode S transponder then the unit may only be operated in A/C mode. Also, as with the Mode A/C transponders, the Mode S transponders have an identification function that may be known as 'Aircraft Identification', 'Flight Identification' or 'FLIGHTID'. This Aircraft Identification may be no more than seven alphanumeric characters but, for RA-Aus registered aircraft, CASA require the Aircraft Identification to be five alphanumeric characters consisting of the four numeric digits of the aircraft's registration mark preceded by the letter 'R' (for RA-Aus) without hyphens or included spaces, e.g. Jabiru 24-7147's identification is 'R7147'. For RA-Aus aircraft the Aircraft Identification is a permanent code, for other aircraft it may be entered/changed by the pilot as required. In Australia, prior to 2010, there was no Mode S secondary surveillance radar network so the main Mode S transponder function was to allow aircraft equipped with Traffic Alert and Collision Avoidance Systems [TCAS] to communicate directly with each other, thereby enabling mutual resolution of potential traffic conflicts. The transponders – in combination with a GNSS receiver – periodically 'squitter' a burst of data containing tracking information such as the aircraft's position, altitude, vector and velocity. (Squitter means a rapid R/F emission.) Such transponders also act as the aircraft's digital modem terminal for data upload/download and distribution. Mode S can also provide faster, more accurate ATC surveillance, provided the ground SSRs are of the fast, single-pulse interrogation Mode S type. The non-Mode S Australian SSRs are now in the process of replacement, both in the main city hubs and en route. When interrogated by a Mode S SSR a Mode S transponder replies with its Flight Identification plus its ICAO Aircraft Address, plus other relevant data. From February 2014 an aircraft that is newly registered (or that is modified by having its transponder installation replaced) and that is operated in Class A, B, C or E airspace, or above 10 000 feet amsl in Class G airspace, must carry a serviceable Mode S transponder, but that Mode S transponder is not required to have the 'extended squitter' hardware and software (known as '1090ES') to transmit Automatic Dependent Surveillance–Broadcast [ADS-B] data. The term 'extended squitter' refers to an additional [112-bit] ADS-B data packet, which is part of the enhanced Mode S transponder data link standards for ADS-B. The 1090ES satellite-based surveillance and traffic management system is currently implemented for Australian airspace above 29 000 feet. See the Australian ADS-B implementation program. TCAS The Traffic Alert and Collision Avoidance Systems [TCAS II], fitted to all Australian RPT aircraft exceeding 30-passenger capability, also send out Mode C interrogation pulses in the same manner as an SSR, and use the interrogation responses broadcast from aircraft Mode A/C transponders (within a range of 14 nm) to determine collision risk. (TCAS computers determine the velocity vector of an aircraft within range — ascertaining distance by the response time, bearing by a directional antenna and altitude from the 12-bit reading encoded in the response.) If there is no altitude given then the computer can only provide a traffic alert rather than a 'resolution advisory' recommending a particular action to the pilot. TCAS II won't detect an aircraft fitted with an operating Mode A-only transponder. TCAS systems also utilise their Mode S-capable transponders to transfer data between aircraft TCAS systems for mutual resolution of traffic conflicts, or to provide a data upload/download link with a ground station. For a description of TCAS read the article 'Collision Avoidance' in the April 1999 issue of the Australian Civil Aviation Safety Authority's Flight Safety Australia magazine. Transponder operating regulations For traffic separation purposes all aircraft — including recreational aircraft — operating in Class A, C and E Australian airspace, or in any airspace above 10 000 feet, must be fitted with an operating Mode A/C transponder. If an aircraft is transponder-equipped the unit must be operated constantly, whether in controlled or non-controlled airspace. There are some exemptions in Class E if the aircraft's electrical system is not capable of continuously powering a transponder. No aircraft may operate in Class E within 40 nm of a Class D tower without a functioning transponder. For further information see controlled airspace. A recreational aircraft operating in Class E should check with Air Traffic Control to confirm that the transponder is functioning correctly. Normal operating procedure: 1. After engine-start turn the transponder mode switch from 'OFF' to 'STBY' (standby) to warm up the unit — which may take a couple of minutes. When the transponder is in 'STBY' it will not respond to an SSR interrogation. Set the identity code '1200' unless advised otherwise by ATC. 2. Before take-off turn the mode switch to 'ALT' (altitude) rather than the 'ON' position. Unless ATC instructs you to do so there is really no need ever to use the 'ON' position. The 'ON' position directs the transponder to respond only to a Mode A interrogation. When 'ALT' is selected, even if there is no altitude encoder fitted, the transponder will still return a response pulse to a Mode C interrogation coming from a ground radar or from a TCAS aircraft, but without any altitude data of course. Leave the switch in the 'ALT' position until turning off the runway at the destination, unless the identity code is to be changed during flight; in which case place the unit in 'STBY' mode while the change is being effected. 3. For further information on operation of transponders see AIP ENR 1.6 subsection 7. A user's manual for the Australian Microair T2000 transponder may be downloaded from the Microair website. Transponder emergency procedure For any transponder-equipped aircraft within radar coverage — say, up to 100 nm from the SSR site for lower altitudes — and whether outside (or underneath) controlled airspace, the ATC radar emergency service will provide navigation assistance if the aircraft is in distress or experiencing navigational difficulties. In an emergency situation the pilot should select the emergency status code 7700, operate the 'IDENT' function and, if possible, contact the service on the overlying en-route area control frequency shown on the ERC-L, call-sign CENTRE; e.g. BRISBANE CENTRE. PAN-PAN PAN-PAN PAN-PAN BRISBANE CENTRE THRUSTER ZERO TWO EIGHT SIX / ZERO TWO EIGHT SIX / ZERO TWO EIGHT SIX EXPERIENCING NAVIGATION DIFFICULTIES IN DETERIORATING VISIBILITY REQUEST POSITION [or NAVIGATION] ADVISORY SQUAWKING 7700 Deviation into an active restricted zone Should an aircraft be forced to deviate into an active restricted zone due to the weather — without an ATC clearance — then the pilot must declare a PAN-PAN, squawk 7700 and broadcast on 121.5 MHz and on the appropriate ATC frequency. ATC will declare an 'Alert Phase'. The declaration of an emergency will not guarantee safe passage in a hazardous restricted zone. Mode C transponder maintenance RA-Aus aircraft owners should note that transponders with an active altitude reporting facility (altitude encoding altimeter or a blind encoder) must be maintained in accordance with CASA regulations not RA-Aus regulations. CAO 100.5 appendix 1 requires that the system is tested by a CASA-licensed maintenance engineer at intervals not exceeding 24 months or after any change/modification to the altitude reporting system component(s) or interwiring. Code 2100 is used by maintenance personnel for testing purposes. 5.5.4 Can it ever be appropriate to monitor 121.5 MHz en route? The following was written by Boyd Munro of Air Safety Australia 121.5 is the International Distress Frequency. A recent survey by Air Safety Australia has revealed that few Australian pilots monitor 121.5, apart from those who work or have worked for an airline, and those with significant overseas experience. I got a big surprise from this, because I always monitor 121.5 en route without even stopping to think why. It’s just something I do, like getting dressed before I leave the house in the morning. Remember that “monitor” in this context means “listen without talking”. The survey also showed that the term “monitor” is quite widely misunderstood. For the most part we Australian pilots are not trained to monitor 121.5 when flying en route, but there are powerful reasons why we should. 1. We are instantly available to another pilot who experiences an emergency in the air, or crashes but still has a working radio and calls on the International Distress Frequency. This is not merely good airmanship, it is responsible citizenship. 2. We can pick up ELT signals, so if another pilot crashes we can bring help to him. ELT signals are also picked up by satellites [this capability ceased 1 February 2009 ... JB] but hours can elapse before one of those satellites passes over the accident site, and if the ELT’s antenna was damaged in the crash the high-flying satellite may not be able to pick up the signal at all. Airmanship/citizenship again. 3. We can be contacted at any time. For example “Aircraft at position X, you are entering restricted area R123 and will be intercepted unless you make a 180 turn and leave the area forthwith.” 4. All airlines monitor 121.5 en route. 5. ICAO requires that all aircraft monitor 121.5 at all times in areas where ELTs must be carried (which includes the whole of Australia). 6. ICAO recommends that all aircraft monitor 121.5 at all times to the extent possible. 7. If you crash and survive but are injured, 121.5 is, overall, the best frequency to use to summon assistance. A call on 121.5 is almost always answered anywhere in the world except in the polar regions. That’s because of the large number of good airmen and good citizens who monitor 121.5 when flying en route. 8. An intercepting aircraft is required by ICAO Annex 2 to call us on 121.5 before shooting us down. Until 27th November 2003, the Australian recommendation (it was never a requirement) was that we should monitor the “Area Frequency” whilst en route VFR. The Australian recommendation now is that we monitor an appropriate frequency. One practical benefit of monitoring 121.5 as opposed to the old “Area Frequency” is that 121.5 is almost silent. The only transmissions ever heard on 121.5 are those relating to distress or an aircraft which ATC has “lost” or transmissions made unintentionally (when the pilot intended to transmit on a different frequency). There is not the noise and distraction that occurs on an area frequency, leaving the pilot better able to fly the aircraft and maintain a good lookout. Air Safety Australia urges all members to become familiar with monitoring 121.5 when flying en route, and then to always consider 121.5 when choosing which frequency to monitor when flying en route. When you monitor 121.5 for the first time, remember that it is a silent frequency. Don’t make any transmissions on it unless you experience an emergency or you are responding to another aircraft which is experiencing an emergency and has transmitted on 121.5 Boyd Munro, 19th March 2004 STRICT COPYRIGHT JOHN BRANDON AND RECREATIONAL FLYING (.com)
 -
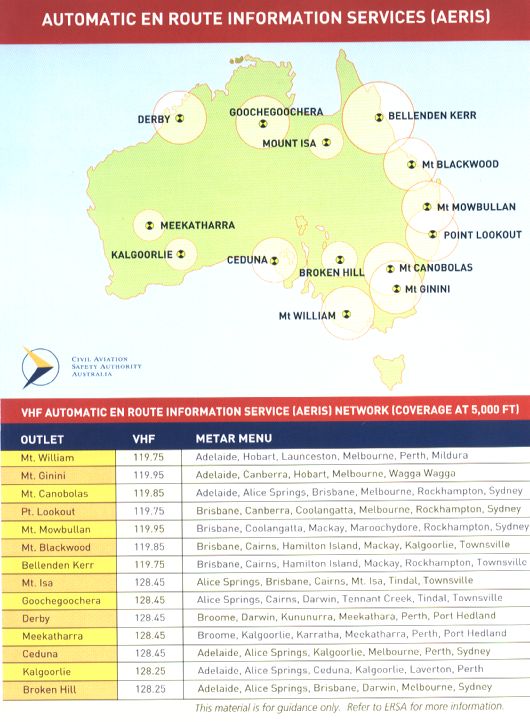 5.4.1 Communications in the vicinity of airfields in Class G airspace Common traffic advisory frequencies If a public-use non-controlled* aerodrome has a reasonable number of daily movements Airservices Australia assigns a discrete VHF frequency to that site, which all aircraft should (not must, see AIP ENR 1.1 para 21.1.14.1) monitor when operating in the vicinity of that airfield. This discrete frequency is known as the common traffic advisory frequency or CTAF (see-taff) and is shown in the ERSA entry for that location and is also depicted on the VNC, VTC and ERC-L aeronautical charts – next to the airfield ID as 'CTAF frequency'; e.g. 'CTAF 118.6'. However, if an airfield or a private airstrip is depicted on the VNC, VTC, ERC-L or WAC aeronautical charts, without a discrete CTAF being shown, then the default 'Multicom' frequency of 126.7 MHz should be used. The larger 'broadcast areas' are defined airspace volumes in Class G airspace for which a discrete CTAF has been allocated. (That discrete CTAF could be 126.7 MHz.) All operations, including those at aerodromes (charted or uncharted) and any landing ground, within this area shall use that CTAF as the broadcast frequency. See AIP Book ENR 1.4 section 3.2. Broadcast area lateral boundaries are shown on the aeronautical charts with a note stating "For operations in this area SFC – (altitude) use CTAF (frequency)". The area around the Avalon, Vic control zone is an example. The lateral and vertical limits are defined on the charts; the default vertical limit is 5000 feet amsl. In all other cases the flight information area frequency should be used at non-controlled aerodromes or landing grounds. *Note: the Civil Aviation Regulations define and use the term 'non-controlled aerodrome', however Airservices Australia's AIP book has been erroneously using the USA term 'non-towered aerodrome' for some time (the term is or was also used in some advisory publications) but, as the 'non-towered aerodrome' term is not yet supported by legislation, all references were deleted from AIP or replaced by 'non-controlled aerodrome' effective 21 August 2014. CARs 166, 166A, 166B, 166C, 166D and 166E establish the regulatory environment for operations at non-controlled aerodromes. If an aerodrome air traffic control tower does not maintain a 24-hour 7-day service CAR 166D allows CASA to classify any of those aerodromes as a designated non-controlled aerodrome during the periods when the control tower is unmanned. The 'designated' term prescribes mandatory carriage and use of radio on the airfield frequency. CAR 166C defines the responsibilities and mandatory actions for broadcasting on VHF radio when operating in the vicinity of a non-controlled aerodrome. When planning a flight into an airfield not listed in ERSA, it is advisable to check the frequency being used with the airfield owner/operator — there are unlisted landing areas where a dedicated airfield frequency, other than the multicom 126.7 MHz, may still exist but is not shown on the aeronautical charts; see specific frequencies. This particularly applies to airfields supporting glider operations. CTAFs are usually not monitored by Air Traffic Services. An aircraft is 'in the vicinity' of a non-controlled aerodrome if it is within a horizontal distance of 10 nautical miles from that aerodrome and at a height above the aerodrome that could result in conflict with operations at the aerodrome. The height dimension of the aerodrome's airspace is a rather nebulous concept — few light aircraft pilots would be familiar with the potential flight path profiles of fast-moving RPT aircraft conducting their normal 'straight-in' or 'circling' approaches or their climb-out; so the upper and lower 'vicinity' limits (at various distances from the airfield with allowance for terrain elevation) are difficult to judge. Perhaps 5000 feet amsl could be regarded as the height limit of the airspace at most CTAF aerodromes – but aerodrome elevation must be taken into account. The 10 nm radius of the 'vicinity' encloses more than 1000 square kilometres of territory which is likely to contain other airfields, private airstrips (and paddocks) used for recreational operations and agricultural work, any of which may, or may not, appear in ERSA or other airfield guides. When aerodromes are in close proximity they are usually allocated the same CTAF, but that is not always so and only the pilot can judge the best time to make the appropriate frequency changes when operating in the vicinity of more than one landing area. CAR 166E requires that, if the aerodrome listing shown in ERSA FAC describes the airfield as 'CERT' or 'REG' or 'MIL' or is a 'designated non-controlled aerodrome'*, then the carriage and use of VHF radio — confirmed to be functioning on the designated frequency — is mandatory for all aircraft operating in the vicinity and, of course, the pilot of an RA-Aus aircraft must hold a RA-Aus radio operator endorsement. There are about 300 such civilian certified or registered airfields in Australia, all of which usually have scheduled regional RPT movements. I have compiled a listing in text file format of those CASR Part 139 certified aerodromes [184] and registered aerodromes [120] but it will not reflect current status, so check ERSA. Carriage of VHF radio is usually not mandatory within the vicinity of the other non-controlled airfields — unless a temporary notam is current — though highly recommended. But all radio-equipped (hand-held or fixed installation) aircraft must maintain a listening watch and must be prepared to broadcast on the CTAF or the Multicom frequency 126.7 MHz. *Note: prior to about 2006 'designated non-controlled aerodromes' were commonly known as 'CTAF(R)s'; in the 1990s they were 'MBZs' – mandatory broadcast zones. CASA have produced two advisory publications to support CTAF procedures and provide guidance on a code of conduct to allow greater flexibility for pilots when flying at, or in the vicinity of, non-controlled aerodromes. These Civil Aviation Advisory Publications (available on this website) are: CAAP 166-1 'Operations in the vicinity of non-controlled aerodromes' (August 2014) and CAAP 166-2 'Pilots responsibility for collision avoidance in the vicinity of non-controlled aerodromes using 'see and avoid' (December 2013). Note that the 'ultralight' term as used in the CAAPs when recommending a 500 feet circuit height, refers only to those minimum aircraft which have a normal cruising speed below 55 knots, or thereabouts. CASA has produced an online interactive learning tool titled 'Operations at, or in the vicinity of, non-towered (i.e. non-controlled) aerodromes' which is now available at CASA online learning. About 100 Australian aerodromes are equipped with an Aerodrome Frequency Response Unit [AFRU] or 'bleepback' — a device that transmits an automatic aural response when a pilot transmits on the CTAF, thus confirming that the pilot is on the correct airfield frequency. AFRU features are explained in AIP GEN 3.4 sub-section 3.4. Accessing AIP Book and ERSA Airservices Australia publishes online versions of the AIP Book, SUPS, AICs and ERSA at www.airservicesaustralia.com/publications/aip.asp (click the 'I agree' button to gain entry). To find a particular section of AIP or ERSA you have to click through a number of index pages. The section/subsection/paragraph numbering system was designed for a readily amendable looseleaf print document, so you may find it a little confusing as an online document. Unicom services Any Unicom (universal communications) service that exists would be a private non-ATS aeronautical station licensed by ACMA that may provide — on pilot request — basic wind, weather and perhaps some traffic advisory information in plain language, but certainly not a traffic separation service. Unicom may be provided by the aerodrome operator, the local refueller or an airline representative during RPT operational periods. Any Unicom facility and call-sign would be indicated in ERSA. Refer to AIP GEN 3.4 sub-section 3.3. The advantage of Unicom to recreational pilots may be that the service (if it operates on the CTAF) provides some additional information and thereby confirmation of the correct frequency selection and operation of the radio. Unicom communications always take second place to pilot-to-pilot communications on the CTAF. Certified air/ground radio services [CA/GRS] In 2011 there remained just one non-towered aerodrome operator (Ayers Rock) providing a 'certified' ground-to-air radio information service on the CTAF to all aircraft operating in the vicinity. This service is usually provided where, and when, there is significant RPT traffic. They are not an Airservices Australia sponsored service but the radio operators 'have been certified to meet a CASA standard of communication technique and aviation knowledge appropriate to the services being provided.' For recreational aviation the service is similar to a Unicom service but the CA/GRS operator will most likely provide better traffic information. For more details read AIP GEN 3.4 section 3.2. Operating times, call signs and any special procedures will be shown in the aerodrome ERSA entry. 5.4.2 Radio procedures at non-controlled airfields Communication requirements when operating in the vicinity of a non-controlled aerodrome are defined in AIP Book ENR 1.1 section 21 table 'Summary of broadcasts - all aircraft at non-controlled aerodromes'. The following seven broadcasts are 'recommended', meaning that the operational decisions regarding their use are then properly left to the pilot. The pilot is expected to conduct operations in an airmanlike manner in accordance with the existing environment and traffic conditions. There may be requirements detailed in the ERSA entry for a particular airfield that vary from the standards detailed below. Some temporary variation in the following procedures may also be stipulated, via NOTAM or AIP supplement, for special events; e.g. the annual Birdsville Race meeting or the RA-Aus Easter weekend national fly-in at Temora. Arrival and transit advisory broadcasts VFR aircraft reaching the vicinity of an aerodrome within Class G airspace, and intending to land, must monitor the designated airfield frequency (otherwise the multicom frequency) and should make these broadcasts on that frequency: an inbound broadcast — by 10 nautical miles from the airfield a joining circuit broadcast immediately before joining the circuit if making a straight-in approach, broadcast on final approach not less than 3 nm from the threshold if joining on base leg, broadcast joining base leg prior to joining on base. (Note: straight-in approaches and joining the circuit on the base leg, though acceptable, are not recommended procedures.) If intending to operate in the vicinity of an aerodrome, rather than land, the aircraft must monitor the appropriate frequency and broadcast: (a) if in transit, an overflying report — by 10 nm from the airfield. (b) if operating from a private airstrip less than 10 nm from the aerodrome, an intentions report once airborne. Regulations recommend a transit report if the flight path passes in the airfield vicinity at a height that 'could result in conflict with operations'. A high-performance aircraft departing from an airfield could attain 5000 feet agl before reaching the 10 nm boundary so caution would dictate a transit report advisable even if cruising altitude is above 5000 feet agl — and an airfield should not be overflown at any height less than 3000 feet agl. If you don't hear or see any other traffic in the area do not assume there is none and neglect to make any calls. Departure advisory broadcasts All aircraft operating from a non-towered aerodrome must monitor the airfield CTAF and should make the following broadcasts on that frequency: immediately before, or during, commencing taxiing to the runway, make a taxiing broadcast broadcast immediately before entering runway. Broadcasts within the circuit The AIP no longer defines any mandatory or recommended broadcasts such as 'turning downwind', 'turning base', 'turning final' or 'clear of runway'. Instead CAR 166C states: 'The pilot must make a broadcast ... whenever it is reasonably necessary to do so to avoid a collision, or the risk of a collision, with another aircraft ...' A turning final broadcast should be regarded as mandatory. It is often difficult to see a stationary aircraft, vehicle or even line marking operators on the runway, let alone an aircraft on a straight-in approach. Most mid-air collisions occur on approach where a faster aircraft descends upon the aircraft in front (see 'Further online reading') and collisions do occur on runways after landing. The turning final call does provide a warning at a time when the aircraft turning is most visible. The necessity for a turning base or other circuit call are matters of judgement that depend upon the amount and type of traffic, separation and flow. The more ordered it is the fewer the calls needed. On the other hand, if there are no other aircraft heard or seen in the circuit then there will be minimum chance of frequency interference or frequency congestion — and it will be safer — if every possible call is made. 5.4.3 Prescribed CTAF broadcast formats All VFR broadcasts from an aircraft station in Class G are quite simple, having much the same content presented in much the same sequence: The location Who I'm calling Who I am Where I am What my intentions are The location repeated Expressed in the official manner: Location (The general area, usually an airfield name) Called station/s ID (Who I'm calling) Calling station ID (Who I am; i.e. aircraft type and registration) Calling station position (Where I am, usually in reference to the airfield) Calling station intentions (What my intentions are) Location repeated For a broadcast transmission there is no specific station being called; you are just addressing all those aircraft stations (and possibly ground stations) in the vicinity who are maintaining a listening watch on the CTAF. The called station ID is usually "TRAFFIC" and presumably this is meant to include ground aeronautical stations and aeronautical mobile stations, rather than just aircraft stations. If you are making a broadcast call where you are asking a question and hope for a response then the called station ID would be "ANY STATION" or "ANY TRAFFIC" preceded by the location name. The calling station ID is the aircraft call-sign which, for RA-Aus aircraft, already includes the aircraft type. For a General Aviation aircraft the calling station ID is the three-letter aircraft registration, so the aircraft type must be added; e.g. PIPER WARRIOR/ALPHA YANKEE CHARLIE. In the following example broadcasts the location is 'TANGAMBALANGA' and the aircraft call-sign is 'THRUSTER ZERO TWO EIGHT SIX'. Taxiing call format The taxiing call notifies all aircraft that you are about to taxi to a runway, and particularly alerts any other ground traffic that is taxiing to or from a runway to be vigilant for traffic movements. [location] TRAFFIC CALL-SIGN TAXIING RUNWAY (number) Location repeated For example: TANGAMBALANGA TRAFFIC THRUSTER ZERO TWO EIGHT SIX TAXIING RUNWAY TWO FIVE TANGAMBALANGA Entering runway call format The 'entering runway' call alerts any traffic in the circuit or clearing the runway that you are about to use the runway for take-off. The call particularly alerts aircraft on base leg or straight-in approach to be prepared to go around in the event that there is a conflict. (Location) TRAFFIC CALL-SIGN ENTERING RUNWAY (number) (Intentions or the departure quadrant) Location repeated For example: TANGAMBALANGA TRAFFIC THRUSTER ZERO TWO EIGHT SIX ENTERING RUNWAY TWO FIVE (or ENTERING AND BACKTRACKING RUNWAY TWO FIVE) FOR CIRCUITS or DEPARTING TO THE SOUTH TANGAMBALANGA Aircraft should remain at the runway holding point until all checks are complete and the runway and the approach are seen to be clear — then make the ENTERING RUNWAY broadcast. If there has been a significant delay between the entering runway broadcast and commencement of take-off then a ROLLING call may be helpful to aircraft on the approach. The format would be the same as the entering runway call but with the word ENTERING replaced with ROLLING. If you decide to abandon the take-off after entering the runway then broadcast ABANDONING TAKE-OFF plus your intentions regarding vacating the runway. If you intend taxiing to an exit keep to the left of the runway — just in case! Inbound call format (Location) TRAFFIC CALL-SIGN (Position — reported as the distance and the compass quadrant from the aerodrome) (altitude) (Intentions) Location repeated For example: TANGAMBALANGA TRAFFIC THRUSTER ZERO TWO EIGHT SIX ONE TWO MILES NORTH-EAST / TWO THOUSAND FIVE HUNDRED INBOUND or INBOUND FOR A STRAIGHT-IN APPROACH RUNWAY TWO FIVE TANGAMBALANGA Straight-in approaches are acceptable but not recommended. If you intend to make a straight-in approach that intention should be included in the initial inbound broadcast. Some aircraft may report their position in terms of magnetic bearing from the airfield or the VOR radial. Such information is officially acceptable but the compass quadrant format is advisable, being readily understood by all and quite sufficient to alert other aircraft. Note that the word 'altitude' does not precede 2500; the figures are unlikely to be confused with anything else. Do not precede the altitude figures with the word 'AT' — which is reserved to specify time. When on descent the altitude might be expressed as 'DESCENDING THROUGH (altitude)'; e.g. 'ONE TWO MILES NORTH-EAST / DESCENDING THROUGH FOUR THOUSAND FIVE HUNDRED'. Also note that we have transmitted the location twice, which is always required as there may be several airfields within range on the same frequency, and doubling up the name helps to clarify the transmission. If the airfield name is short, or similar to another airfield within range (say 60 nm), then additional mention of the location may be appropriate; as in the following: BOURKE TRAFFIC THRUSTER ZERO TWO EIGHT SIX ONE THREE MILES NORTH-EAST BOURKE / TWO THOUSAND FIVE HUNDRED INBOUND BOURKE If your groundspeed is low and it will take some time to reach the circuit area it may be advisable to add your estimated time of arrival to the intentions. If so, it is conventional for the time to be expressed in minutes past the hour, in which case the previous call might be: 'INBOUND ESTIMATE BOURKE AT FOUR FIVE'. If you estimate your arrival will be near enough to the hour then the call would be 'INBOUND ESTIMATE BOURKE ON THE HOUR'. Don't forget aviation times are UTC so the minutes in local time do not coincide with the minutes in UTC when the time difference in the area includes a half-hour — Central (Australia) Standard Time, for example. In such instances it may be advisable to append the word 'ZULU' to the time in UTC minutes — or best use the local time and append the term 'LOCAL TIME' to the message; i.e. 'INBOUND ESTIMATE BOURKE ON THE HOUR LOCAL TIME'. Transit call format (Location) TRAFFIC CALL-SIGN (Position — reported as the distance and the compass quadrant from the aerodrome) (altitude) (Intentions) Location repeated For example: TANGAMBALANGA TRAFFIC THRUSTER ZERO TWO EIGHT SIX ONE TWO MILES SOUTH TANGAMBALANGA / MAINTAINING THREE THOUSAND FIVE HUNDRED OVERFLYING TO THE NORTH TANGAMBALANGA The broadcast indicates the intent to maintain 3500 feet while overflying the area on the way north. Joining circuit call format (Location) TRAFFIC CALL-SIGN JOINING (position in circuit – upwind, crosswind or downwind) (location) (runway) (Intentions) Location repeated For example: TANGAMBALANGA TRAFFIC THRUSTER ZERO TWO EIGHT SIX JOINING DOWNWIND RUNWAY ZERO SEVEN TANGAMBALANGA It is only necessary to state intentions if you are not intending to land and turn off the runway. If you are intending to do a few circuits first then the transmission is: TANGAMBALANGA TRAFFIC THRUSTER ZERO TWO EIGHT SIX JOINING CROSSWIND RUNWAY ZERO SEVEN FOR CIRCUITS (or 'FOR TOUCH-AND-GO' if you don't intend to turn off the runway) TANGAMBALANGA Final approach report format for straight-in approaches The 'final approach' call must be made at not less than 3 nm from the runway threshold. (Location) TRAFFIC CALL-SIGN FINAL APPROACH (runway) Location repeated For example: TANGAMBALANGA TRAFFIC THRUSTER ZERO TWO EIGHT SIX FINAL APPROACH RUNWAY ZERO SEVEN TANGAMBALANGA or TANGAMBALANGA TRAFFIC THRUSTER ZERO TWO EIGHT SIX FINAL APPROACH RUNWAY ZERO SEVEN BACKTRACKING AFTER LANDING TANGAMBALANGA Clear of runway call format This call that you have turned off the runway particularly helps where a rise in the runway obscures the view of an aircraft preparing to take-off. (Location) TRAFFIC CALL-SIGN CLEAR OF RUNWAY (runway number) Location repeated For example: TANGAMBALANGA TRAFFIC THRUSTER ZERO TWO EIGHT SIX CLEAR OF RUNWAY ZERO SEVEN TANGAMBALANGA Turning downwind call format Although not mentioned in AIP the following 'in-circuit' broadcasts may be made if the circuit traffic situation warrants use of any of them. A 'turning downwind' call could be made when starting the turn onto the downwind leg — if the circuit was joined crosswind or if the aircraft is doing touch-and-goes. (Location) TRAFFIC CALL-SIGN TURNING DOWNWIND (runway) Location repeated For example: TANGAMBALANGA TRAFFIC THRUSTER ZERO TWO EIGHT SIX TURNING DOWNWIND RUNWAY ZERO SEVEN TANGAMBALANGA Turning base call format The 'turning base' call should be made when starting the turn onto base, as it provides a more precise location for sighting and a banked aircraft is more visible. (Location) TRAFFIC CALL-SIGN TURNING BASE (runway) Location repeated For example: TANGAMBALANGA TRAFFIC THRUSTER ZERO TWO EIGHT SIX TURNING BASE RUNWAY ZERO SEVEN TANGAMBALANGA If you are doing a right-hand circuit it is advisable to say so in the transmission, for example 'TURNING RIGHT BASE'. Turning final call format The 'turning final' call should be made when starting the turn onto final. (Location) TRAFFIC CALL-SIGN TURNING FINAL (runway)] (Intention) Location repeated For example: TANGAMBALANGA TRAFFIC THRUSTER ZERO TWO EIGHT SIX TURNING FINAL RUNWAY ZERO SEVEN TOUCH-AND-GO TANGAMBALANGA If you are doing circuits then you should add the intention 'TOUCH-AND-GO'; or if this is the last landing of a session of touch-and-go circuits then "FULL STOP' so that any following aircraft doing circuits-and-bumps can make the allowance for runway separation. Broadcast etiquette There are a few unwritten rules that greatly aid understanding by those maintaining a listening watch on the frequency: First ask yourself; "Is this call really necessary?" Mentally compose your message using aviation English (but no jargon), before operating the press-to-talk switch, thus avoiding a transmission containing 'umms' or 'aahs' or long pauses. Transmit once and transmit succinctly! Listen out for a second or two before transmitting so that you don't broadcast over someone else. Ensure you operate the press-to-talk switch before you start speaking; otherwise you are going to cut off the first word or part of it, probably making the broadcast useless to others. This is particularly so because the first word of the transmission is required to be the location. Speak distinctly and at a normal level (speaking loudly will distort the transmission) and at a normal pace (no-one appreciates a clipped, rapid-fire broadcast from the would-be 'hot-shot' pilot); and don't run the words together. Usually the microphone is designed to be squarely in front of the lips and 1–3 cm from them. Ensure the transmission system is of reasonable quality, properly maintained and operated in accordance with the manual. Avoid using superfluous words like 'IS taxiing', 'IS entering' or 'TRACKING for Holbrook' or 'PLEASE' or 'THANKS'. The term 'tracking' is usually only associated with a VOR radial or magnetic track; e.g. TRACKING ZERO TWO ZERO. Don't use non-aviation English phrasing such as '(call-sign) TURNS base' instead of '(call-sign) TURNING base'. Such phrasing is confusing — particularly to students — and may grate on other listeners; consequently the listener may not absorb the information and the broadcast has no value. Avoid confusion and annoyance! Ensure you are not inadvertently transmitting because of a stuck microphone switch. It is very annoying to others, possibly adding to stress and detracts from airfield safety. It can be extremely embarrassing to yourself, and perhaps costly, if you happen to be transmitting the cockpit conversation. Listen carefully to any message being transmitted so that you fully understand it. If you don't understand a transmission ask for a repeat — AIRCRAFT CALLING SAY AGAIN. And remember your own transmission must not include: profane or obscene language deceptive or false information improper use of another call-sign. And do not attempt to avoid landing fees by sneaking in without using the radio. Such actions are stupid but may be criminally reckless. 5.4.4 Discretionary broadcast formats Although radio calls should be kept to a minimum, there are times when traffic circumstances indicate some extra or discretionary calls would be helpful to all in maintaining safe separation; or when you do something unusual such as a go-around or back-tracking after landing. Discretionary calls may be shorter than standard calls. Going around call format If it is necessary to abort the landing and conduct a go-around, a broadcast may be helpful to others. (location) TRAFFIC CALL-SIGN GOING AROUND (runway number) Location repeated For example: TANGAMBALANGA TRAFFIC THRUSTER ZERO TWO EIGHT SIX GOING AROUND / RUNWAY ZERO SEVEN TANGAMBALANGA If the go-around was necessitated by something that may affect other aircraft then add information to the broadcast; e.g. GOING AROUND / RUNWAY ZERO SEVEN OBSTRUCTED BY LIVESTOCK Departure call format If, for example, you had been practising touch-and-goes and are now leaving the circuit it may be helpful to other aircraft to inform them of your intentions to depart the circuit. [location] TRAFFIC CALL-SIGN DEPARTING (runway) (turn) (departure quadrant) Location repeated For example: TANGAMBALANGA TRAFFIC THRUSTER ZERO TWO EIGHT SIX DEPARTING FOR HOLBROOK TANGAMBALANGA There is a possibility that the word 'TO' might, in some circumstances, be confused with the numeral 'TWO' — or the word 'FOR' be confused with the numeral 'FOUR' — so some care is needed when composing a transmission. Requesting information There are occasions when a request for information from other aircraft is appropriate. For example, when approaching an airfield and no traffic has been heard on the airfield frequency but you would like to know what runway is in use — possibly by non-radio aircraft. In this case use the call ANY STATION (location) thus: ANY STATION TANGAMBALANGA THRUSTER ZERO TWO EIGHT SIX REQUEST RUNWAY IN USE TANGAMBALANGA The response from a general aviation aircraft on the ground or in the circuit might be: THRUSTER ZERO TWO EIGHT SIX ALPHA YANKEE CHARLIE TANGAMBALANGA RUNWAY ZERO SEVEN IN USE And the acknowledgment: RUNWAY ZERO SEVEN THRUSTER ZERO TWO EIGHT SIX 5.4.5 Communicating with Unicom or CA/GRS stations When inbound to an airfield with a Unicom or CA/GRS service, an information request might take this form (the Unicom call-sign is generally the location plus 'UNICOM'; the CA/GRS call sign will be location plus 'RADIO'): TANGAMBALANGA UNICOM THRUSTER ZERO TWO EIGHT SIX ONE FIVE MILES SOUTH-EAST INBOUND FOR LANDING REQUEST WIND AND TRAFFIC INFORMATION TANGAMBALANGA The informal response from the ground operator might be: "THRUSTER ZERO TWO EIGHT SIX — TANGAMBALANGA UNICOM — WIND IS ZERO SIX ZERO AT TEN KNOTS — A WARRIOR IS DOING CIRCUITS AND A DASH EIGHT INBOUND FOR A STRAIGHT-IN APPROACH ON ZERO SEVEN" There is no requirement to read back any of the information communicated but without a reply the ground operator is left wondering, so the acknowledgment: ROGER THRUSTER ZERO TWO EIGHT SIX Before taxiing at an airfield with an Unicom or CA/GRS service an information request might take this form: TANGAMBALANGA RADIO THRUSTER ZERO TWO EIGHT SIX REQUEST WIND AND TRAFFIC INFORMATION TANGAMBALANGA The response from the ground operator might be: THRUSTER ZERO TWO EIGHT SIX — TANGAMBALANGA RADIO — WIND IS ZERO FIVE ZERO ABOUT FIVE KNOTS — NO KNOWN TRAFFIC And the acknowledgment: ROGER THRUSTER ZERO TWO EIGHT SIX Thruster 0286 would then make a taxiing broadcast when appropriate. 5.4.6 CTAF response calls The difficulty for an inexperienced pilot is what to do — and say — in response to a broadcast from another aircraft that is perceived as a possible traffic conflict; particularly in an environment when high-speed turbo-prop RPT aircraft are operating. Maintaining situation awareness is a must for all pilots. All pilots must be aware of the positions and intentions of all other traffic in the vicinity, and — to determine possible traffic conflicts — able to project the likely movements of such traffic. This is not easy for anyone, particularly so if insufficient information is being provided. This is aggravated when aircraft are conducting straight-in approaches, so extra vigilance must be maintained, remembering the straight-in approach may be on the longest runway rather than the into-wind runway — or it might even be an 'opposite direction' landing. You must maintain a mental plan of the runways and associated circuit patterns, and overlay that with the current positions and announced intentions of other traffic. You must include the possibility of abnormal events; e.g. where is the missed-approach path for the turboprop aircraft currently on a straight-in approach on the longest runway? And you must keep other traffic informed of your intentions. Caution. When something unexpected happens in the circuit, for example a broadcast from another aircraft indicates you may be on a collision course, then naturally you will swivel around to locate the other aircraft. In these conditions there is a tendency to be distracted from flying the aeroplane — a dangerous position when at low speed and low altitude, particularly so if turning base or final. See 'Don't stall and spin in from a turn'. Although a recreational aircraft may have the right of way in a particular traffic situation, it is environmentally positive, courteous and good airmanship for recreational pilots to allow priority to RPT, agricultural aircraft, firefighting and other emergency aircraft, or for that matter any less-manoeuvrable heavy aircraft. The following is an example transmission from an aircraft on downwind which, after making a downwind broadcast, has monitored a straight-in approach call from an RPT turboprop and is now advising all traffic of the intent to extend its downwind leg and then follow the turboprop in — at a safe interval to avoid wake turbulence. TANGAMBALANGA TRAFFIC THRUSTER ZERO TWO EIGHT SIX EXTENDING DOWNWIND / RUNWAY ZERO SEVEN NUMBER TWO TO SAAB ON STRAIGHT-IN APPROACH TANGAMBALANGA An article — Talk Zone— in the May–June 2001 issue of CASA's Flight Safety Australia discusses CTAF radio procedure problems. Substitute 'CTAF' for the 'MBZ' references in the article. 5.4.7 En route procedures Class G airspace There are no mandatory reports for VFR aircraft operating en route in Class G airspace. Thus after departing the airfield vicinity, such aircraft are only required to maintain a listening watch on the 'appropriate frequency' and announce if in potential conflict with other aircraft — see AIP ENR 1.1 section 44. "ALL STATIONS (location)" instead of "(location) TRAFFIC" may be used for the called stations ID (refer AIP ENR 1.1 para. 68.4); for example: ALL STATIONS MAITLAND AREA THRUSTER ZERO TWO EIGHT SIX REQUEST ADVICE ON THE WEATHER CONDITIONS IN THE VFR LANE TO GLOUCESTER So what's the 'appropriate' frequency? This could be: the local Flight Information Area frequency — if so, calls to the Flight Information Service would be directed to Flightwatch which service is provided by either MELBOURNE CENTRE or BRISBANE CENTRE. If close to a major airport then perhaps (for example) SYDNEY RADAR. Frequency information blocks depicting Class E and G area frequencies, and the frequency boundaries, are included on the ERC-L, VNC and VTC charts. a listening watch could be maintained on the International Distress Frequency 121.5. See 'Can it ever be appropriate to monitor 121.5 MHz en route?'; a listening watch could be maintained on other specific frequencies; if below 3000 feet agl then perhaps listen out on Multicom 126.7 MHz ; when passing in or near the vicinity of a non-controlled aerodrome the designated frequency (otherwise 126.7 MHz or the FIA frequency ) for that airfield should be monitored to gain information on area traffic. Class E airspace As in Class G there are no mandatory reports for VFR aircraft operating en route in Class E airspace. Such aircraft are only required to maintain a listening watch on the 'appropriate frequency' and advise any potential conflict to the aircraft involved or to ATC. The choice of frequency would be much the same as in Class G with the addition of the appropriate ATC frequency. The latter must be used to take advantage of the Radar Information Service usually available in Class E. 5.4.8 Acquiring weather and other information in-flight Airservices Australia's Air Traffic Service [ATS] and the Australian Bureau of Meteorology provide several means of obtaining a limited amount of weather and other information while airborne: AERIS — the Automatic En Route Information Service network ATIS — the Automatic Terminal Information Service at some aerodromes AWIS — the Aerodrome Weather Information Service at some aerodromes. FLIGHTWATCH — the on-request Flight Information Service [FIS] provided by ATS. Further FIS information is contained in AIP GEN 3.3 section 2 and in the Flight Information Services section of ERSA GEN-FIS. AERIS AERIS is a network of 14 VHF transmitters that continually transmit routine weather reports for major Australian airports and a few other significantly sited aerodromes. Such information could be a guide to actual weather at airfields in the vicinity of those major airports. CASA has issued the following pilot guide showing the location of AERIS transmitters, the expected VHF coverage for aircraft at 5000 feet, the VHF frequencies and the aerodromes for which weather reports are available from each transmitter. See AIP GEN 3.3 section 2.8 and AIP GEN 3.5 section 7.4. More information will be found in ERSA GEN-FIS-1. ATIS ATIS is provided on either a discrete COMMS frequency or the audio identification channel (NAV band between 112.0 and 117.975 MHz) of an aerodrome navigational aid — generally in a control zone, but again such information could be a guide to actual weather at other airfields in the vicinity. The availability and frequency of the ATIS is specified in the ERSA airfield data. The continuous information broadcast includes the runway in use, wind direction (degrees magnetic) and speed, visibility, present weather, cloud and QNH. See AIP GEN 3.3 section 2.7. AWIS Australian Bureau of Meteorology automatic weather stations [AWS] are located at about 190 airfields. All the stations are accessible by telephone and about 70 are also accessible by VHF NAV/COMMS radio. The access telephone numbers and the VHF frequencies of the AWS can be found by entering the 'Location information' page and downloading the pdf for the relevant state. The information is also available in the aerodrome facilities section of ERSA and in the ERSA MET section. The AWIS uses pre-recorded spoken words to broadcast the current observations collected by the AWS — surface wind, pressure, air temperature, dew point temperature and rainfall. (For example, call 08 8091 5549 to hear the AWS aerodrome weather at Wilcannia, NSW.) In both the ATIS and AWIS reports, wind direction is given in degrees magnetic. This is because they are associated with aerodrome operations where runway alignments are in degrees magnetic, and conformity makes the crosswind estimate easier. Wind direction in all the text-based meteorological reports and forecasts is given in degrees true. At aerodromes where ceilometer and vismeter sensors are available, the AWIS will report cloud amount, height and visibility but the reliability of such observations is limited — the AWIS broadcasts the aerodrome weather derived from the AWS instrumentation and without any human input. The wind direction is expressed in degrees magnetic to the nearest 10°. Note that some of the VHF frequencies are in the NAV band; i.e. the broadcasts are on the airfield VOR frequency. More information is available in the MET section of ERSA online. Flightwatch Flightwatch is the call-sign of the on-request service — contained within Airservices Australia's FIS — which provides information of an operational nature to aircraft operating in Class G airspace. Whether Flightwatch is able to respond to an information request from an RA-Aus aircraft depends on workload and whether the requested information is readily available to the Flightwatch operator contacted — for example, the actual weather at the smaller airfields. The Flight Information Areas and FIS frequencies are depicted in ERC-L. An information request to Flightwatch should take the following form — note the Flightwatch operator may be managing quite a number of frequencies so the FIA frequency used (for example 119.4 MHz) must be included in the transmission: BRISBANE CENTRE FLIGHTWATCH THRUSTER ZERO TWO EIGHT SIX ONE ONE NINE DECIMAL FOUR REQUEST ACTUAL WEATHER LISMORE Acquiring QNH It is not mandatory for VFR aircraft to use the area QNH whilst en route. You may substitute the current local QNH of any aerodrome within 100 nm of the aircraft. Or, if the local QNH at the departure airfield is not known, you can — while still on the ground — just adjust the sub-scale so that altimeter reads the airfield elevation. Local QNH of airfields within 100 nm of the route might be acquired from AERIS, ATIS or AWIS; otherwise, area QNH can be obtained from Flightwatch: BRISBANE CENTRE FLIGHTWATCH THRUSTER ZERO TWO EIGHT SIX ONE ONE NINE DECIMAL FOUR REQUEST QNH AREA TWO TWO 5.4.9 The Surveillance Information Service [SIS] Transponder-equipped VFR aircraft operating in Class E or Class G airspace within the ATC radar coverage (the tan and green colours in the map approximate the lower level coverage) may request a no-cost radar/ADS-B information service [SIS] on the appropriate ATC frequency. (SIS was formerly known as the Radar Information Service [RIS].) The SIS is available to improve situation awareness by providing traffic information and position information or navigation assistance. VFR pilots may also request an ongoing 'flight following' service from SIS, so that ATC monitor your flight progress and can also help you avoid controlled airspace. The requested service will be provided subject to the controller's current workload — their primary responsibility is towards IFR aircraft — but there is usually no problem, particularly if you have filed a flight plan. Refer to AIP GEN 3.3 section 2.16 for the general procedure and remember that you still must comply with CAR 163A which states: 'Responsibility of flight crew to see and avoid aircraft When weather conditions permit, the flight crew of an aircraft must, regardless of whether an operation is conducted under the Instrument Flight Rules or the Visual Flight Rules, maintain vigilance so as to see, and avoid, other aircraft.' Position information and flight following request call format (Location) CENTRE CALL-SIGN (Altitude) (general vicinity) (destination) REQUEST POSITION INFORMATION AND FLIGHT FOLLOWING It is probably advisable to make a short contact call first then when the 'go ahead' response is received send the message. MELBOURNE CENTRE THRUSTER ZERO TWO EIGHT SIX THREE THOUSAND / VICINITY ROMSEY FOR POINT COOK REQUEST POSITION INFORMATION AND FLIGHT FOLLOWING RIS will ask you to 'squawk ident' and when your aircraft is identified will assign an unique transponder code plus the navigation information. When navigation assistance and flight following is no longer required advise SIS. 5.4.10 Sourcing frequency information The FIS frequencies to be used in Flight Information Areas and the frequencies at airfields (plus NDB and VOR frequencies) are either contained in ERSA or shown on PCA, ERC-L, VNC and VTC charts. The following table summarises the communications information available from those sources. PCA ERC-L VTC VNC ERSA VHF coverage at 5000 feet VHF coverage at 10000 feet HF network sector frequencies SIS frequencies Flightwatch frequencies FIA boundaries FIS frequencies at airfields Airfields where FIS contact possible from ground Airfield Unicom frequencies VOR/NDB frequencies and ID CTAFs STRICT COPYRIGHT JOHN BRANDON AND RECREATIONAL FLYING (.com)
 -
 5.3.1 VHF radio wave propagation Electromagnetic waves travel in straight lines, but the transmission process is modified by interaction with the Earth's surface and by reflection, refraction and diffraction occurring within the atmosphere. The major source of modification of the paths of radio waves is the radiation-related layers within the ionosphere. The process by which the signal (the fixed carrier frequency plus the information) is conveyed between the transmitter and the receiver is propagation. Radio signal energy loss (attenuation) increases with distance travelled through the atmosphere or other materials. Propagation of radio waves within the high frequency [HF] band (the 'short wave' bands between 3 MHz and 30 MHz, with 12 aeronautical sub-bands in the domestic and international HF networks between 2850 and 22 000 kHz) is significantly modified by reflection/refraction within the ionospheric layers — a 'skipping' process that facilitates transmission over very long distances while using low power and small antennas. Propagation in the VHF band (30 MHz to 300 MHz), when using low power and small antennas, is chiefly in the form of a direct path. It is relatively unaffected by reflection, refraction and diffraction within the atmosphere; but is heavily attenuated by the Earth's surface and readily blocked, diffracted or reflected by terrain or structures — as experienced with VHF-band TV reception. Therefore for good reception of a VHF transmission there must be a direct line-of-sight [LOS] path between the transmitter antenna and the receiver antenna. The transmitter radio frequency [RF] output energy must be sufficient that the signal is not overly attenuated over that LOS distance. LOS distance LOS distance between a ground station and an aircraft station, or between two aircraft stations, is limited by the curvature of the Earth's surface, and dependent on the elevation/height of the two stations and the elevation of intervening terrain. The rule-of-thumb is: the maximum direct path distance (the distance to the horizon) between an aircraft and a ground station, in nautical miles, is equal to the square root of the aircraft height, in feet, above the underlying (flat) terrain. Actually it is 1.06 times the square root of the height, but for our purposes that can be ignored. Theoretical LOS distance to horizon Aircraft height (feet) Maximum LOS distance (nm) 10 3.2 100 10 1000 32 5000 70 10 000 100 Estimating the square root: mental calculation is easier if you ignore the two least significant digits of the height, then estimate the square root of the remaining one or two digits and multiply by 10. For example; height 3200 feet, the square root of 32 is between 5 and 6 — say 5.5 — and multiply by 10 = 55 nm LOS distance. Another example; height 700 feet, ignore 00, the square root of 7 is between 2 and three — say 2.6 — multiply by 10 = 26 nm LOS distance. For air-to-air communications the LOS distance is the sum of two 'distance to horizon' calculations; i.e. with one aircraft at 5000 feet the other at 10 000 feet, the maximum LOS distance will be 70 + 100 = 170 nm. It may be a bit more than that because of wave diffraction at the intervening horizon. Intervening mountain terrain may reduce the distance. Be aware that the LOS distance is the theoretical maximum range for direct-path VHF transmission/reception. The actual distance is likely to be a lot less depending on the transmitter/receiver system, the type and placement of the antenna, the quality of the receiver/headset system, and quite a few other considerations. The effective range may be as low as 5 nm or as much as the full LOS distance — but an effective range of 50 nm is probable for a good low-power installation. 5.3.2 Transceiver operation The apparatus that comprises an aircraft station is: an antenna system and feedline coaxial cable a radio transmitter/receiver unit or transceiver with modulating, transmitting, receiving, demodulating and power amplification circuits, plus mounting for the operator controls and displays a speaker/earphones and circuits to convert electromagnetic waves to sound waves a microphone and circuits to convert sound waves to electromagnetic waves the necessary interconnection cables, connectors and matching devices. All the system components must be correctly matched (electrically) to each other and to any separate cockpit intercommunication unit installed in a two-seat aircraft. Transmission Amplitude modulation [AM] of the fixed RF carrier wave, rather than frequency modulation [FM], is used in the aviation band to impress the voice information on the carrier wave generated by the transceiver. AM occupies less bandwidth than FM, consequently the AM channel spacing in the aviation COMMS band is only 25 kHz. When the transceiver is powered up and the pilot speaks into the microphone while depressing a 'press-to-talk' [PTT] button, the transmitter circuits amplify and broadcast, via the antenna system, the selected output frequency — 126.7 MHz for example — modulated with the audio frequencies from the microphone. This may also include the cockpit background noise. The low-fidelity R/T audio frequencies added are in the range 50 Hz to 5000 Hz; much the same as the domestic AM radio broadcast or the public telephone system. The transmission power of handheld transceivers is usually around 1 to 1.5 watts carrier wave. Fixed-installation transceivers are around 4 to 8 watts carrier wave. Some hand-held transceiver suppliers quote the peak envelope power [PEP] output which, for ordinary speech, is probably around three times the carrier wave value. The peak envelope power of an AM signal occurs at the highest crest of the modulated wave. Reception An aircraft antenna continually collects all passing RF energy in the band for which it is designed, which at any time will normally consist of many transmissions. The receiver tunes out all transmissions on all frequencies except one — the selected, or active, frequency. Signals on this frequency are demodulated to isolate the voice information from the carrier, amplify it and pass to the speaker system to convert to the sound waves heard in the earphones or speaker. Setting and changing frequencies The frequencies required are usually entered into a VHF transceiver via an electronic keyboard, concentric rotatable knobs, toggle buttons or a set of thumbwheels. There may be a switch to set channel steps at either 25 kHz or 50 kHz. Most transceivers allow the user to set one frequency into the unit as the active frequency and to set a second frequency as the standby frequency. All transmission and reception is done on the active frequency. Pressing a flip-flop, or similar switch, causes the standby frequency to become the active, and the active to become the standby. Thus, normal procedure prior to take-off is to set the airfield frequency as the active and the flight information area [FIA] frequency as the standby. When departing the airfield area, pressing the flip-flop will make the FIA frequency active for the required listening watch. On return to the airfield area pressing the flip-flop again restores the airfield frequency to active. Generally when selecting, keying or dialling another frequency during flight the new frequency changes the stand-by frequency. Some transceivers have 'dual-monitoring' capability – the ability to listen-in on more than one frequency (e.g. the FIA frequency and an airfield frequency) – but transmit on one frequency only. Features common to most transceivers a number of memory positions (5–50) allows storage of frequently used airfield/FIA and other frequencies an associated fast-scanning function of those stored frequencies instant access to the emergency/distress frequency of 121.5 MHz high and low transmit power settings for hand-held transceivers, giving a choice of minimum battery drain or maximum range hand-held transceivers are usually supplied with adapter(s) to connect the unit to the aircraft's COMMS (and NAV) antenna(s) hand-helds usually have key locking facilities to prevent inadvertent frequency changes or transmissions hand-helds may also provide access to the 200 channels in the NAV band between 108.00 and 117.975 MHz, which gives a limited VOR capability if the transceiver can be adapted to a NAV dipole antenna. The main advantage provided by this facility is access to any ATIS or AWIS frequencies between 112.1 and 117.975 MHz. Headsets The cockpits of powered recreational and sport aircraft are notoriously noisy and those close to a high rpm two-stroke engine are the worst. Propeller tip speeds may approach mach 0.8 and generate noise at fairly high frequencies while the engine produces noise in the low to middle frequencies. External airflow noise may or may not be significant depending on the existence and effectiveness of cockpit sealing. In all, the cockpit noise level may approach 100 dB and long-term exposure to noise above 90 dB will damage hearing. Also, noise and vibration add to pilot fatigue and the low-frequency engine noises below 300 Hz are particularly fatiguing. Consequently all pilots must wear some form of hearing protection — which may be incorporated within a good quality protective helmet. Headsets serve a dual purpose in providing hearing protection whilst improving communications. The basic headset consists of two earphones with some physical sound sealing capability plus a directional microphone mounted on an adjustable boom, so that it can be positioned within 1–3 cm in front of — and square on to — the pilot's lips when transmitting. The headset cables are jacked into the transceiver input/output sockets or patched via a cockpit intercom unit. Standard headsets may not be able to be used with hand-held transceivers without an adapter device. Additional facilities — such as individual volume control on each earphone with an electronic noise reduction system and cockpit noise cancelling microphones — are available. You can get headsets specifically designed for two-stroke engine noise reduction. Normal headsets rely solely on passive noise reduction — creating a physical barrier around the ear to attenuate noise — which usually works quite well for middle to high-frequency sound but doesn't block low-frequency engine noise and background rumble. Active noise reduction technology uses electronics to determine the amount of low-frequency (50–600 Hz) engine and other noise entering the system and then generating out-of-phase noise, in the same frequency range; this counters the background noise and leaves a soft 'white' noise in the headphones. But the technology doesn't significantly affect the higher-frequency noise. Using the squelch control All transceivers have some form of ON/OFF/TEST/VOLUME control. As aircraft cockpits are very noisy, the output volume control must be set fairly high. This of course amplifies the weak atmospheric background radio frequency noise — the hash — which is always there when no strong transmissions are being heard on the active frequency; this hash can be quite annoying. The 'squelch' or 'gain' or 'RF gain' or 'sensitivity' control is an adjustable filtering device which, for operator comfort, can be set just to filter out the hash but still allow any strong signals to be switched through. The squelch control should only be switched on and adjusted when contact with the active frequency has been established, volume set and headset connection checked. Otherwise, when the signal is weak, there is a high risk of also filtering out the active frequency transmissions which, in effect, turns the receiver off. Some transceivers have an automatic gain control. In which case, pressing the test facility will override the squelch, allowing the background hash to be heard. 5.3.3 Wave length and antennas It is stated in the electromagnetic spectrum section that the frequency in MHz = 300/wavelength in metres — or restated, the wavelength in metres = 300/MHz. Thus the wavelengths involved in the aviation VHF COMMS band, 118.00 to 136.975 MHz, are from 2.54 metres to 2.19 metres and the mid-point is about 2.37 metres. The Multicom frequency — 126.7 MHz — has a wavelength of 300/126.7 = 2.37 metres. Wavelength is important as the efficiency of the antenna (a passive electrical conductor that radiates the signal energy when transmitting, or collects signal energy when receiving) partly depends on its length relative to the frequency wavelength. Most ineffective radio installations are because of ineffective antenna installations and/or RF interference generated by the engine ignition system or the aircraft's electrical components. Dipole antennas Aircraft COMMS antennas are usually dipoles or monopoles. A dipole is an antenna that is divided into two halves insulated from each other. Each half is connected to a feedline (coaxial cable and RF BNC series bayonet connectors) at the inner end, which routes the RF energy between the antenna and the transceiver. The length of each half is about 5% less than the mid-point quarter-wave — usually about 56 cm, or 22 inches. (The mid-point quarter-wave is 2.37/4 =59 cm.) Rather than being set out end-to-end horizontally, each half is canted up about 22.5° to form an internal angle of around 135°, which prevents a deep "null" zone off both ends. NAV or COMMS dipoles may be mounted within the fuselage if the aircraft is not metal-skinned or metal-framed. A NAV antenna must be horizontally polarised; i.e. mounted horizontally. The two halves of a COMMS dipole antenna can be end-to-end vertically mounted with a centre feedline and built into the fin of a fibre-reinforced composite aircraft — but not if it is carbon fibre. Similarly a half-wave dipole antenna might be used on a trike where the longer length can be mounted vertically end-to-end and strapped to the king-post. The telescopic 'rabbit's ears' antennas used with the old black and white TVs were dipoles — as channels (frequencies) were changed the length was adjusted to maintain the half-wavelength dimension. Monopole or whip antennas The most common recreational aircraft COMMS antenna — the monopole — is just one half of a dipole; i.e. quarter-wavelength. (To calculate antenna quarter-wavelength in centimetres, divide 7130 by the frequency; i.e. 7130/126.7 = 56 cm.) Thus the monopole is usually about 56 cm long, mounted vertically (vertically polarised) — normally on the top of the fuselage (away from the undercarriage legs) — with the feedline conductor to/from the transceiver connected to the bottom end of the antenna. The 56 cm length should provide very good mid-frequency reception and reasonable reception at the lower and upper ends of the COMMS band and, usually, increasing the thickness of the antenna element increases its effectiveness. The antenna element may be enclosed within a streamlined fibreglass fairing to add structural strength. To replace the other half of the dipole a conductor system is placed just below the antenna to serve as an earth ground — a ground plane, ground screen or at least four ground radial strips or rods, connected to the coax cable shielding. The radius of the ground equals the length of the antenna; i.e. 56 cm. In a metal-skinned aircraft the fuselage acts as a ground plane, which is electrically insulated from the antenna by a very small gap. The photo shows the ground plane, in Leo Powning's Jodel project, mounted under the ply turtle deck (looking aft). The centre plate and four 25 mm wide radials are cut from light gauge aluminium sheet sold in hardware stores. Total dimension from the antenna socket to the end of each radial is 57 cm — about the mid-point of the COMMS band. The sloped radials provide an antenna impedance of approximately 50 ohms. The 50 ohms coax connecting the antenna is attached to the turtle deck formers with plastic P clips. Transmission/reception pattern Because of antenna characteristics and airframe shielding, the radiation/reception pattern of the antenna will be weaker in some directions and may even exhibit null zones. The easiest way to check this is to tune in the continuous broadcast — at a reasonable (say 30 nm) distance — from a known ATIS, AWIS or AERIS location, then circle while listening to the signal strength. A few turns should be sufficient to plot the directions, relative to the aircraft's longitudinal axis, from which signal strength weakens and/or reduces to nil. Because the attitude of the aircraft also affects transmission/reception, it is advisable to first fly non-banked turns to ascertain the normal pattern then fly banked turns to check the consequent effects. Impedance matching All VHF transceivers are designed for a standard load (impedance) of 50 ohms. Ideally the coaxial cable, BNC connectors and antenna match that 50 ohm impedance all the way; then all the transmission power sent to the antenna will be radiated as RF energy. However, the resonant frequency of any antenna will match only one frequency, and the COMMS operational frequencies range over 19 MHz. So for most transmission frequencies the antenna will exhibit positive or negative reactance (or impedance), which results in the phenomenon known as 'stationary' or 'standing' waves in the feed line and reduces the output of the antenna. Also the incoming signals will be weaker. The RF performance of the antenna system is expressed in terms of the voltage standing wave ratio [SWR or VSWR]. A perfect (but most unlikely) antenna system would have a SWR of 1:1 but generally a SWR less than 2:1 results in quite acceptable performance and limits transceiver overheating. The Microair 760 — described in the next module — requires a SWR between 1.3:1 and 1.5:1. If the transmission performance is okay then the reception performance should also be okay. STRICT COPYRIGHT JOHN BRANDON AND RECREATIONAL FLYING (.com)
 -
 5.2.1 Radiotelephony pronunciation (AIP GEN 3.4 section 4) A phonetic alphabet is used in radiotelephony [R/T] communications when transmission of individual letters is required. This phonetic alphabet was originally developed by the North Atlantic Treaty Organisation as an international alphabet for use by the armed forces of the NATO nations. Letters Phonetic Pronunciation Phonetic Pronunciation A ALFA AL fah B BRAVO BRAH voh C CHARLIE CHAR lee D DELTA DELL tah E ECHO ECK ho F FOXTROT FOKS trot G GOLF GOLF H HOTEL hoh TELL I INDIA IN dee A J JULIETT JEW lee ETT K KILO KEY loh L LIMA LEE mah M MIKE MIKE N NOVEMBER no VEM ber O OSCAR OSS cah P PAPA pah PAH Q QUEBEC keh BECK R ROMEO ROW me oh S SIERRA see AIR rah T TANGO TANG go U UNIFORM YOU nee form V VICTOR VIK tah W WHISKY WISS key X X-RAY ECKS ray Y YANKEE YANG key Z ZULU ZOO loo Numbers The R/T pronunciation of numbers should be the following phonetic form: 0 ZE–RO 5 FIFE 1 WUN 6 SIX 2 TOO 7 SEV en 3 TREE 8 AIT 4 FOW er 9 NIN er Hundred HUN dred Thousand TOU SAND Decimal DAY SEE MAL Expressing numbers All numbers used in the transmission of altitude, cloud height and visibility information — that contain whole hundreds and whole thousands — must be transmitted by pronouncing each digit in the number of hundreds or thousands followed by the word HUNDRED or THOUSAND as appropriate, but without the suffix 'feet'; e.g.: ALTITUDE: (800 feet) – "EIGHT HUNDRED" (1500 feet) – "ONE THOUSAND FIVE HUNDRED" (4750 feet) – "FOUR SEVEN FIVE ZERO" (10 000 feet) – "ONE ZERO THOUSAND" CLOUD HEIGHT: (2200 feet )– "TWO THOUSAND TWO HUNDRED" (4300 feet) – "FOUR THOUSAND THREE HUNDRED" VISIBILITY: (1500 feet) – "ONE THOUSAND FIVE HUNDRED" (3000 feet) – "THREE THOUSAND" All other numbers, except VHF frequencies, must be transmitted by pronouncing each digit separately; e.g.: HEADING (the words 'degrees' and 'magnetic' are not transmitted): (150° M) – "ONE FIVE ZERO" (080° M) – "ZERO EIGHT ZERO" (305° M) – "THREE ZERO FIVE" WIND DIRECTION (the word 'degrees' is transmitted): (020°) – "ZERO TWO ZERO DEGREES" (100°) – "ONE ZERO ZERO DEGREES" (210°) – "TWO ONE ZERO DEGREES" WIND SPEED: (10 knots) – "ONE ZERO KNOTS" (15 knots, gusting to 25) – "ONE FIVE KNOTS GUSTING TWO FIVE" ALTIMETER SETTING – QNH: (995 hPa) – "NINE NINE FIVE" (1010 hPa) – "ONE ZERO ONE ZERO" (1027 hPa) – "ONE ZERO TWO SEVEN" VHF frequencies are a bit unusual because 25 kHz spacing is gradually being introduced in Australia as frequency congestion becomes apparent. However, currently only 50 kHz spacing operates in Class G airspace. If the frequency is a 50 kHz multiple then all significant digits are transmitted including the first zero after the decimal point: (122.0) – "ONE TWO TWO DECIMAL ZERO" (122.15) – "ONE TWO TWO DECIMAL ONE FIVE" (126.05) – "ONE TWO SIX DECIMAL ZERO FIVE" (126.7) – "ONE TWO SIX DECIMAL SEVEN" If the frequency is a 25 kHz multiple (i.e. the second and third digits after the decimal point are 25 or 75) then the sixth digit is inferred as 'FIVE' and not transmitted: (122.025) – "ONE TWO TWO DECIMAL ZERO TWO" (122.525) – "ONE TWO TWO DECIMAL FIVE TWO' (122.075) – "ONE TWO TWO DECIMAL ZERO SEVEN" (122.675) – "ONE TWO TWO DECIMAL SIX SEVEN" 5.2.2 Expressing time (AIP GEN 3.4) The 24-hour clock system is used in R/T transmissions. The hour is indicated by the first two figures and the minutes by the last two figures, e.g.: (0001 hrs) – "ZERO ZERO ZERO ONE" (1920 hrs) – "ONE NINE TWO ZERO". Time may be stated in minutes only (two figures) in R/T communications when no misunderstanding is likely to occur. Current time in use at a station is stated to the nearest minute in order that pilots may use this information for time checks. Australian civil aviation uses Coordinated Universal Time [UTC] for all operations. The suffix 'Zulu' is appended when procedures require a reference to UTC, e.g.: (0920 UTC or 0920Z) – "ZERO NINE TWO ZERO ZULU" (0115 UTC or 0115Z) – "ZERO ONE ONE FIVE ZULU". To convert from Australian Standard Time to UTC: Eastern Standard Time subtract 10 hours Central Standard Time subtract 9.5 hours Western Standard time subtract 8 hours. 5.2.3 Standard words and phrases (AIP GEN 3.4) The following words and phrases are to be used in radiotelephony communications, as appropriate, and have the meaning given: ACKNOWLEDGE Let me know that you have received and understood this message. AFFIRM Yes. APPROVED Permission for proposed action granted. BREAK I hereby indicate the separation between portions of the message (to be used where there is no clear distinction between the text and other portions of the message). CANCEL Annul the previously transmitted clearance. CHECK Examine a system or procedure (no answer is normally expected). CLEARED Authorised to proceed under the conditions specified. CONFIRM Have I correctly received the following ... ? or Did you correctly receive this message ... ? CONTACT Establish radio contact with ... CORRECT That is correct. CORRECTION An error has been made in this transmission (or message indicated) the correct version is ... DISREGARD Consider that transmission as not sent. HOW DO YOU READ What is the readability (i.e. clarity and strength) of my transmission? See 'clarity of transmission'. I SAY AGAIN I repeat for clarity or emphasis. MAINTAIN Continue in accordance with the condition(s) specified or in its literal sense, e.g. "Maintain VFR". MAYDAY My aircraft and its occupants are threatened by grave and imminent danger and/or I require immediate assistance. MONITOR Listen out on (frequency). NEGATIVE "No" or "Permission is not granted" or "That is not correct". OVER My transmission is ended and I expect a response from you ( not normally used in VHF communication). OUT My transmission is ended and I expect no response from you ( not normally used in VHF communication). PAN PAN I have an urgent message to transmit concerning the safety of my aircraft or other vehicle or of some person on board or within sight but I do not require immediate assistance. READ BACK Repeat all, or the specified part, of this message back to me exactly as received. REPORT Pass me the following information. REQUEST I should like to know or I wish to obtain. ROGER I have received all of your last transmission (Under NO circumstances to be used in reply to a question requiring READ BACK or a direct answer in the affirmative or negative. Do not use the term 'COPY THAT' or double click the transmit button.) SAY AGAIN Repeat all or the following part of your last transmission SPEAK SLOWER Reduce your rate of speech. STANDBY Wait and I will call you. VERIFY Check and confirm with originator. WILCO I understand your message and will comply with it. (Do not use the term 'COPY THAT' or double click the transmit button.) Clarity of transmission The response to the query 'HOW DO YOU READ?' or 'REQUEST RADIO CHECK' is phrased in accordance with the following readability scale: Unreadable Readable now and then Readable but with difficulty Readable Perfectly readable. Phraseologies The phraseologies to be used in communications between ATS and pilots in various circumstances are detailed in AIP GEN 3.4 section 5. STRICT COPYRIGHT JOHN BRANDON AND RECREATIONAL FLYING (.com)
 -
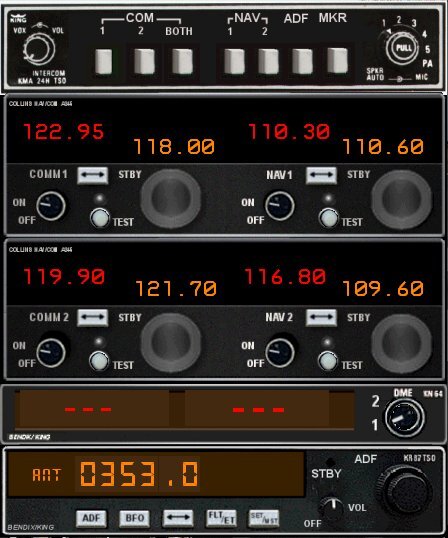 5.1.1 The aircraft station and aeronautical mobile station class licence All operational radio transmitters are required to be licensed by the Australian Communications and Media Authority [ACMA]. To avoid the need to license individual VHF and HF aviation radiotelephony transceivers (and other transmitters carried in aircraft such as transponders or radio distress beacons) the ACMA issues a class licence. The current Radiocommunications (Aircraft and Aeronautical Mobile Stations) Class Licence 2006 [CL2006] replaced the Radiocommunications (Aircraft Station) Class Licence 2001. CL2006 authorises the operation — by qualified operators — of a range of aeronautical radiocommunications and radionavigation equipment fixed to, or carried on board, all aircraft including recreational aircraft. It also authorises most ground-based aeronautical mobile radiocommunications equipment operating on the common group of aviation frequencies. An aircraft station may only be operated (i.e. transmitting) when it is on board an aircraft, thus you cannot operate your hand-held transceiver as an aircraft station unless you are in an aircraft and identify yourself with that aircraft's station call sign. If any condition of CL2006 is breached (for example, transmitting on a frequency not encompassed by the class licence) the operator is no longer authorised to operate under the class licence. In this instance, the operator would be liable for prosecution by the ACMA. An aeronautical mobile station (and an aircraft station) may only be used for communications that relate to: the safe and expeditious conduct of a flight an emergency a matter that relates to the particular occupation or industry in which the aircraft to which the aircraft station relates is engaged; or the aeronautical mobile station is engaged. Typically a flight instructor on the ground with a hand-held transceiver supervising a student in the circuit is operating as an aeronautical mobile station. The same might apply to a person advising traffic conditions at a fly-in. The operator of an aeronautical mobile station must use a form of identification that clearly identifies the mobile station. Equipment standards Various equipment compliance requirements, specifications and mandatory technical standards apply to radiotelephony equipment intended to equip an aircraft station under the class licence. If it is a fixed installation only Civil Aviation Safety Authority [CASA] approved apparatus may be used; refer to AIP GEN 1.5 para 1.1. An ACMA approved and licensed hand-held (or demountable) VHF aviation band radiotelephone may be used by pilots of recreational aircraft operating in Class G airspace, provided that the equipment is able to be operated without adversely affecting the safety of the aircraft. Refer to AIP GEN 1.5 para 1.5. Recreational aircraft operating in Class E airspace must be equipped with a serviceable VHF communications system. The AIP Book is perhaps at variance with the CARs and CAOs so it is not absolutely clear that ACMA approved hand-held units are acceptable in Class E or other controlled airspace. The standard for hand-held equipment performance is that set out in the Australia/New Zealand Standard 4583:1999 (and later). Aircraft station identification All transmitters are required to have an individual identification or call-sign that clearly identifies the station. The call-sign for recreational and sport aircraft registered with CASA is generally the last three characters of the registration marking. The mandatory call-sign for RA-Aus registered aircraft is the aircraft type followed by the four-digit RA-Aus registration number, for example "Thruster zero two eight six". The call-signs (where 'a' represents an alphabetic character and 'n' a numeric character) for recreational aircraft are: Recreational aircraft type Call-sign format RA-Aus (all groups) (aircraft type)nnnn Trikes (HGFA registered) TRnnn or TCnnn Hang Gliders HGnnnn Paragliders HGnnnn Gyroplanes Gnnn and Gnnnn Sailplanes (VH-) aaa Balloons (VH-) aaa General aviation (VH-) aaa Aeronautical stations The backbone high frequency [HF] and very high frequency [VHF] civil aviation radiotelephone communications network is owned and operated by Airservices Australia. In addition, regular public transport companies have their own communications networks. Similarly other 'fixed' ground stations could be licensed by ACMA for operation in the aviation VHF band by aero clubs, flying schools and parachute clubs; or by other organisations providing an aerodrome Unicom service. In the regulations such fixed ground stations are called aeronautical stations. However, aero clubs, flying schools and parachute clubs are more likely to operate as 'aeronautical mobile stations'. The military aviation network utilises ultra high frequency [UHF] at military airfields. Radio frequency symbols Radio frequencies are described in terms of hertz or 'cycles per second'. The symbols used in the aviation bands are kHz (thousand cycles per second e.g. 2850 kHz) in the HF band and MHz (million cycles per second, e.g. 126.7 MHz) in the VHF and UHF bands. 5.1.2 Communication limitations Communications between aircraft stations; and between aircraft stations, aeronautical stations and aeronautical mobile stations. A person may operate an aircraft station to communicate with another aircraft station, aeronautical station or aeronautical mobile station only if the communication relates to: the safe and expeditious conduct of flight an emergency a matter that relates to the particular occupation or industry in which the aircraft, to which the aircraft station relates, is engaged proper call-signs must be used. Communications between aeronautical mobile stations and aircraft stations. A person who is a member of an aero club, flying school or parachute club may operate an aeronautical mobile station to communicate with an aircraft station for the particular activity only if: the aeronautical mobile station is owned and operated by an aero club, flying school or parachute club; and the communication occurs when the aircraft to which the aircraft mobile station relates is engaged on a flight to or from the aerodrome at which the aeronautical mobile station is located. Unauthorised communications From the above, it is evident that an aircraft station may not transmit private or personal messages; i.e. information not pertaining to operational requirements. Nor can an unallocated frequency within the aviation VHF band be used for communications. In addition, all transmissions must be in the English language, use standard phraseology and a phonetic alphabet, and may not include: profane or obscene language deceptive or false information improper use of another call-sign. Secrecy of communications CL2006 holders are legally bound not to divulge, without authority, the content of any radiotelephony message sent or received. 5.1.3 Aircraft station operating frequencies Airservices Australia is nominated by the ACMA to approve all frequency assignments made in the aviation bands. Radiocommunications with Airservices Australia's air traffic services [ATS] are chiefly conducted in the aviation VHF communications [COM or COMMS] band, 117.975 to 136.975 MHz where, at 0.025 MHz (25 kHz) steps, there are 760 channels possible. Currently, channel separation in the Australian aviation band, except in Class A airspace, is generally at 0.1 MHz (100 kHz) or 0.05 MHz (50 kHz) spacing. However 25 kHz channel frequencies may be allocated for Class C, D and E airspace, along with rules for frequency stability standards to reduce inter-channel interference. (If a current receiver/transmitter displays frequencies with three decimal places it is likely to meet stability standards; for more information read 'Channel squeeze update' in the May – June 2009 issue of Flight Safety Australia.) There is a dedicated aviation VHF band from 108.1 to 117.975 MHz for operation of navigation facilities, such as VOR systems. This is the 'NAV band' while the full aviation VHF band from 108.00 to 136.975 MHz is the 'NAV/COM band'. Some specific aviation operational frequencies are: Aero club operations — 119.1 MHz Flying school operations — 119.1 MHz Fire spotting — 119.1 MHz Parachute club operations — 119.2 MHz Aviation sport — 120.85 MHz Emergency location — 121.5 MHz (plus 243.0 and 406.025 in the UHF band) Glider/sailplane operation — 122.5, 122.7, 122.9 MHz Fishing or agricultural operations or stock mustering — 122.8 MHz Pilot-to-pilot communications — 123.45 MHz Traffic information aircraft broadcasts — 126.35 MHz Aircraft industry testing — 129.1 MHz Crop dusting — 129.6 MHz Aerodrome operator, including refueller — 129.9 MHz Air show — 127.9 MHz Charter and other purposes not listed — 126.4, 128.9, 135.55 MHz Search and rescue only — 121.5, 123.1, 123.2 MHz (plus the 156.3, 156.8 MHz marine band frequencies) Inter-pilot air-to-air communication frequencies at airfields Within Class G airspace are some areas, surrounding all reasonably active airfields where, to maintain safe separation, pilots are required to exercise particular monitoring and reporting procedures between each other; and to self-administer movement priorities where appropriate. These are common traffic advisory frequency [CTAF] areas, and the VHF frequency to be used at particular CTAFs is specified in ERSA and VNC, VTC, PCA and ERC-L charts. Some CTAF airfields may have a private ground-based 'Unicom' information service, the operating frequency of which is the same as the airfield VHF frequency specified in ERSA. For further information on operations at, or in the vicinity of, airfields in Class G airspace see Radiotelephony communications and procedures in Class G airspace. Inter-pilot air-to-air communication frequencies en route Interpilot air-to-air communications can be conducted on frequency 123.45 MHz. When aircraft are operating in remote areas out of range of VHF ground stations, then 123.45 MHz is the regional air-to-air channel. Communications between aircraft on 123.45 MHz are restricted to the exchange of information relating to aircraft operations and only the proper call-signs may be used. 5.1.4 Radio operator qualification Operators of aircraft stations must be qualified in accordance with the requirements of the CL2006, which states: A person may operate an aircraft station or an aeronautical mobile station only if the person is qualified to operate the station in accordance with the Civil Aviation Regulations and the relevant Civil Aviation Orders. The Chief Flying Instructor of an approved flight training facility may recommend issue of the radio operator's endorsement after evaluation of the applicant's demonstrated performance during flight operations and in an oral or written examination. The examination will cover the syllabus listed in the RAAOs manuals. For example see the RA-Aus Operations Manual section 3.08. STRICT COPYRIGHT JOHN BRANDON AND RECREATIONAL FLYING (.com)
 -
Checking out a HARVESTER FIRE!! Afternoon Flight VLOG
Admin commented on Admin's video in General Aviation
 Yep, Tomo use to be an active person on this site. I remember when he got engaged and we followed his endeavors up in PNG etc
 -
Another assumption I made is that with what you are saying in the thread "has recreational aviation collapsed" in that the sector is doing a roaring business still with flying schools flat out then why doesn't this site get new registered users? Years ago we use to get many each week and now lucky to get 1 a week. The site is bigger and better than it ever was and moderation is not really needed any more. Is the name not of interest to all these people, people who must be doing Google searches on various recreational aviation things, is the name Aircraft Pilots more their thing now with flying these plastic fantastics and they call themselves "a Pilot"? if the industry is in better shape than it ever was than has this site kept up with the changes in the mindset of the recreational pilot. Just a thought brought about by that other thread!
-
-
Thanks @yampy my assumption is that commercial pilots i.e. Airline pilots, would not bother with a site like this, the old Ultralight industry has moved to plastic fantastics (pseudo GA) and that combined with the PPL "recreational" numbers combined would far outweigh that of commercial also providing a barrier to Airline Pilots. But, on the bright side is those few Airline Pilots that still get the buzz from flying GA may come on here not to talk about Airlines but to talk about fun flying which could also help with valuable input to discussions for everyone...Look at @facthunter as an example That was my line of thought, perhaps it is wrong or just simply naive, definitely worth a discussion
-
Hi all, lately I have been thinking about the site's audience and the site name has come to mind. The site has a lot to offer and not just to the sport aircraft segment of aviation. Whilst the term Recreational also refers to PPL etc, many recreational pilots still consider the site to be targeted to just the old "Ultralight" fraternity and not all other forms of recreational flying. Funny as when the site first started it was called Ultralight.com.au and after a while the times changed and the site was renamed to Recreational Flying. But again I see myself thinking that times have changed and to be more appealing, not only to Google search, but to the greater aviation community that the site name be changed to Aircraft Pilots (.com). This I believe would cover ALL segments of "Recreational" including PPL. Yes I know the site's name of Recreational Flying has a known brand however this may well be both a positive and negative. Do you have any strong objections to renaming the site to Aircraft Pilots (.com)...your input is important
-
 It started as a dream to link outback towns by air and grew into a global icon, flying more than 50 million passengers a year around the world. Over the past century, the legacy of Qantas has grown to become much more than an airline — the flying kangaroo is now a globally recognised brand. Today, 16th November 2020, 100 years since the airline was founded in western Queensland, a good-natured outback rivalry over the story of the airline's formation shows no signs of losing breath, as three towns lay claim to being the birthplace of Qantas. Longreach, Cloncurry and Winton — located in the state's remote outback — each say they are the true home of the national carrier. "It's a very proud western Queensland story that couldn't have happened anywhere else," said Jeff Close, an amateur historian from the town of Winton, 1,300 kilometres north-west of Brisbane. Jeff Close is so passionate about Winton's role in the Qantas story, he wrote a play about the airline for its 90th anniversary in 2010.(ABC Southern Queensland: Nathan Morris) Dream springs from Cloncurry riverbed A century ago, on November 16, 1920, Queensland and Northern Territory Aerial Services Limited was registered. Its co-founders, Sir Hudson Fysh and Paul McGinness, had wanted to establish an airline to alleviate the tyranny of distance facing residents living in Australia's outback. Sir Hudson Fysh (left) and Paul McGinness (right) wanted to create an airline to connect outback towns.(Supplied: Qantas Founders Museum) "We go with what Sir Hudson Fysh himself said," Mr Close said. "[Qantas] was conceived in Cloncurry, born in Winton and grew up in Longreach." In 1919, then prime minister Billy Hughes announced a prize of 10,000 British pounds for a Great Air Race for Australians who wanted to fly home from Great Britain after World War I. Fysh and McGinness were tasked with surveying possible aircraft landing strips across western Queensland and the Northern Territory. As they travelled over rough terrain from Longreach to Darwin in a Ford Model T, at an average speed of 25 kilometres per day, the pair hatched a plan to establish an air service connecting remote communities. Paul McGinness (centre) and Sir Hudson Fysh (right) were in outback Queensland preparing for the Great Air Race in 1919 when they devised a plan to establish an airline.(Supplied: Qantas Founders Museum) But according to Hamish Griffin, a Cloncurry resident and advocate for cheaper regional airfares, it was in the dry riverbed of the Cloncurry River that the idea really gained traction. "If people really, really do a deep dive into the story of how it came about, they would really know that Cloncurry was definitely the founding place of Qantas," Mr Griffin said. In December 1919, McGinness came to the aid of a wealthy grazier whose car had broken down in the riverbed. They formed a friendship and the grazier, Fergus McMaster, agreed to financially back the plans for an airline. It was in the near-dry riverbed of the Cloncurry River that Qantas co-founder Paul McGinness met grazier Fergus McMaster, who went on to financially back the airline.(Supplied: Qantas Founders Museum) Early moneymen hail from Winton But Mr Close says it was 347 kilometres away in Winton, to the south-east of Cloncurry, that Qantas really took flight. "Winton really is and was the mover and shaker as … the early money mainly came from Winton," Mr Close said. He said five of the company's eight original shareholders were from Winton. The Winton Club, site of the airline's first board meeting in 1921.(ABC Western Queensland: Ellie Grounds) The Winton Club is filled with Qantas memorabilia.(ABC Western Queensland: Ellie Grounds) "They put the money up and got it going," Mr Close said. "They had the drive, the expertise, the youth, the exuberance, the need … Winton was just in the right place at the right time." The airline's first board meeting was held at the Winton Club on February 10, 1921. The club is still there today, proudly displaying the company's original articles of association, which list Winton as the airline's headquarters. Mr Close feels so strongly about Winton's role in the airline's story, he wrote a play about Qantas and performed it at the Winton Club on the airline's 90th anniversary. Next year he plans on putting on another play, to recreate the first board meeting in the room it took place in a century earlier. Longreach becomes airline's home A decision was made at that meeting to move operations to Longreach, for logistical reasons. The town is now home to the Qantas Founders Museum, where visitors can tour significant aircraft including the Super Constellation, the first pressurised plane, and the first jet aircraft the airline owned — the Boeing 707-138 VH-EBA, named "City of Canberra". A DH-50 fuselage under construction in the Longreach hangar circa 1926.(Supplied: Qantas Founders Museum) "Longreach had the rail head, the major services came into Longreach, the railway stopped here," said Tony Martin, the museum's CEO. "It made sense for Longreach to be the hub to start the airline." The hangar built in 1922 to house the planes is now a national heritage-listed site. It's the oldest civil aviation building in Australia. "It's the place where the airline began its operations," Mr Martin said. "[Qantas is] one of the only airlines in the world to build their own aircraft, and they did it here in Longreach. Qantas built seven DH-50 planes in the Longreach hangar from 1926 to 1929.(ABC Western Queensland: Ellie Grounds) Qantas is 'Vegemite, thongs … it's home' A century on, the residents of Cloncurry, Winton and Longreach still like to wind each other up about which town can really claim to be the birthplace of Qantas. Mr Griffin said that because the museum was located in Longreach, it could be "forgiven" for portraying itself as the birthplace of the airline. But he said, with a wry smile, the record needed to be set straight. "It's our time to shine. Cloncurry —we're the place." The Qantas Founders Museum in Longreach is home to some of the airline's most iconic planes.(ABC Western Queensland: Ellie Grounds) Mr Close said the three towns squabbled over the airline's history like siblings. "Like kids in a family we can all have our scraps, but in the end we are united very much by our pride in Qantas," he said. With a grin, Mr Martin admitted he could be guilty of stoking the "great friendly rivalry" between the towns. "If I could say to our neighbouring towns, I guess Longreach, like Qantas, had the vision to tell the story here," he said. Tony Martin admires the four-passenger De Havilland DH-50, the first purpose-designed airliner used by Qantas.(ABC Western Queensland: Ellie Grounds) But, all jokes aside, he said the airline's 100th anniversary was a chance to celebrate one of western Queensland's greatest exports. "For us to be part of a story that's 100 years old, and is such a global story...," he said. "Qantas, it's Vegemite, it's thongs, it's koala bears, it's up there with that branding. It's home."
 -
The Recreational Flying Classifieds are back and they are FREE for you to list anything that you have for sale. Do you have an aircraft you wish to sell or some aircraft parts, pilot equipment or anything in aviation that you no longer need, well convert it to cash through the Classifieds System here on Recreational Flying, IT'S FREE TO LIST YOUR ITEM, or you can select the Featured option for only $10 which goes towards the cost of running the site.
-
Funny you should mention that...I am working on an alternative right at this moment

-
Granted we have been in a pandemic this year however has the writing been on the wall for recreational aviation for some time now and the pandemic has just been another nail in the coffin? Years ago we had many different aircraft avialable to buy and now there is only a handful of distributors and those are mostly plastic fantastics. The number of flying schools seems to have decreased and the costs have dramatically increased. Has this all come about since RAAus became a business and thus the demise of the Association of members, the social aspects of recreational aviation. Or, is it thriving and the pandemic has allowed it to thrive in bubbles ready to break back out. What do you think...is recreational aviation declining or thriving and if so why?
-
Post here in this thread which airstrip you have flown into that you have found to be the most difficult or challenging? Note the new Google Earth Airfields tool in the Resources Section that we now have here at Recreational Flying
-
 4.15.1 References CASR 91.225 - Safety during take-off and landing [not yet enabled July 2012] CASR 91.180 - Precautions before flight [not yet enabled July 2012] 4.15.2 Purpose This Advisory Circular (AC) provides general information and advice to enhance the safety of taking off or landing at any place, with emphasis on unlicensed aerodromes. It is intended to give an overview of pilot responsibilities and highlight principles applicable to the operations of smaller aeroplanes, including those not fully supported by manufacturer's take-off and landing performance data. 4.15.3 Status of this AC This AC is the first that has been issued on this subject. Advisory Circulars are intended to provide recommendations and guidance to illustrate a means but not necessarily the only means of complying with the Regulations, or to explain certain regulatory requirements by providing interpretative and explanatory material. Where an AC is referred to in a 'Note' below the regulation, the AC remains as guidance material. ACs should always be read in conjunction with the referenced regulations. 4.15.4 Definitions In this advisory circular, unless the contrary is stated: aerodrome means an area of land or water (including any buildings, installations and equipment), the use of which as an aerodrome is authorised under the regulations, being such an area intended for use wholly or partly for the arrival, departure or movement of aircraft. aircraft landing area (ALA) means a place which may be suitable for the landing and take-off of an aeroplane of appropriate certification and performance but which may not fully meet formal standards of construction, marking, maintenance or reporting. apron means a defined area on a land aerodrome intended to accommodate aircraft for purposes of loading or unloading, fuelling, parking or maintenance. clearway means a defined area in which there are no obstacles penetrating a slope of 2.5% rising from the end of the runway over a width of 45m. demonstrated landing distance (DLD) means an aeroplane?s unfactored landing distance as demonstrated by the aeroplane's manufacturer under a certification process. factor means a safety margin applied as a multiple to an aeroplane manufacturer's minimum take-off or landing distance data to allow for the variables experienced in normal operations (usually expressed as a percentage). float plane means any aeroplane designed for landing or taking-off from water. fly-over area means a portion of ground adjacent to the runway strip which is free of tree stumps, large rocks or stones, fencing or any other obstacles above ground, but which may include ditches or drains below ground level. landing area means a place which may be suitable for the take-off and/or landing of an aircraft under appropriate conditions. large aeroplane means an aeroplane over 5700kg MTOW. lateral clearance area means an area each side of a runway in which obstructions are graded upward away from the runway to reduce wind-shear and provide lateral clearance in the event of divergence from the runway centre-line (see Appendix A, Figure 1). manoeuvring area means that part of an aerodrome to be used for the take-off, landing and taxiing of aircraft, excluding aprons. maximum landing weight (MLW) means the maximum weight at which the aeroplane may land or alight. maximum take-off weight (MTOW) means the maximum weight at which an aeroplane may commence its take-off roll. movement means the taking off or landing of an aircraft. movement area means that part of an aerodrome to be used for the take-off, landing and taxiing of aircraft, consisting of the manoeuvring area and the apron(s). obstacle free area means an area where there are no wires or any other form of obstacles above the approach and take-off areas, runways, runway strips, fly-over areas or water channels. runway means a defined rectangular area on a land aerodrome which is prepared for the landing and take-off of aircraft. runway strip means a portion of ground between the runway and fly-over area which is in a condition that ensures minimal damage to an aeroplane which may run off a runway during take-off or landing. small aeroplane means an aeroplane not more than 5700kg MTOW. alighting area means a suitable stretch of water for the landing or taking-off of a float plane or amphibian under specific conditions. 4.15.5 General 4.15.5.1 CASRs 91.180 and 91.225 require pilots to assess aircraft performance in the prevailing circumstances in order to assure the safety of their aircraft when taking off or landing. The assessment of aircraft performance must include appropriate allowances for the variables that occur in normal operations. 4.15.5.2 Aircraft performance data is supplied in the Aircraft Flight Manual (AFM), Owners Manual, Pilot's Operating Handbook or an equivalent publication. 4.15.5.3 There is no legal obligation on pilots of private aeroplanes below 5700kg to apply safety margins (factors) to the take-off or landing distances recommended by the aeroplane manufacturer. However, the pilot cannot reasonably expect to meet optimum performance standards during normal field operations, and if recommended safety factors are not applied, he or she must accept a greater level of personal responsibility for ensuring that safe runway distances are available in the prevailing circumstances. *See the standard safety factors recommended for small aircraft at Table 1 to Appendix A. 4.15.6 Permission to operate and responsibilities 4.15.6.1 Permission to operate. There is ownership and management of almost every potential landing place, with the possible exception of open areas of water. Unless a landing place is unambiguously open to public use for aviation the pilot should assume that approval is required before using land or water for an aircraft movement. General examples of places where approval is required would be: an unlicensed landing ground managed by local council or private organisation/landowner private farmland roads, parks or fairways owned by local authorities or private interests water, land or dry lakes managed by a state authority such as National Parks, Waterways Authority, Lands Department, etc. 4.15.6.2 Penalties and liability. Use of a public facility such as a road or park for landing may attract a penalty from local authorities even if the physical requirements for a landing area are satisfied. Where land is not actively managed an unauthorised landing might still be considered a trespass. A liability for reckless or negligent operation may also arise if appropriate precautions were not taken to avoid conflict with other users. 4.15.6.2.1 While the law generally recognises a person's right to take any reasonable action to save themselves in an emergency, pilots should remember that nothing in the CASRs acts to protect him/her against civil liability in the case of damage to persons or property. 4.15.6.3 Pilot responsibilities. The pilot in command has responsibility for the safety of the aircraft and those on board. He or she is required to obtain and assess all the information needed for the safety of the flight, and must not take off or land unless the information indicates that the aeroplane can operate safely. 4.15.6.4 Aerodrome information. Whether operating at an aerodrome or an ALA the pilot of an aeroplane needs to know: the location of the aerodrome or ALA and the features that can be used to positively identify it as the aerodrome intended for landing. the means of identifying the boundaries of the manoeuvring area whether people, machines, stock or wildlife are likely to be present at the time of movement the length of (suitable) runway available the width of the runway the nature of the runway and movement area surface the runway elevation the runway direction the runway slope recency and type of usage: eg., use as agricultural strip, any current fixed-wing, gliding or parachute operations etc surface type: eg., seal, broken seal, black soil, sandy loam, naturally soft, naturally hard, gravel, small/larger stones, etc surface conditions: eg., cracked, sandy, soft gravel, muddy, recently ploughed, hardened mud (rutted or stock-pitted), heavily grassed, lightly grassed, etc. surface moisture levels: eg., dry, moist, wet, muddy ambient conditions: temperature, wind, general conditions obstructions in the approach, take-off and lateral transition areas power lines near the aerodrome any management limits on the use of the landing place any special procedures applicable at the landing place: eg one off activities NOTAMs or AIP Supplements applicable to the area 4.15.6.5 No-go situations. Every pilot must learn to resist personal and external pressures to proceed without essential safety information, or when evidence suggests safety is not reasonably assured. It is also important that other persons involved in the operation are made aware that no decision to proceed will be made until all required information has been assessed. Unless and until the operation is potentially safe both common sense and regulatory requirements mean that the take-off or landing must not be attempted. *Appendix A shows the operational elements that should be considered when assessing the safety of a proposed movement. 4.15.6.6 Landing area manager's responsibilities. A person who gives an approval to operate must be careful to stay within his or her level of expertise. The law will usually see the provision of information as an invitation to operate, and the person giving an invitation takes on a duty of care for the welfare of the person invited. In a matter of negligence the question to be answered will usually be "was the risk reasonably foreseeable to the visitor or the class of persons to whom the visitor belongs?" Nothing by way of conjecture should be said, and only information known beyond reasonable doubt to be accurate should be passed. If the person who is asked for advice about a landing place is not clearly aware of the facts needed to answer a question, he or she would be well advised not to volunteer an answer. Information found to be wrong should be corrected even if the pilot is on the way. It is essential that a person who issues an approval to land or take off an aeroplane either: (a) limit themselves to issuing approval to operate plus providing only known fixed information such as surveyed length of runway, aerodrome elevation and compass orientation; or (b) given an arguable awareness of the requirements on the basis of training and experience, provide fixed information plus variable surface conditions and weather information they have reasonable grounds to believe are correct. The duty of care ?Whenever a person gives information or advice to another upon a serious matter in circumstances where the speaker realises, or ought to realise, that he is being trusted to give the best of his information or advice for action on the part of the other party to act on that information or advice, the speaker comes under a duty to exercise reasonable care in the provision of the information or advice he chooses to give? L. Shaddock & Associates Pty Ltd v Parramatta City Council (1981) 150 CLR 225 In all cases the responsibility for safe operation rests with the pilot, and while the owner or manager has an obligation to provide factual information, he or she is not required to guarantee that an aerodrome is safe for landing or take-off. A landing area's owner or manager is less likely to be held responsible if the visitor is without a lawful right to use the aerodrome. However, the owner or manager of a clearly marked aerodrome, which is unserviceable or hazardous, would be wise to provide warning to others about its status. He or she could probably discharge any duty of care by removing the markings or by displaying an unserviceability cross on the aerodrome. 4.15.7 Assessing the suitability of an ALA 4.15.7.1 The suitability of a landing place depends on its characteristics, the aircraft to be used and the pilot's qualifications and skills. The landing place must meet the aircraft manufacturer's recommended minimum standards for dimensions, slope, surface bearing capacity, obstacle-free gradients and so forth. The weather conditions must also be considered. 4.15.7.2 A pilot is authorised by virtue of his or her licence to assess these factors before deciding whether a particular movement should take place. If a pilot fails to discover or consider any significant factor affecting the safety of a movement, he or she may be liable to action in negligence. 4.15.8 Criteria for a landing area Each aircraft movement calls for a landing and take-off area of certain dimensions. The individual aircraft's flight manual shows the dimensions required for given combinations of weight, altitude and temperature. *Appendix A, 'Dimensional and Other Guidelines for Aircraft Landing Areas (ALAs)' shows the minimum ALA physical standards for aeroplanes below 5700kg. Higher standards apply to licensed aerodromes, with the most stringent requirements being for licensed or private aerodromes where high capacity aeroplanes are used in commercial passenger transport operations. 4.15.9 Pressure and density altitude 4.15.9.1 Pressure altitude. A significant characteristic of a landing area is its height above sea level, which, combined with the QNH, gives rise to pressure altitude. The reduction of ambient air pressure with height increases the True Air Speed (TAS) required for a given Indicated Air Speed (IAS), which affects take-off and landing distance requirements. To determine pressure altitude, apply the QNH to the aerodrome elevation. Thus a pilot on a sea level aerodrome with a QNH of 1003 would calculate 1013-1003 = 10hpa x 28ft, giving a pressure altitude of 280ft AMSL. Alternatively a pilot can read pressure altitude directly by setting standard pressure 1013.25 on the altimeter subscale. 4.15.9.2 Density altitude. Increased density altitude markedly reduces engine power output (this effect can be delayed if an aircraft is fitted with a turbocharger, which can maintain a regulated inlet air pressure to flight level heights). If necessary, density altitude can be determined by applying the ambient temperature to the pressure altitude, with each 1 deg C variation from ISA giving rise to 120ft variation in density altitude. Thus a sea level aerodrome with ISA pressure and 25 deg would have a density altitude of 1200ft. The pilot does not usually have to make a separate density altitude calculation because take-off and landing performance charts usually provide integral solutions for density altitude through entries of pressure altitude and temperature. (For more information see 'High density altitude: effect on take-off/landing performance'.) 4.15.10 Aerodrome surface characteristics 4.15.10.1 Rolling resistance. Rolling resistance is determined by tyre pressure, aeroplane mass, and the surface characteristics of the movement area. Up to a point, rolling resistance may be welcome during landing, but unexpected rolling resistance on take-off can lead to a decision to abort the take-off, or possibly an over-run accident. The limits of safety during landing would be that which caused damage to the tyres or aeroplane structure, or loss of directional control. Low tyre pressure can have a very significant effect (note how difficult it is to shift an aeroplane by pushing it about the tarmac with low tyre pressures, or experience the difference between pushing a fully-loaded wheelbarrow with a very low tyre pressure versus the same load on a tyre with higher pressure). 4.15.10.2 Surface. The main variable in rolling resistance is the nature of the runway surface. The surface may be concrete, bitumen, coral, gravel, soil, grass on soil or sand, hard packed sand or a dry salt-bed (salt lake), each with its own characteristics, many of which vary with the weather and season. Obviously the rolling resistance on concrete or bitumen is minimal and predictable, but the rolling resistance on other types of surface varies widely between surface types, and will even vary with changes in surface solidity along the length of a given runway. Rolling resistance can be caused by standing water on any runway surface because it builds up in front of the wheels (witness the braking effect on a car driven across a water-covered causeway). In the case of any natural surface the soil moisture content significantly affects rolling resistance, as does surface looseness, presence of algal growth, grass mass and characteristics, surface irregularities, and subsurface softness. Very dry is helpful on some natural surfaces but detrimental on others. With the exception of beach sand very wet almost invariably gives rise to an unsatisfactory surface. Grass density, greenness and length have a significant effect on the rolling behaviour of an aeroplane (grass can also hide obstructions, holes, water, stones, anthills and erosion trenches). 4.15.10.3 Assessing the variables. Table 1 to Annex A provides some guidance about the effects of various surface conditions, but no table can reasonably cater for all scenarios or all factors, and a pilot must develop an ability to make his/her own assessments. Some of the factors that will affect the safety of take-off are: transverse or lateral slope, which can affect the aerodynamics of flight, and may also result in a longer take-off roll because the pilot has to use asymmetric brake, nosewheel steering or rudder to keep straight gravel, which may mean a longer take-off roll because power may have to be applied slowly during the initial roll to avoid stone-chip damage to the propeller, and may, if very soft, give rise to a wave effect in front of the wheels that resists forward motion sand, which is usually worse than gravel in terms of creating rolling resistance grass, which resists the passage of an aeroplane rolling over it: while attempts are made to predict the effects of certain lengths of grass, rolling resistance will vary not just with the length, but also freshness, moisture content, density of stalks and the mass of material present free water, which not only affects the softness or slipperiness of the surface but can build up in front of an aeroplane?s wheels and cause a resistance to rolling, or at higher speeds, lift the wheels and cause aquaplaning and difficulty in maintaining directional control water in soil, can create mud, which can affect an aircraft's direction control and may choke spats or wheel-wells and restrict rotation of its wheels. In addition, soft spots may allow an aeroplane's wheel(s) to sink enough for the propeller to hit the ground, or may cause erratic rates of acceleration during a take-off. bearing capacity, which is related to the type of runway surface and the aeroplane's weight and tyre pressure. If the bearing capacity is insufficient for the combination of aeroplane, tyres and surface, a form of bogging may occur even in dry conditions (as might be experienced when driving a vehicle over sand or a freshly ploughed paddock). 4.15.10.4 Reliability of information. Be aware that some ALAs may be managed by persons who have limited ability to assess the proposed landing area's operational status. A pilot could get approval to land and related information from the manager of a proposed landing area but may not have full confidence in the quality of the information received. In such a case the pilot has to accept that there is no basis for an operational decision to proceed, and should cancel the flight or operate to the nearest aerodrome (see the definition). 4.15.11 Ambient conditions 4.15.11.1 Wind-speed and direction. Every pilot knows that wind can dramatically affect the length of runway required for take-off or landing. Likewise, every aeroplane should be provided with charts that can be used to calculate the effects of various wind scenarios on performance and runway requirements. 4.15.11.2 Humidity. Light aeroplane data does not usually include a humidity correction, but all engines are adversely affected to some degree by high humidity because water vapour displaces oxygen and reduces temperature rise during combustion. If the aeroplane's documentation provides relevant information the pilot should allow for the effects of humidity in a critical take-off. 4.15.12 Aeroplane characteristics and configuration 4.15.12.1 Performance data. The performance of every certificated aircraft has been evaluated as a part of the certification process. The certification process allows the manufacturer to determine the take-off and landing performance under ideal conditions (see para 14.2). 4.15.12.2 Factoring. 'Factors' are safety margins applied to the calculation of take-off and landing distance requirements to allow for random variables in aircraft, pilot and runway surface performance encountered in normal operations. Safety factors need to be applied because an aeroplane manufacturer's advertised performance figures are determined by a company test pilot on a good surface using a finely tuned machine in ideal weather conditions. Private operations. As mentioned earlier, the regulations don't require the application of any factoring for small aeroplanes in private operations except in certain circumstances such as land and hold short operations (LAHSO), where a common standard has to apply to all participants. *See Appendix A Table 1. 4.15.12.4 Weight Altitude Temperature (WAT) limitations. [Not applicable to ultralight operations] 4.15.12.5 Performance category. [Not applicable to ultralight operations] 4.15.12.6 Flap settings. The use of flap during take-off may be optional, or it may be the standard configuration for the aircraft. The latter is most likely to be the case in aeroplanes with wings optimised for higher indicated airspeeds. Pilots should be aware that while flap generally reduces the take-off roll by permitting lift-off at a slower speed, drag is always increased and the rate of climb after take-off is reduced until flap is retracted. Despite the reduced rate of climb, use of flap will allow a slightly slower take-off safety speed, which usually results in a steeper climb angle than in the clean configuration. Where a take-off flap setting is optional, flap can be used to reduce rolling resistance on a soft or rough runway (and thus the length of the ground roll), but it would normally be retracted at a safe speed after take-off and the aeroplane then allowed to accelerate to the speed for best rate of climb. 4.15.12.7 Braking performance. The nominal braking performance of an aeroplane is a design feature of each aeroplane type. Braking performance is also a function of runway surface conditions, availability of anti-skid, the pilot's braking technique, tyre condition and inflation, brake disc condition and residual temperature, aeroplane speed and mass, and the presence of slush, mud, water and other more subtle factors. In the case of a minimum field landing in an aeroplane, which is not equipped with anti-skid, one of the major difficulties is the pilot's ability to judge the application of maximum brake just short of wheel-skid. All of the relevant factors must be considered when assessing the aeroplane's likely performance in a critical situation. 4.15.12.8 Reverse thrust. [Not applicable to ultralight operations] 4.15.12.9 Propeller strikes and engine damage. A muddy, irregular or watery surface on an aerodrome or taxiing area can cause a propeller tip strike that may not be noticed by the pilot. When operating on a natural surface runway, careful preflight inspections of the propeller(s) are imperative. If a tip-strike happens during taxi for take-off it could easily result in an abandoned take-off, and possibly a major accident. Any propeller strike will probably cause some form of blade bending, distortion or delamination, but a serious strike will bend the tips back, distort the angle of the blades, may damage a gear-case or bend the propeller shaft, and will usually give rise to severe and probably dangerous vibration. If damage has occurred it cannot be ignored and will not correct itself. If a pilot has any reason to at all to suspect that a propeller may have struck the ground during taxi for take-off the only rational thing to do is to shut down the engine and inspect the propeller before attempting take-off. 4.15.12.10 FOD, gravel and dust. Foreign object damage (FOD) to a turbine engine may cause loss of power or complete failure. FOD frequently arises when gravel is sprayed into the engine intake by the nosewheel, or picked up in a vortex under the engine intake at high power. Dust will damage both piston and turbine engines, but can be reduced in piston engines by use of filtered air. Pilots should be aware that full power for take-off is predicated on selection of unfiltered ram air, and that carburettor heat is usually unfiltered. Foreign objects, especially gravel, may cause propeller chipping and may give rise to propeller cracks after being caught up in the propeller tip vortices of an engine doing a run-up, or at high rpm during the early stages of take-off. The possibility of propeller damage by gravel may be a significant operational consideration in a take-off from an unswept bitumen or a natural surface, because while the potential for damage can be greatly reduced by progressive application of power during the take-off roll (thus reducing vortices), the take-off distance required is usually calculated assuming full power at brakes release. 4.15.13 Obstacles on and in the vicinity of an aerodrome 4.15.13.1 Runway ends. The ideal runway will have an extended surface that can be used for bringing an aeroplane to a safe halt after an over-run of the runway. An obstacle-free surface extension that is not sound enough to permit normal operation of an aeroplane may nevertheless minimise structural damage if an aeroplane undershoots or overruns the runway. 4.15.13.2 Obstruction-free areas. Obstruction free areas on a runway extended centre-line provide for low angles of take-off and safe clearance on approach. A significant clear area at the end of a runway may have an important psychological effect on the way a pilot handles an aeroplane during take-off and landing. During take-off, close-in obstructions on the runway extended centre-line may cause a pilot to lift off early and climb at an excessive angle, which will aggravate any problem of poor view of obstructions through the windscreen at high pitch angles, which in turn may lead to a further increase in pitch. During landing, high ground or obstructions in the approach area can cause a pilot to adopt a high approach path. Significant obstacles below the runway such as sea walls, creeks or ditches may also cause a pilot to approach at an excessively high angle and then land long. This effect is likely to be worse when the aeroplane has poor forward visibility or is approaching in a flapless configuration. 4.15.13.3 Emergency alighting areas, and climb in the event of engine failure during take-off. Among the characteristics of a good aerodrome for single-engined aeroplanes is an area accessible from the lift-off point to safe manoeuvring height that is suitable for carrying out a forced landing in the event of engine failure after take-off. Similarly, for twin-engined aeroplanes, a good aerodrome will have an obstacle-free, low-angle departure area where an engine failure could be handled with minimum danger of striking ground or obstacles. 4.15.13.4 Light conditions. Pilots should not underestimate the potential difficulty of taking-off or landing directly into a low sun, and should take into account haze, smoke or low light when manoeuvring in the vicinity of an aerodrome or looking for other traffic. In particular, if a take-off or landing into the sun is known to be likely, the pilot should make every effort to ensure the windscreen is clean. 4.15.14 Aeroplane information 4.15.14.1 Aeroplane certification standard. The certification standard specifies what information must be provided in the aircraft flight manual. Most CASR/FAR Part 23 aeroplanes are not designed for fail-safe operation in the same way that large aeroplanes are meant to perform. Each aeroplane type and category has a certification standard, the operational details of which are reflected in the flight manual. 4.15.14.2 Demonstrated landing distance. Part 23 requires the manufacturer of an aeroplane to demonstrate the landing distance required for the aeroplane. The demonstrated landing distance (DLD) is the figure supplied by the manufacturer for the pilot to use as the basis for assessment of landing distance required for a particular landing. Pilots should be aware that the aeroplane manufacturer has a vested interest in publishing the minimum distance obtained in a landing under the conditions permitted for the tests. The requirements for the test are: the aeroplane must approach at not less than 1.3 times the stall speed in the landing configuration; the aeroplane must cross the threshold at not less than 50ft; the test must be done on a dry, sealed surface; and the aerodrome must be within 2% slope up and 2% down. the manufacturer is also at liberty to have the certification done by an experienced test pilot authorised to fly as aggressively as possible short of damaging the aeroplane. It follows that pilots conducting normal operations are highly unlikely to replicate the aeroplane manufacturer's DLD in normal operations, and therefore have a duty of care to apply appropriate safety margins. 4.15.14.3 Performance information. The aircraft's flight manual, owner?s manual, operating handbook or placarding should provide relevant performance information, but presentations are not standardised. Learning how to find and interpret a particular aircraft's performance information should be part of a pilot's familiarisation with the aeroplane. 4.15.14.4 Relevant nomenclature. There are few standard 'V speeds' or suchlike performance notations formally applicable to small aeroplanes. Notwithstanding, a number of notations are frequently used to describe small aeroplane performance parameters. *A list of notations in common usage for large and small aircraft are shown at Annex A Table 4. 4.15.15 Critical operations 4.15.15.1 Land and hold short operations (LAHSO). [Not applicable to ultralight operations] 4.15.15.2 One-way operations. One-way operations are little used in Australia except in some hill-country agricultural operations, usually fertiliser dropping. If the only available landing strip faces into a hill, landings have to take place toward the hill and take-offs made away from the high ground. A problem with many one-way landing strips is that rising ground precludes a go-around beyond some point short of the target threshold. Don't try to use a one-way strip unless you are highly experienced or formally trained, and have recent practice in landing in minimum distance. If a pilot intends to operate off one-way strips, logbook evidence of skill training by an experienced agricultural instructor would be a wise precaution against insurance problems and general liability. Many one-way strips have a steep slope, and even experienced pilots may have difficulty with perspective on final - a normal approach angle is likely to appear too steep, causing the pilot to descend to establish an abnormally shallow approach angle with a high approach speed. If the landing area backs on to high ground the pilot may find him or herself committed to a landing above target threshold speeds and either try for a go-around and fail to outclimb the gradient, or have to proceed with a high-speed landing that results in over-running the (usually short) landing strip. Another major problem for one-way operations is the possibility of adverse winds. Tail winds on a minimum length strip are a recipe for disaster, and turbulent winds in hilly areas can cause severe handling problems even if they are generally in the optimum direction. Appendix A: Dimensional and other guidelines for aircraft landing areas (ALAs) 1. Use of landing areas by large aeroplanes 1.1 For non commercial operations the pilot in command of an aeroplane must ensure that the aeroplane only takes off or lands at aerodromes which have physical characteristics, visual aids, facilities and obstacle limitation surfaces that are adequate for the safe operation of the aeroplane, taking into account whether the operation is to be conducted by day or by night, the weather minima to be used and requirements relating to the aeroplane's performance. 2. Recommended minimum physical characteristics of landing areas and water alighting areas 2.1 Runway Width. For other than agricultural operations, a minimum width of 15 metres is recommended, although experienced pilots can operate aeroplanes with a MTOW less than 2000kg on runways as narrow as 10 metres provided there is little or no cross-wind. If the pilot cannot comfortably straddle the mainwheels across the centreline of a sealed runway for the entire ground-roll, a take-off or landing on a strip less than 20 metre wide should not be attempted. Inexperienced pilots should be very cautious about using a narrow strip, especially if the edges of the strip are rough, soft, or otherwise likely to slew or damage the aeroplane. In addition, each aeroplane type has different handling characteristics that need to be taken into consideration. *For agricultural operations, operating on runways less than 10 metres is not recommended. 2.2 Runway length for landing. A runway length at least equal to that specified in the aeroplane's flight manual (or approved alternative) for the prevailing conditions is generally the minimum acceptable. If an unfactored landing distance (the DLD) is shown in the AFM, the pilot should call for at least 15% additional landing distance. Qualified agricultural pilots may conduct day operations off runways equal to 75% of the runway requirements specified in the aeroplane's flight manual for the prevailing conditions, provided that (at least) the remaining 25% of the nominal runway length is available as clearway, and given that the aeroplane approaches to land over the clearway and takes off toward the clearway. Night agricultural operations should be conducted off runways at least 50% longer than those required for day operations, preferably with additional clearway because obstructions will be unlit. 2.3 Longitudinal Slope. The longitudinal slope between the runway ends should not exceed 2%, except that 2.86% is considered safe on part of the runway so long as the change of slope is gradual. In agricultural operations, runway slope should not exceed 12.5% for day and 2% for night operations. *Where overall slope exceeds 2% the runway should be used only for one-way operations, with landing uphill and take-off downhill. 2.4 Transverse Slope. The transverse slope between the extreme edges of the runway strip should not exceed 2.5% or 12.5% upward slope over the fly-over area. For agricultural day operations, the transverse slope should not be more than 3% over the runway and 5% over the runway strip. 2.5 Wind. The effects of wind cannot be ignored because it dramatically affects the distance required for a landing or take-off. A windsock is the preferred method of determining wind, and is a must if the aerodrome is used frequently. In other cases, consider having a person provide a smoke signal (fire or smoke flare) clear of the approach path near the approach end of the runway. 2.6 Other Physical Characteristics. Both ends of a runway should have approach and take-off areas clear of objects above a 5% slope for day and a 3.3% slope for night operations. If an object or terrain projects above the surveyed angle it must be sufficiently far away to allow an aeroplane taking off to turn before it is reached, and to permit a safe turn onto finals. [Other recommended landing area physical characteristics are shown on the full document] 2.7 Float plane alighting areas. For water operations, a minimum water channel width of 60 metres for day and 90 metres for night operations is recommended. The depth of water over the whole water channel should not be less than 0.3 metres below the hull or floats of the stationary aeroplane when loaded to maximum take-off weight. An additional area, as shown in the following diagrams, provides a protective buffer for the water channel but need not consist of water. Where the additional area consists of water then it should be clear of moving objects, or vessels under way. The centre line of a water channel may be curved, provided that the approach and take-off areas are calculated from the anticipated point of touchdown or lift-off. 3. Conversion table Landing area gradients and splays expressed as a percentage, in accordance with ICAO practice, may be converted into ratios or angles using the following table: Percentage Ratios Degrees 1 1:100 0°34? 2 1:50 1°09? 2.5 1:40 1°26? 2.86 1:35 1°38? 3 1:33.3 1°43? 3.33 1:30 1°55? 5 1:20 2°52? 12.5 1:8 7°08? 20 1:5 11°18? 4. Marking of landing areas 4.1 Where extended operations are expected to be conducted at a landing area, the owner/operator is encouraged to provide markings similar to those found at government and licensed aerodromes. If markings are provided, they should follow the colours and specifications set out in AIP AD. 4.2 Where runway markers are provided which are not flush with the surface, they should be constructed of a material that is not likely to damage an aeroplane. 5. Lighting for night operations [Not applicable to Ultralight Aviation] 6. Other factors that should be considered prior to using a landing area 6.1 A pilot should not use a landing area unless the aeroplane can be kept clear of all persons, animals, vehicles or other obstructions. 6.2 Geographic Location. A landing area should not be located: under an instrument approach area or in such a position that it presents a hazard to aircraft conducting a published instrument approach; within any area where the density of aircraft movements creates a hazard; or where take-off or landing over buildings, noise sensitive livestock or populated areas causes a nuisance or hazard. 6.3 If a proposed landing area is located near a city, town or populous area or any other area where noise or other environmental considerations make aeroplane operations undesirable, the availability of such a landing area may be affected by the provisions of relevant environmental legislation. 7. Measuring an aerodrome 7.1 Distances. The length of a potential runway can be established in a number of ways. Always measure twice, preferably by different methods and round measurements down to ensure that the results are conservative. Common methods of measuring are: pacing: all individuals have their own stride length which can be established by averaging, with about 0.75 metre being a common walking stride that might be used to determine the length of a runway, and 1 metre being a long, deliberate stride that might be used to find the width of a runway; motor: the odometer of a calmly driven vehicle or motorcycle can be used to measure the length of a runway and many clearways; measuring wheel: the best method, with wheels commonly available and used for a variety of land measuring tasks. 7.2 Slope. If the slope is seen as significant it can be measured by farm or surveyor's inclinometer, or the pilot may take altimeter readings at both ends of the runway, convert the altimeter reading to metres and divide the altitude difference by strip length to get slope. For example, if the altimeter reading at each end of a 800m runway differs by 55 ft (16m) the ratio is established at 1:50 by dividing runway length with the height difference (800/16). This equates to a slope of 2% (refer to the conversion table para.3) 8. Surface testing of a landing area 8.1 Rough surfaces. The presence of holes, cracks and ruts will degrade aeroplane performance and handling and increase the possibility of structural damage. Driving a stiffly sprung vehicle along the runway at a speed of at least 75 kph can test the smoothness of a runway. If this does not cause significant discomfort to the occupants of the vehicle, the surface can be considered satisfactory. 8.2 Soft, wet surfaces. A test vehicle should be driven in a zig-zag pattern at a speed not exceeding 15 kph along the full length and width of the runway. Particular attention should be paid to suspect areas with up to three passes over suspect ground. If the vehicle's tyre marks exceed a depth of 25mm the surface is not suitable for any aeroplane which can be reasonably represented by the test vehicle. As a rule, an aeroplane with small wheels or high tyre pressures will require harder runways. If recent heavy rain or other waterlogging has occurred, the ground should be tested with a crowbar in several places along the runway to ensure that a dry surface crust does not conceal a wet base. 9. Factors and notations 9.1 After establishing the aeroplane's runway requirements in the prevailing density altitude and wind conditions by consulting the AFM it is recommended that the unfactored (DLD) runway length required by the AFM be multiplied by a safety factor related to MTOW of the aeroplane. The standard factors shown in Table 1 are recommended for private operations in small aeroplanes: Table 1: Standard factors for take-off: for all MTOWs 1.15 or 115% Standard factors for landing: up to 2000kg MTOW 1.15 or 115% 9.3 After factoring the DLD in accordance with Table 1 the pilot should apply further factors in accordance with any guidance given in the AFM. If the AFM is not helpful, consider applying any of the allowances shown in Tables 2 and 3 below that are relevant to the flight. Table 2: Contingency take-off allowances - approximate increase in take-off distance to 50 ft Circumstance Factor Multiple per 10% increase in aeroplane weight 20% 1.2 an increase of 1000 ft in airfield altitude 10% 1.1 an increase of 10C in ambient temperature 10% 1.1 dry grass* up to 20 cm (on firm soil) 20% 1.2 wet grass** up to 20 cm (on firm soil) 30% 1.3 2% uphill slope* 10% 1.1 a tailwind component = 10% of lift-off speed 20% 1.2 soft ground or snow* 25%+ 1.25 + (These effects are additive) * Effects are variable and possibly unpredictable. Expect a ground distance increase, but airborne distance remains the same ** If wet grass is on soft ground the effect on rolling resistance is cumulative, so both elements must be considered. Table 3: Contingency landing allowances - approximate increase in landing distance from 50 ft Circumstance Factor Multiple a 10% increase in aeroplane weight 10% 1.1 an increase of 1000 ft in airfield altitude 5% 1.05 an increase of 10C in ambient temperature 5% 1.05 dry grass* - up to 20 cm (on firm soil) 20%+ 1.2 wet grass* - up to 20 cm (on firm soil) 30%+ 1.3 short and dense or very green grass* 60% 1.6 2% downhill slope 10% 1.1 tailwind component, per 10% of landing speed** 20% 1.2 light snow or surface muddiness 25%+ 1.25+ 20-50mm standing water* 50%+ 1.5+ (These effects are additive) * Effects are variable and possibly unpredictable. While rolling resistance is increased, reduced braking effectiveness has the greater effect. Airborne distance remains the same but expect an increase in ground distance. ** In factoring the effect of wind, reduce estimated headwind by 50% and assume that a tailwind is 50% greater than the estimate. Table 4: Standard notations (the 'V-speeds') The following informal list of notations are typical of those used in depicting performance and handling values for various aircraft (most relate to large aircraft): Vf - design flap speed Vfe - maximum flap extended speed Vh - maximum speed in level flight with maximum continuous power Vne - never-exceed speed Vno - maximum structural cruising speed Vle - maximum landing gear extended speed Vlo - maximum landing gear operating speed Vs - stalling speed, or the minimum steady flight speed at which the aeroplane is controllable Vs15 - (example) stalling speed with 15 deg flap Vso - stalling speed or minimum steady flight speed in the landing configuration Vs1 - stalling speed or minimum steady flight speed in a specific configuration Vs1g - stalling speed for a force equalling 1g Vmu - minimum unstick speed Vr - rotation speed Vlof - maximum lift-off (unstick) speed Vtoss - take-off safety speed, being a speed at which adequate control is available in the event of a sudden and complete failure of the critical engine during climb after take-off Vx - speed for best angle of climb Vy - speed for best rate of climb Vfr - flap retraction safety speed Vfc - final climb speed (take-off) Va - design manoeuvring speed Vb - design speed for maximum gust intensity Vc - design cruise speed Vd - design diving speed Vdf/Mdf - demonstrated diving speed Vmcl - minimum control speed for landing approach, all engines operating Vat - target threshold speed Vmt - minimum threshold speed Vtmax - maximum speed at the landing threshold Vat1 - target threshold speed, one engine out Vtd - touch-down speed Vp - aquaplaning speed STRICT COPYRIGHT JOHN BRANDON AND RECREATIONAL FLYING (.com)
 -
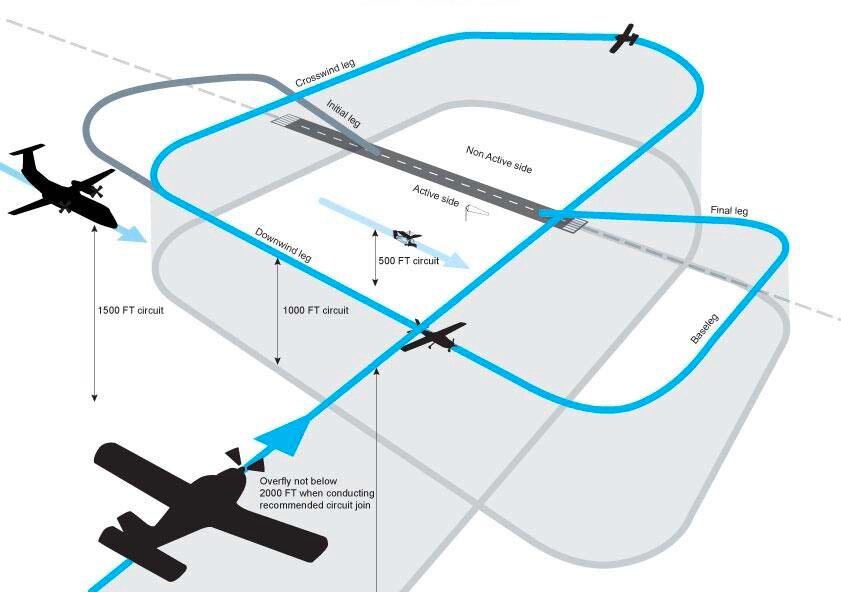 Please note this is an html version of a draft CASA Advisory Circular AC 91-220(0) initially circulated September 2001; all the CASR 91 series regulations referred to are still not enabled, thus this document has not progessed beyond draft status and furthermore, at July 2014, the CASR 91 series regulations are not applicable to RA-Aus aircraft operations. However, the Civil Aviation Safety Authority have produced two civil aviation advisory publications applicable to RA-Aus aircraft operations that recommend particular procedures and provide guidance on a code of conduct to allow greater flexibility for pilots when flying at, or in the vicinity of, non-controlled aerodromes. These Civil Aviation Advisory Publications (available on this website) are: CAAP 166-1 'Operations in the vicinity of non-controlled aerodromes' (August 2014) and CAAP 166-2 'Pilots responsibility for collision avoidance in the vicinity of non-controlled aerodromes using 'see and avoid' (December 2013). 4.14.1 REFERENCES CASR 91.185 Basic rule "see and avoid" CASR 91.190 Operating near other aircraft CASR 91.195 Giving right of way CASR 91.200 Who has right of way CASR 91.205 How to give right of way CASR 91.210 How to overtake in flight CASR 91.215 Right of way rules aircraft on the ground or water CASR 91.220 Operating on or in vicinity of non-controlled aerodromes CASR 91.225 Safety during take-off and landing 4.14.2 PURPOSE This Advisory Circular (AC) provides information to enhance the safety of flight at aerodromes and landing places which do not have an aerodrome traffic control (tower) service in operation. It is intended to give an overview of pilot responsibilities and highlight principles applicable to all pilots who operate at non-controlled aerodromes. 4.14.3 STATUS OF THIS AC This AC is the first that has been issued on this subject. Advisory Circulars are intended to provide recommendations and guidance to illustrate a means but not necessarily the only means of complying with the Regulations, or to explain certain regulatory requirements by providing interpretative and explanatory material. Where an AC is referred to in a `Note' below the regulation, the AC remains as guidance material. ACs should always be read in conjunction with the referenced regulations. 4.14.4 DEFINITION Non-controlled aerodrome means an aerodrome where there is no aerodrome control facility in operation at the time of a particular take-off or landing. 4.14.5 INTRODUCTION 1. CASR 91.220 states the minimum legal requirements for operation of an aircraft at an aerodrome which does not have an aerodrome traffic control service. The regulation requires all pilots to conduct their operations in accordance with standard procedures. The objective is to ensure that each pilot in the vicinity of an aerodrome is aware of any other traffic at the aerodrome, knows the position and intentions of other pilots and can participate in an orderly flow of traffic. 2. Safe operations have been conducted at non-controlled aerodromes for the best part of 100 years, but the basic requirements have always been the same. Non-controlled aerodrome operations work well up to moderate levels of traffic if pilots know the characteristics of the aerodrome, inform themselves well, say what they are doing, keep a good look out and use standard procedures. 3. CASR 91.220 imposes a series of common-sense obligations on pilots, the aim of which is to ensure that any hazard associated with non-controlled operations is reduced to the minimum, consistent with the way operations at non-controlled aerodromes are actually conducted by sound pilots. 4. ATC may be placed into operation at an aerodrome without a tower for special purposes such as an air display, disaster relief or other significant event. Times of operation of a tower facility are promulgated in ERSA, and imposition of tower-type aerodrome control at other places will be notified by NOTAM. 4.14.6 OPERATIONS IN VMC 1. Factors. The principal factors or elements relating to operations in VMC are: The type of operation, i.e., agricultural, pilot training, air transport etc; Type of aircraft; Wind speed and direction; Number of runways; Obstructions and topography in the vicinity of the aerodrome; Built up areas and local noise sensitivity; Number of aircraft; Other activities, i.e., parachuting, glider flying, flight training; Whether all aircraft are radio-equipped; and Proximity of controlled airspace and low-level operations; Non-communicating traffic; and Non-compliant traffic. 2. Operational needs and manoeuvres.There can be varied operational needs and manoeuvres conducted at a non-controlled aerodrome: Skilled pilots will often want to make smaller circuits than pilots under training or with low recency; Larger air transport aircraft are expensive to run, and minutes saved make straight-in approaches an attractive proposition; Helicopters are not restricted to normal circuit patterns and generally operate to stay clear of fix-wing circuit patterns; Pilots doing actual or practice instrument approaches will often make straight-in or abbreviated approaches to a landing or to a missed approach point on an instrument runway, or will elect to join the circuit from overhead a navigation aid via the most convenient turn to the runway in use; Agricultural pilots conducting local deliveries may prefer to do a contra or a low-level circuit, or make straight-in approaches on a cross runway (expect any legitimate manoeuvre that will speed up delivery rates); Parachuting and glider tug aircraft may make steep descents into the circuit area; Ultralight pilots generally prefer to make low, small circuits, and to overfly terrain with potential for a safe forced landing; Gliders require winching or towing, often use parallel runways and/or contra circuits, and are committed to land from the time they enter the circuit; and Trainee pilots require relatively large circuits, don't have reserve capacity to cope with unusual manoeuvres by other aircraft , and can easily be forced to abandon their preferred flight path by other aircraft, including those on normal manoeuvres. 3. Safety rules permitting, the pilots of each type of aircraft will want to fly the circuit pattern most suited to the aircraft and the type of operation. Pilots have to give and take relevant information and exercise tolerance and consideration if varied circuit flight paths and experience levels are to be accommodated safely. 4. Wind, and pattern conflicts. Wind direction is generally more critical to smaller aircraft, hence the common provision of a small secondary runway. If a strong wind favours a short runway the circuit pattern may be complicated because small aircraft will use the short runway while larger aircraft may be forced to use a longer, out-of-wind runway. Light winds can make for a difficult traffic situation because pilots are not provided with a cue to use a particular runway, and will prefer to use the runway which is most suited to their operation. Where wind direction is not available from other sources, incoming aircraft may have to overfly the aerodrome to see a windsock, and may enter the traffic pattern in conflict with preceding aircraft. A difficult situation can arise when an aircraft is established on final leg in conflict with another aircraft taking off in the opposite direction. 5. Obstructions, topography, local noise sensitivity and adjacent CTA. Topography and obstructions (transmitting towers, smokestacks and so forth) may restrict circling in some parts of the circuit area, and built-up areas, hospitals, noise sensitive livestock or the like may require modification of normal traffic patterns or dictate close or wide circuits. Adjacent CTA must be avoided unless clearance to enter is obtained. Pilots must make themselves aware of any pattern variations peculiar to an aerodrome prior to operating at that aerodrome. 6. Number of aircraft, activities and communications. The greater the number of aircraft and the more varied the activities the harder it is for pilots to keep track of other traffic. Each pilot must be on the lookout for no-radio aircraft, ultralight aircraft, helicopters, aircraft on crosswind training, aircraft on straight-in approaches and aircraft operating contrary to the recommended circuit direction. Ready communication with other aircraft is vital, but if the traffic level is too high for self-arranged separation each pilot may have to resort to "unalerted see and avoid" techniques. In this situation each pilot should self-announce and try to keep track of other traffic by listening to other broadcasts of aircraft type, position and intention, simultaneously looking out for unannounced traffic. If there is too much traffic for a satisfactory level of safety, comply with the recommended circuit direction, announce your position and intentions, adopt alerted see-and-avoid practices and either land or vacate the circuit as soon as possible. 7. Gathering information. Before operating at any aerodrome, listen out, if possible, on the relevant CTAF or UNICOM frequency. Establish that the correct frequency is selected and use UNICOM, ATIS, AWS and/or other traffic to establish the pressure and wind direction, traffic numbers, traffic type and the runway in use. Maintain a good lookout while using radio to arrange self-separation; bearing in mind that excessive RT will decrease safety. Announcements made shortly before committing to particular manoeuvres such as entering a runway, taking off, entering downwind, or turning base give other pilots at the aerodrome a chance to adjust or arrange separation. 8. Circuit protocols. All pilots should develop the following habits: Carry radio, and use it appropriately; Make turns in the direction recommended for the aerodrome unless there is good reason to do otherwise, bearing in mind that there may be a left-hand pattern when landing in one direction and a right-hand pattern when landing in the opposite direction; Comply with CASR 91.220 (2) if making a turn contrary to the normal direction for the runway; Observe the right-of way rules (CASR 91.195, 91.200, 91.205, 91.210 and 91.215 ); Turn at a safe height and speed after take-off, (ideally, not less than 500ft AGL); Aim to line up above 500ft AGL for landing, and at least 1000m before the threshold; (g) where it is reasonable to do so, follow the approximate flight path of preceding aircraft (beware wake turbulence - never approach below the flight path of any large aircraft). If unable to follow, maintain your position in the sequence and broadcast your intentions if this will require an unusual shape or size to the circuit; If possible follow the convention that most fixed-wing aircraft fly the circuit at 1000ft AGL, helicopters at 800ft AGL and jet aircraft at 1500ft AGL; If overflying to review the windsock and signal square, do so at 1500ft AGL, (bearing in mind the possibility of jet or instrument practise aircraft at that height). Be proactive, do not remain silent because other aircraft are broadcasting. Let them know you are there. In 2010 CASA produced two advisory publications to support CTAF procedures and provide guidance on a code of conduct to allow greater flexibility for pilots when flying at, or in the vicinity of, non-towered aerodromes. These Civil Aviation Advisory Publications (available on this website) are: CAAP 166-1 'Operations in the vicinity of non-towered (non-controlled) aerodromes' and CAAP 166-2 'Pilots responsibility in collision avoidance in the vicinity of non-towered (non-controlled) aerodromes by 'see and avoid'. Note that the 'ultralight' term used in the CAAPs when recommending a 500 feet circuit height, refers only to those RA-Aus aircraft which have a normal cruising speed below 55 knots, or thereabouts. There are some variations in the advice given in the CAAPs and in this document. The CAAPs are the superior publications. CASA has produced an online interactive learning tool titled 'Operations at, or in the vicinity of, non-controlled aerodromes' which is now available at CASA online learning. 4.14.7 OPERATIONS IN IMC OR MARGINAL CONDITIONS 1. IMC. If the weather is below VMC all aircraft must carry radio and proceed on the basis of a professional level of broadcasting, although the possibility of a pilot operating full broadcast but on the wrong frequency remains. Visual circuit practice should not be done in weather below VMC, even if the ceiling is above the circling minima. In reduced visibility it is especially important that pilots display anti-collision lights and navigation lights in compliance with CASR 91.590. 2. Marginal conditions.There is a possibility that the pilot of an IFR aircraft may assume there will be no VMC traffic, and there a possibility that a VFR pilot may be airborne in conditions too demanding for his or her skills. A saving grace is that traffic numbers are usually fairly low, but there is a need to know what other IFR and VFR aircraft (the latter possibly without radio) are doing and to remain alert. Full use of radio, sight and lights is needed. A pilot should avoid doing repetitive circuits in marginal conditions, and should not fly as PIC if his or her skill levels are not enough to be comfortable in the prevailing conditions. 4.14.8 STRAIGHT-IN APPROACHES 1. In an endeavour to align expectations and lookout with what often happens in real life regardless of rules, the regulation for operations at non-controlled aerodromes does not limit straight-in approaches to certain classes of aircraft. Pilots must be on the lookout for aircraft on straight-in approaches, and any pilot who does a straight-in approach must exercise sound airmanship and observe the relevant rules 2. CASR 91.200 requires that, in the event of conflict between a powered aircraft on base leg and a similar aircraft on finals, the lower of the two aeroplanes has the right of way, subject to the courtesy expressed in the rule. 4.14.9 CIRCUIT DIRECTION The regulations permit turns contrary to the recommended circuit direction subject to supplementary safety procedures. Left-hand circuits should be performed unless right-hand circuits are recommended for the particular runway, but the pilot may use a contrary direction if it is safe to do so (CASR 91.220 (2)). In assessing the safety of a contrary turn the pilot should take into account, among other things, the prevailing visibility, the probable expectations of other pilots, and the possibility of a missed broadcast. 4.14.10 PARACHUTING AND GLIDING 1. Parachuting. Parachuting operations are conducted at many non-controlled aerodromes used by a variety of traffic. Protocols developed by CASA and parachuting organisations are expressed in the AIP. Some of the main elements are: Parachutists are not authorised to drop through cloud, but are not subject to the rules of VMC and may drop through gaps in cloud. The dropping pilot must broadcast intentions to drop 2 minutes prior to the planned exit, and must not drop if there is evidence of conflicting traffic. All aircraft except balloons must give way to descending parachutists. Parachutists will not exit within 15 minutes of the ETA of a scheduled passenger transport flight unless the drop pilot can be sure that all parachutists will have landed before the passenger aircraft has entered the circling area. Similarly, parachutists will not be dropped until a departing scheduled passenger aircraft is clear of the circling area. Parachutists' pilots will listen out on both the CTAF and area frequency, and will give an additional call 4 minutes prior to the planned exit. Parachutists will avoid conflicting with traffic on the live side of a licensed aerodrome (assuming a live side is defined by aerodrome traffic), nor will they intentionally land on any runway, taxiway or apron. Parachutists will not be dropped if another aircraft is conducting an instrument approach, or is expected to commence an instrument approach within 5 minutes after the planned drop. If the drop zone is on the aerodrome, the drop aircraft will usually proceed to a drop point upwind from the aerodrome, the distance being proportional to the wind strength and the release height. The exit point can be up to 4 miles upwind, which may at first appear to be clear of the circuit area. 2. Gliding operations.Gliding operations are also conducted at many non-controlled aerodromes used by a variety of traffic. Gliders may also overfly or land at aerodromes where no gliding operation is established. Again, protocols developed by CASA and the gliding movement are expressed in the AIP. Some of the main elements of this are: Gliders may be launched by aerotow, ground-based winch or car tow, or may be self-launching. Aerotow and wire launches may involve releases up to 4000 feet AGL. Overflying an active wire-launching site below 2000 feet AGL is not advisable. Pilots must be aware that if a launch cable breaks during a launch it may lie across a runway until cleared. Tug aeroplanes, winches and tow-cars will normally be radio-equipped. Gliders must monitor and broadcast on the CTAF if there is a scheduled service at the aerodrome. Elsewhere they must monitor the CTAF if they are fitted with radio capable of using the appropriate frequency. At locations where contra-circuits are notified in AIP ERSA there is no dead side to the circuit and all operations below 1500 feet AGL should remain on their own side of the runway. Traffic should join circuit on either an upwind leg over the runway, or a downwind leg. Any glider which thermals within 2nm/below 1500 feet AGL of the downwind end of the runway in use must be fitted with VHF and must monitor the CTAF, and are not permitted to interfere with other circuit traffic. Powered aircraft must give way to gliders, as gliders are committed to landing once established in the circuit, and may need to return to land if a launch is aborted or if sinking air is encountered after launch. Gliders, more so than powered aircraft, may need to vary their circuit patterns and fly a non-standard pattern during landing manoeuvres. 4.14.11 FURTHER READING Refer to the AIP or the VFR Flight Guide for further advice about circuit operations, particularly operations at aerodromes and landing places that have special characteristics or which support parachuting, gliding, military, aerobatics or various training operations. AIP ERSA contains the details of specific aerodromes and landing places. AIP AD contains technical information about aerodrome construction, marking and facilities. AIP NOTAMs are used to provide notice of events and changes. AIP Supplements and Aeronautical Information Circulars (AIC) are used respectively to convey details about special operations and procedure updates prior to their appearance in the AIP proper. 4.14.12 SUMMARY The need for sound airmanship is at its greatest at a busy non-controlled aerodrome, where all pilots must obtain and use all relevant information, observe the rules, use radio and lights where possible, maintain the best of lookouts, and practice patience and courtesy. Assistant Director Aviation Safety Standards STRICT COPYRIGHT JOHN BRANDON AND RECREATIONAL FLYING (.com)
 -
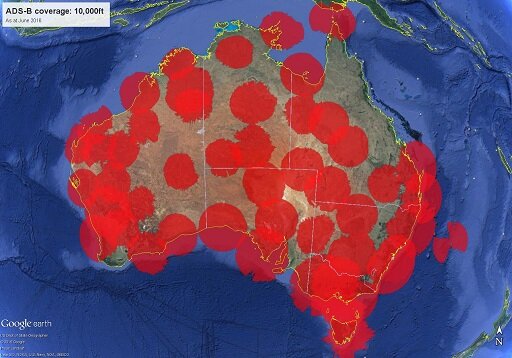 4.13.1 ADS-B navigation and surveillance technology system The concept The concept for the full ADS-B system is that all, or most, airborne aircraft operating in Class A, B, C and E airspace and Class G above 10 000 feet, automatically and continually (i.e. once or twice per second) squitter (i.e. broadcast automatically) several digital data packets which together contain the aircraft's ICAO 24-bit Aircraft Address code (the unique airframe identification assigned by CASA), flight identification (aircraft call sign), GNSS-derived position – latitude and longitude plus the integrity/accuracy of that position, its three-dimensional velocity; i.e. rate of climb/descent, direction in azimuth and speed. Pressure (or Mode C) altitude is provided by an altitude encoding device. The data packets broadcast from aircraft are received by Airservices Australia [AsA] ground stations, which feed the data to air traffic management [ATM] systems, providing more precise tracking than primary or secondary surveillance radars. The broadcast ADS-B packets are also received by all aircraft equipped with an ADS-B data receiver that are within range. The derived data provides a real-time cockpit display of traffic information, similar to the ground ATC systems except that the traffic is shown in relation to the receiving aircraft's intended track. The Mode S transponder, currently used for response to AsA's secondary surveillance radar network and as the standard air-air datalink in Traffic Collision Avoidance Systems [TCAS], is also used in ADS-B — with some enhancements. ADS-B broadcasts are via a ModeS1090 MHz Extended Squitter [1090ES] transponder link. The term 'extended squitter' refers to the additional [112-bit] ADS-B data packet, which is part of the enhanced Mode S transponder data link standards for ADS-B. However ADS-B, even in full operation, will not alter the VFR pilot's responsibility to 'see and avoid' other aircraft; ADS-B is seen as an aid to visual acquisition for VFR operations. Airborne avionics To achieve the full Airservices Australia ADS-B system concept, the onboard ADS-B avionics for general aviation and recreational aviation aircraft would have to include several functions or modes: data transmission. This provides data broadcast capability so that positional data, provided by a GNSS system plus an altitude encoding altimeter or a pressure altitude blind encoder, is continually broadcast. This is known as 'ADS-BOUT' capability and all aircraft ADS-B units must have this minimum function. The accuracy of the broadcast data is dependent on the positional/navigational data from the GNSS receiver which, in turn, is dependent on the availability of signals and the capability of the GNSS. A high-performance TSO* GNSS receiver is part of the system. *Note: a 'TSO' or technical standard order is a 'minimum performance standard issued by the FAA (CASA issues ATSOs) for specified materials, parts, processes, and appliances used on civil aircraft' data reception. This refers to the capability to receive all data packets broadcast by all ADS-B OUT units within an appropriate range data processing. This entails using the received data to provide a real-time plot of own and other aircrafts' tracks, speeds and altitudes; it is also known as a 'cockpit display of traffic information' [CDTI]. Data reception plus CDTI is known as 'ADS-B IN' capability, providing a pilot's own airborne surveillance and traffic alerting system — much the same as air traffic controllers may be viewing on their displays but completely independent of ATC. There are no regulatory proposals requiring use of ADS-B IN by any sector of aviation but it is the function that could benefit VFR recreational pilots, through enhanced situation awareness information. ADS-B implementation in the USA The United States Federal Aviation Administration [FAA] has decided that ADS-B transmission/data links in the USA will be via the Mode S 1090 MHz Extended Squitter [1090ES] surveillance link for aircraft that may operate above FL 180. For aircraft that only operate below FL 180 FAA has specified a Universal Access Transceiver [UAT] surveillance link using 978 MHz rather than use the 1090ES; mainly in order to reduce congestion on 1090 MHz. UAT is a bi-directional data link system developed in the USA, specifically for ADS-B operation, so that aircraft with a UAT transceiver can also receive the freely available Flight Information Service data broadcasts [FIS-B] from the FAA-maintained 978 MHz uplink network, in addition to an ADS-B traffic information service broadcast TIS-B]. FIS-B includes METARs, TAFs, SPECI, winds and temperatures aloft, pilot reports [PIREPs], restricted area status and NOTAMs. In Australia similar products are available in flight from Airservices NAIPS Internet Service via mobile broadband, see EFB software suppliers. The FIS-B facility also provides an animated NEXRAD weather radar service — similar to the Australian BoM weather radar network. UAT is not a transponder so UAT equipped aircraft also need a Mode S transponder for the secondary surveillance radars. Garmin released their portable GDL 39 ADS-B 1090 MHz/978 Mhz receiver and GPS receiver in June 2012, it can connect via Bluetooth to an iPad or iPhone to display the traffic information on a moving map. See the user guide. This particular device is built for the United State's ADS-B dual frequency environment and has no application in Australia. The current (November 2012) selling price in the US is $800. 4.13.2 The Australian ADS-B implementation program AsA has opted for 1090ES for all aircraft, except those operating under the VFR in Class D airspace or in Class G below 10 000 feet. CASA amended CAO 20-18 December 20, 2012 to reflect the following ADS-B OUT implementation time table: 9B Directions relating to carriage and use of automatic dependent surveillance — broadcast equipment 9B.8 On and after 12 December 2013, any aircraft that is operated at or above FL290 must carry serviceable ADS-B transmitting equipment that complies with an approved equipment configuration by meeting the conditions for approval set out in Appendix XI. 9B.9 An aircraft: (a) that is first registered on or after 6 February 2014; and (b) that is operated under the IFR; must carry serviceable ADS-B transmitting equipment that complies with an approved equipment configuration by meeting the conditions for approval set out in Appendix XI. 9B.10 On and after 2 February 2017, an aircraft: (a) that is first registered before 6 February 2014; and (b) that is operated under the IFR; must carry serviceable ADS-B transmitting equipment that complies with an approved equipment configuration by meeting the conditions for approval set out in Appendix XI. 9B.11 On and after 4 February 2016, an aircraft that is operated under the IFR in airspace: (a) that is Class A, B, C or E; and (b) that is within the arc of a circle that starts 500 NM true north from Perth aerodrome and finishes 500 NM true east from Perth aerodrome; must carry serviceable ADS-B transmitting equipment that complies with an approved equipment configuration by meeting the conditions for approval set out in Appendix XI. None of the above ADS-B OUT legislation affects aircraft registered with a Recreational Aviation Administration Organisation as no RAAO aircraft may operate under the IFR or will operate in class A or above FL 285 except perhaps an officially sanctioned altitude attempt. However, the following subsection of CAO 20-18 will apply from 6 February 2014 to any newly registered RA-Aus aircraft operating under the VFR that chooses to operate in any controlled airspace other than Class D. Such aircraft must be fitted with a serviceable Mode S transponder that meets the Australian standards for 1090 ES transponder equipment and for ADS-B OUT capability. This may create problems with imported aircraft. 9E Carriage of Mode S transponder equipment 9E.1 This subsection applies to an aircraft engaged in private, aerial work, charter or RPT operations. 9E.2 Subject to paragraph 9E.3, an aircraft: (a) that is: (i) first registered on or after 6 February 2014; or (ii) modified by having its transponder installation replaced on or after 6 February 2014; and (b) that is operated: (i) in Class A, B, C or E airspace; or (ii) above 10 000 feet amsl in Class G airspace; must carry a serviceable Mode S transponder that meets the standards: (c) for Mode S transponder equipment — in subsection 9C; and (d) for ADS-B transmission — in a clause or clauses of Appendix XI as follows: (i) clauses 2 and 5 of Part B; or (ii) clause 7 of Part C; or (iii) clause 8 of Part C. Note: The requirement is for aircraft to be fitted with a Mode S transponder with ADS-B OUT capability. That does not mean that ADS-B OUT transmission is also required under this paragraph. It means that, with the later connection of compatible GNSS position source equipment, ADS-B OUT can be transmitted as well as Mode S SSR responses. Note: Paragraph 9E.2 does not apply to an aircraft operating in Class E airspace or above 10 000 feet in Class G airspace, if the aircraft does not have an engine or sufficient engine-driven electrical power generation capacity to power a Mode S transponder. Otherwise, Australian sport and recreational aircraft that always operate under the visual flight rules below 10 000 feet and outside Class A, B, C and E airspace (the Class D areas are excluded) will not be affected by the ADS-B surveillance and separation service implementation, at least not before 2020. 4.13.3 Airservices Australia's ADS-B system The upper airspace program AsA states that ADS-B "is an air traffic surveillance technology that enables aircraft to be accurately tracked by air traffic controllers and other pilots without the need for conventional radar." To date AsA has deployed 58 ADS-B ground stations at 29 sites across Australia which, combined with SSR, provide ATC surveillance capability over the entire continent above FL290 (29 000 feet ISA). These first 29 locations established an Australian ADS-B network for ground-based air traffic management; i.e. an ADS-B OUT system. These stations, each with a range up to 200 nm, are co-located at existing VHF communication relay sites and linked to surveillance displays at ATC centres, which allows Airservices Australia to provide an SSR-like traffic separation service across the current non-radar airways above FL290. Of course these same ground stations also have the capacity for air traffic management at altitudes below 10 000 feet — but reduced range, being line-of-sight dependent. Currently in Australia the main Mode S transponder function is to allow aircraft equipped with Traffic Alert and Collision Avoidance Systems to 'talk' directly with each other, thereby enabling mutual resolution of potential traffic conflicts. Mode S can also provide faster, more accurate ATC surveillance, provided the ground radars are of the fast single pulse interrogation type such as those Mode S Terminal Area Radar equipment with solid-state primary surveillance radar and Mode A/C and S capable SSR systems at Coolangatta, Melbourne, Adelaide, Sydney, Cairns, Brisbane, Canberra, Darwin and Perth. The ADS-B OUT function is accomplished by upgrading an aircraft's existing Mode S transponder to 1090ES, and linking the GNSS system and the transponder. The upper air space program doesn't affect recreational aviation. The lower airspace program "A major, longer term program designed to make ADS-B the primary means of ground to air and air to air surveillance in Australian enroute airspace. Includes installation of additional ADS-B ground stations to provide air traffic surveillance in airspace currently covered by enroute radar facilities. Intended to lead to the eventual decommissioning of a number of radar sites." Initially an accelerated introduction of ADS-B surveillance into lower airspace was planned, but in the last quarter of 2008 it was agreed that a more gradual transition to satellite-based systems, harmonised with the North American and European transition plans, would be wiser. Airservices Australia is "proceeding with the replacement of its enroute radars and navaids as necessary to ensure the integrity of Australia's air traffic control system." (CASA's Notice of Final Rule Making – Transition to Satellite Technology for Navigation and Surveillance). "The timing and scope of future steps will be progressed through normal regulatory processes and will take into account ... outcomes of the Government's Aviation Policy Green Paper consultation." The Australian land area is about 7.5 million km² and the airspace included from ground level to 10 000 feet agl is about 21 million km³. Probably no more than 10% of the 15 000 registered aircraft are airborne at any time. So it is not surprising that the Australian history of recreational day VFR aircraft 'mid-airs' or 'near-misses' appears to be confined to the circuit area, to aircraft flying formation or to gliders sharing a lift source. Certainly a CDTI traffic display will alert a pilot in the vicinity of an airfield to the direction to look to avoid collision with another aircraft but the likelihood of collision with the ground in a stall/spin incident would seem to be increased if the VFR pilot's eyes remain in the cockpit checking a CDTI traffic display. CASA have published a 28 page ADS-B booklet dated November 12, 2012. There is also an 18 page Frequently Asked Questions pdf document. STRICT COPYRIGHT JOHN BRANDON AND RECREATIONAL FLYING (.com)
 -
 The Global Navigation Satellite System (GNSS) technology, combined with a current, accurate and approved aeronautical database, normally provide excellent position-fixing capability — and continuing 'heading-to-steer' capability, when associated with a stored flight plan. GNSS is classified as a supplemental-means VFR navigation system. However, contrary to good sense, some sport and recreational pilots (and others) do rely on GNSS receivers — plus electronic on-screen position tracking (e.g. a moving map display with own aircraft position centred) — as a primary-means navigation system. Electronic flight planning software has been available for many years but the concept of the sport and recreational aviation 'electronic flight bag' (EFB) is introduced when a tablet computer with inbuilt or external GNSS reception is used for flight planning plus storage of — and inflight reference to — documents such as the following: aircraft flight manual/pilot's operating handbook; ERSA and the AIP book; ARFORs and NOTAMs; and georeferenced Airservices Australia digital aeronautical charts. The EFB is perceived as an aid to situational awareness and is not a CASA approved navigation system. So, electronic flight planning and electronic VFR situational awareness aids are becoming the norm for many recreational pilots, not least because of the availability of: powerful, reasonably priced, reliable, general purpose, portable touchscreen tablet computers, with inbuilt and/or external GNSS connectability, though perhaps not so easy to operate in normal flight conditions in very light aircraft — recognised in aviation as a 'portable electronic device' [PED] smartphones and very fast broadband 3G/4G-LTE cellular mobile telephony networks expanding around Australia plus the availability of WiFi area networks and Bluetooth personal area device interconnection and data transfer, all facilitating surface and inflight access to SIGMETs, BoM weather radar, lightning trackers and other information aids to situational awareness. But the cellular mobile communication services class licence does not authorise the use of any mobile communication device in an airborne aircraft unless in an airliner equipped with a 'pico cell' unit operating under a public telecommunications service licence high quality operating systems and inexpensive iOS/Android/Windows application software packages readily available to all via the internet and the NAIPS Internet Service multi-function, computerised, subscription-free, aeronautical information system provided by Airservices Australia and the Australian Bureau of Meteorology. The current situation enables any reasonably computer adept person to put together a system of software, GNSS aviation receivers, general purpose (rather than aviation-oriented) hardware and navigation databases tailored to their particular aviation needs. All accomplished in accordance with the civil aviation advisory publication CAAP 233-1(1) and at rather low cost — if well researched and done carefully. CAAP 233-1(1) 'provides information and guidance in the use of portable Electronic Flight Bags as a replacement* for paper in the flight compartment'. *Though it is still prudent to carry back-up paper charts. 4.12.1 Navigation system performance criteria There are four parameters for assessing the performance of a navigation system: integrity, accuracy, availability/vulnerability and continuity of service. Integrity refers to the trustworthiness of the device, i.e. user assurance that the data being provided by the device/s meets specified standards and that the system will alert the user when it is not meeting those specified standards. For example, any GNSS system that fails to immediately and adequately inform the pilot when it enters 'dead reckoning' mode certainly does not meet the integrity standard. If a particular system is demonstrated to satisfy all four parameters for a flight phase then it may be classified as a sole-means navigation system — for that phase and thus require no back-up navigation system. When operating under the day visual flight rules, en route navigation by map reading and visual reference to the ground satisfies all four parameters and is the only sole-means system available to RA-Aus aircraft. If a system meets the integrity and accuracy requirements all the time, but falls short on availability/vulnerability or continuity of service, it may be approved as a primary-means navigation system for a flight phase, if specified procedures are employed. Day VFR navigation does not use primary-means systems, only the sole-means system plus supplemental-means systems as required. A supplemental-means navigation system may only be used in conjunction with a sole-means navigation system, but it must meet the integrity and accuracy requirements. Pilots operating under the VFR may use GNSS to supplement map reading and other visual reference en route navigation techniques. Any GNSS receiver may be used but if it is an installed receiver (i.e. not portable) it must be fitted in accordance with CAAP 35-1 or AC21-36; see AIP GEN 1.5 section 8.5.4. GNSS is only officially regarded as a primary-means night VFR navigation if the GPS/Glonass receiver system accords with the FAA's Technical Standard Order [TSO] C129 or TSO C145/6 series, or has other CASA approval. The GPS/GLONASS receiver may supply position data to a portable electronic device as part of a supplemental-means navigation system. For more information concerning the use of GNSS in VFR navigation see AIP ENR 1.1 paragraphs 19.2 and 19.5. Note the wording of sections 19.2.1e and 19.5.1d together with the latter's link to AIP GEN 1.5 section 8. Also see the CASA document 'Instructions — use of GNSS' that came into effect 1 November 2012. 4.12.2 Digitised aeronautical charts VFR charts available Airservices Australia's WAC, VNC, VTC, ERC-L and PCA charts are also available in geoTIFF* digital format redistributed by a few Australian flight planning software producers. These organisations have entered a Standard Data Licence Agreement with Airservices Australia [AsA] enabling the inclusion of AsA map packs as part of their software package; such agreements limit the usable life of each chart within the application. AsA will not sell digital charts direct to the general public and since Maptrax Australia withdrew from that market sector there are no retailers of AsA VFR charts [at March 2013] except for those included in an EFB package for iPad systems. *Note: geoTIFF = geographic tagged image file format with the necessary georeferencing data embedded as metadata. Considering that most Australian controlled airspace below 8500 feet amsl is within 100 nm or so of the coast-line then, outside that coastal fringe, there is little VNC/VTC coverage and the 1:1 million scale of the WACs is a rather small scale for light aircraft pilotage — the sectional charts that are the standard United States VFR navigation chart are 1:500 000. The NATMAP 250K series are 1:250 000 transverse Mercator projection charts (with an optional latitude/longitude graticule) providing a good, larger-scale navigation solution for much of Australia, even though they contain no aeronautical data. As with a paper map, digitisation and the necessary software allows the user to mark up the chart with any information considered pertinent, even allowing permanent storage of several versions of the one chart, and the NATMAP 250K series are valid for several years. Airservices Australia's Visual Terminal Charts are based on the NATMAP 250K series with a latitude/longitude graticule. The digitised NATMAP 250K series may be purchased from Geoscience Australia. The 513 maps of the series are available on DVD, in .ecw format, for about $100 which is less than 3% of the cost of the paper series and well worth having as home reference material — even if you don't use them in flight. Raster and vector maps A raster map or image (such as that from a digital camera or a scanner) is a matrix or grid of rows and columns, each cell being a picture element (pixel) with a discrete colour value — a bit-mapped image — a BMP, TIFF, JPEG, GIF or PNG file. When a paper map is scanned to produce a geoTIFF raster image file latitude/longitude control points have to be identified and stored as metadata (i.e. georeferenced) together with other essential information such as the map projection, coordinate system, datums, pixel cell scale (e.g. metres per pixel) and latitude/longitude of the first pixel (i.e. the top, left hand corner cell). PDF files may be either raster or vector files. A vector map is a series of mathematically defined points (e.g. airfields, peak elevations), lines (e.g. controlled airspace boundaries, rivers, railways, roads), and polygons (e.g. shapes – towns, lakes, PRD areas) stored as a data file; GPS devices draw their vector maps by plotting the data read from their aeronautical database files. Such maps are usually made up in information layers that allow the display to be de-cluttered by the user as required. Vector graphics are 'rasterised' for display on digital screens. 4.12.3 Airservices Australia's integrated aeronautical information package Aeronautical Information Service [AIS] Some parts of AsA's integrated aeronautical information package [IAIP] may be freely downloaded from the AIS site provided you agree to the terms and conditions of the copyright notice. The .pdf format publications of interest to VFR pilots are the aeronautical information publication [AIP] often referred to as the AIP book, ERSA, the AIP supplements [SUPP] and aeronautical information circulars [AIC]. The documents are in pdf format. The Designated Airspace Handbook [DAH] is also included, it contains 272 pages of tables detailing, for example, the precise location of controlled airspace boundaries either straight line point-to-point or point-to-point arcs of a circle with the centre point location and radius stated, VFR and IFR waypoints — the latter where latitude/longitude may be expressed to 100th of a second [about 30 cm], and much other material. Navigational information datasets In manual flight planning, basic navigational information is obtained from printed documents — ERSA, AOPA airfield directory, ERC-L, VNC, VTC and other reference charts — that contain details concerning airfields, navigation aids, air route intersections, special use airspace, airspace boundaries, magnetic variation and communications frequencies; obviously location latitude, longitude and elevation are particularly important needs. The digital version of such print information is the aeronautical navigation database, see the standard datasets that Airservices Australia markets for creation of such databases. There is a world standard — ARINC 424 — for the format of data intended for navigation system databases. Each data record is 128 bytes (128 characters) in length and made up of primary records and continuation records. The position of the data fields within each type of record is fixed, for example in a waypoint primary record latitude occupies byte positions 33-41, longitude 42-51 and local magnetic variation 75-79. There are three 128 byte continuation records for a waypoint. The database records are transferred as text, comma-separated values [.csv] files perhaps. Obviously it is most important that the data originator of the database material — AsA — has a quality assurance system that guarantees the viability of the data. The data for airfields that are not contained in the standard AsA database might be provided in a supplementary database by the software supplier. The need for absolute assurance that location coordinates and other critical data have been correctly ascertained and entered by the supplier, cannot be over-emphasised. Aeronautical briefing information — the NAIPS Internet Service Other parts of the IAIP — NOTAMs and pre-flight information [PIB] are downloadable from the NAIPS Internet Service [NIS], 'a multi-function, computerised, aeronautical information system. It processes and stores meteorological and NOTAM information as well as enabling the provision of briefing products and services to pilots and the Australian Air Traffic Control platform'. NIS is accessed through the internet with any web browser or access is integrated within flight planning software or within an IPhone app. The Bureau of Meteorology provides all the weather products to the NIS. You must register with AsA before you can access the NIS. For further information see 'Airservices Australia's online meteorological briefing and NOTAM system'. 4.12.4 The electronic flight bag The Australian regulatory status The electronic flight bag [EFB] document reader concept has been utilised, to some extent, for many years by some of the world's airlines, but the burgeoning world-wide public acceptance of tablet computers — led by the Apple iPad — has prompted the ICAO and national airworthiness authorities to expand the regulations and enhance developments directed toward a paperless flight deck/cockpit. An EFB may incorporate a flight planning tool to facilitate the use of the data/documents stored in the EFB, both pre-flight, flight and post-flight. In 2007 the United States FAA released the document AC 91-78 'Use of Class 1 or Class 2 EFB'. That advisory circular is still current (November 2012) and applicable to Part 91 VFR preflight, flight, and post flight operations in the USA. In June 2012 the FAA published AC 120-76B 'Guidelines for the Certification, Airworthiness, and Operational Use of Electronic Flight Bags'. AC 120-76B is directed at the airline transport industry but also intended as a guide for US Part 91 aircraft (mostly general aviation). In November 2012 the CASA released a 'notice of final rule making' including an advisory publication CAAP 233-1(0). (The AWB 00-017 issue 2 of May 2010 was cancelled at that time.) The CAAP defines the EFB as: 'A portable Information System for flight deck crew members which allows storing, updating, delivering, displaying and/or computing digital data to support flight operations or duties.' The CAAP provides general guidance for private pilots and states 'The EFB, with GPS functionality, may be used for situational awareness only. It is not an approved navigation system and cannot be used as the primary means of navigation.' In CAAP 233-1(0) the recommended minimum display screen size was A5 (210 × 148 mm and 257 mm diagonally). The A5 paper-based dimension ratios of 1.41:1 don't equate with the common display screen dimension ratios, e.g, 1024 × 768 pixels is 1.33:1 so, at 197 × 148 mm, the iPad screen is as close as a 1024 × 768 pixel display can get to CASA's A5 recommendation. The iPad Mini dimensions are about 162 × 122 mm and 201 mm diagonally; its display area is about 64% of A5 area. However CASA reviewed their recommendation and issued CAAP 233-1(1) dated 24 August 2013 now recommending a minimum display screen size of 200 mm diagonally across the active viewing area, i.e. the iPad Mini. The iPhone display is probably too small for satisfactory map reading. CASA recommends that a tablet computer should be dedicated to the EFB/flight planning/flight monitoring functions, however it is up to the pilot-in-command of a light aircraft to ensure that a tablet has sufficient/ample capacity for other functions without any chance of affecting the inflight EFB function. CAR 233 requires pilots to carry the latest editions of the aeronautical maps, charts and other aeronautical information and instructions published in AIP or by holders of an 'instrument of approval' . The CASA has the responsibility to regulate the provision of aeronautical information services thus CASA, not AsA, is the approval authority under CAR 233 (1) (h) and 1A; of course AsA is a CASA approved document supplier and their documents do not need additional approval if they have been stored in an EFB in essentially the same form as the original AsA document. At September 2013, CASA has issued written acceptance of quality assurance capabilities for appropriate redistribution of AsA digital VFR/IFR charts and other database material, as part of an EFB package, to only two Australian companies – OzRunways and AvSoft. Jeppesen and Lufthansa System's Lido have an instrument of approval for IFR charts. A notice of proposed rule making — NPRM 0901AS — for CASR Part 175 'Aeronautical information services' was published in 2009 (associated with AsA's intention to change from AIS to aeronautical information management [AIM]) but no notice of final rule making has yet been issued. The proposed 'certificates of authorisation' for persons to act as data service providers will specify requirements to demonstrate that the aeronautical data and information they publish (that pilots are permitted to use as an alternative to the AIP) is equivalent to the aeronautical data published in the AIP and on aeronautical charts, and the service provider's systems and procedures do not introduce errors. In November 2012 an amendment to CAO 82.0 was published adding the requirements to be met for the use of an EFB, by the pilot in command of an aircraft operated under an Air Operator's Certificate, as a means of complying, or partially complying, with CAR 233 (1) (h). (Private pilots may use their own pilot in command authority to approve use of an EFB, bearing in mind the guidance material in CAAP 233-1(0).) The following are extracts from CAO 82.0 Appendix 9 summarising definitions which are likely to also appear in future rules applicable to sport and recreational aircraft: Electronic flight bag, or EFB, means the portable electronic device of an EFB system that satisfies all of the following requirements: (a) it is not an instrument, equipment or navigation computer to which CAR 207 [Requirements according to operations on which Australian aircraft used], CAR 232A [Operational procedures in relation to computers] or CAO 20.18 [Aircraft equipment - Basic operational requirements] apply; (b) it provides, as a minimum, data storage, search, computational and display capabilities; (c) it uses a screen which displays data in a size and form that is at least as easily read and used as it would be in a paper document for which the EFB would be a substitute; (d) it is used primarily by the flight crew for the purpose of accessing and using data relevant to the operation of the aircraft EFB system means the hardware, the operating system, the loaded software and any antennae, connections and power sources, used for the operation of an EFB Class 1 EFB means an EFB that is portable but not mounted (on the aircraft) Class 2 EFB means an EFB that is portable and mounted (on the aircraft) Note: Class 1 and Class 2 EFBs are portable electronic devices [PEDs] and limited to functionality level 1 and 2 software. Functionality level 1 means that the EFB: (i) is used to view the aeronautical maps, charts, and other aeronautical information and instructions mentioned in CAR 233 (1) (h) but without the functionality to change any of that data; and (ii) may have a flight planning tool to facilitate the use of the data mentioned in subparagraph (i); and (iii) may be 1 or more of the following: (A) held in the hand; (B) mounted on an approved mount; (C) attached to a stand-alone kneeboard secured to a flight crew member; (D) connected to aircraft power for battery re-charging; (E) connected to an installed antenna intended for use with the EFB for situational awareness but not navigation; and (iv) unless secured in accordance with sub-subparagraph (iii) (B) or (C) must be stowed: (A) during take-off and landing; and (B) during an instrument approach; and (C) when the aircraft is flying at a height less than 1 000 feet above the terrain; and (D) in turbulent conditions; and (v) has no data connectivity with the avionics systems of the aircraft; and (vi) may have wireless or other connectivity to receive or transmit information for EFB administrative control processes only Functionality level 2 means that the EFB: (i) must have the functionality of functionality level 1; and (ii) subject to subclause 1.4, has 1 or more software applications that use algorithms requiring manual input to satisfy operational requirements; and (iii) has no data connectivity with the avionics systems of the aircraft; and (iv) may have wireless or other connectivity to receive or transmit information for EFB administrative control processes only Note: examples of software applications that use algorithms requiring manual input to satisfy operational requirements include weight and balance calculations, or performance calculations required by the aircraft's approved flight manual, e.g. density altitude and take-off distance required. EFB software suppliers As mentioned above there are a few Australian producers of flight planning software who have entered a Standard Data Licence Agreement with Airservices Australia enabling the inclusion of the AsA map packs as part of their software package. Two of those flight planning software producers market the concept of a tablet computer/mobile broadband hardware system combined with EFB + flight planning + GNSS + flight monitoring software. At November 2012 the software from both producers is only Apple iOS compatible and intended for the iPad, but it can be installed in an iPhone for ground use — iPhone hardware does not meet the CASA's expectations for flight use. Note: it is the pilots legal requirement to carry the current maps and charts for the sector to be flown, that have been approved by CASA. At September 2013 two EFB products have been approved by CASA for VFR pilot use [see above] as an alternative to the AIP paper publications, so other EFB products cannot be used as an inflight substitute for the paper charts sourced from Airservices' AIS. Thus until an instrument of approval has been received by the relevant data service provider, AsA's paper charts must be available in flight; another electronic device cannot be nominated as a back-up system. With two data service providers holding a CASA instrument of approval for the digital WACs and VNCs private VFR pilots are able to use an acceptable tablet computer, rather than paper charts, as the primary means of in-flight documentation. Even so, although an EFB is a paper replacement system, it is prudent to carry back-up paper charts. During 2012-2013 the CASA flight operations inspectors were surveying iPad and flight planning software usage when conducting ramp checks. EFB suppliers sell their VFR software product on a remarkably low cost annual subscription basis — at November 2012 around $75 p.a. The subscription includes the complete AsA VFR digital chart pack for Australia and the updates of charts and other aeronautical data in accordance with AsA's standard update cycle; it also includes software updates/expansions. Those data service suppliers might alter the AsA product; for example the 43 WAC charts have overlapping seams and the EFB supplier might 'stitch' all the individual charts together to produce one very large seamless mosaic. Locality names, or parts of names, may disappear from the seamless mosaic. Such activity, being an alteration of the AsA material, may be prohibited within a CASA approval instrument. Data service providers approved under CAR 233 (1) (h) must also ensure that all database material supplied cannot be modified by the user. The freely available Aeronautical Information Publication plus updates is also included in the package — the EFB supplier may add a search facility for ERSA and the AIP book. Mobile broadband service provider's charges are, of course, an additional cost to be considered. Although there may be a GPS engine included in the hardware it is recommended that an external GNSS aviation receiver engine be linked to the hardware. There are packaged GNSS engines available which output the navdata, via a Bluetooth connection, to an iPad, iPhone, Android or other display device. The cost for aviation types is $75 to $150. For example the Garmin GLO for aviation costs about $150 and receives position date from GLONASS and GPS satellites (thus 48 satellite potential) with an update rate of 10× per second. Weight is 60 grams and USB connection also available. Note: from 2 February 2017 all aircraft operating under the instrument flight rules must carry ADS-B OUT equipment. It is probable that many of those aircraft will also install ADS-B IN. It is then likely that a tablet type computer, linked to the ADS-B receiver, could be used for the cockpit display of traffic information. The mobile broadband connection allows inflight connection to BoM weather radar, internet lightning trackers, regular checking of the NAIPS Internet Service for changed information relative to the flight plan (SIGMETs and SPECI for example) and to overlay that information graphically on the moving map display. Note: the use of a cellular mobile voice or data communication device in an aircraft — that is not equipped with a picocell base-station — is not in accordance with the class licence that legalises personal transmissions from a mobile telecommunications device; see further information about the Radiocommunications (Cellular Mobile Telecommunications Devices) Class Licence 2002. The EFB suppliers' products are: AvPlan — from AvSoft. OzRunways EFB — from OzRunways. It is suggested their manuals be downloaded for full information. 4.12.5 Electronic VFR flight planning Basic needs Good electronic VFR flight planning should only differ from the manual flight planning steps outlined in sections 3.4 to 3.6, in that digitised topographical charts and graphical flight planning software — rather than paper, protractor, E6-B etc — are used to plan, and finally plot, the route. The graphical flight planning software downloads weather and notams from Airservices Australia's NAIPS Internet Service; provides tracks, distances, magnetic headings, times, fuel burn etc and stores the final flight plan in digital format and, if required, uploads a flight notification with sartime to NIS. When airborne there is only a slight difference in pilotage where the navigator — while still reading from map to ground — is primarily relying on a cursor on a digitised moving AsA topographical chart to display current position and then confirming it with the ground. The significant difference in airborne sport and recreational aviation navigation is in using the flight plan plus GNSS reception to provide in-flight data, warnings and corrections necessary to arrive at the planned destination safely, avoiding PRD areas where necessary and without infringeing controlled airspace. That indicates the vital importance of working with a complete, current and absolutely accurate aeronautical database. Proper use of VHF radiocommunication frequencies is an adjunct to normal VFR navigation procedures. In flight the software should facilitate any necessary changes to the plan and recalculate all relevant data. For VFR operations outside controlled airspace, electronic planning and navigation should follow much the same manual procedures described in the preceding modules of the navigation tutorials: accessing airfield and airspace information planning the waypoints/landing points/alternates for a safe route — using PCA, WAC, VNC, VTC and ERC-L charts — taking controlled and PRD airspace into account accessing all applicable TAFs, ARFORs, METARS, NOTAMs, surface charts, BoM radar images and AWIS doing the E-6B calculations and producing a preliminary flight plan determining beginning/end of daylight assessing fuel needs establishing the VHF communication frequencies applicable to each section of the flight filing the flight plan with the NAIPS Internet Service or emailing a flight note to a responsible person facilitating the weight and balance checks calculating density altitude and take-off/landing distance required facilitating aircraft checklist run-through monitoring flight by checking from digital map display to ground making the necessary en route flight path adjustments and revising the flight plan timing, fuel needs etc. In addition — as a flow-on from the glass primary flight displays and multi-function displays of larger contemporary IFR aircraft — the availability of relatively inexpensive non-certified electronic flight instrument systems [EFIS] is increasing. Such non-certified systems can be installed legally in RA-Aus amateur-built category aircraft — although there will be a regulatory problem if a non-certified EFIS is providing altitude encoding to a transponder. These flight instrument systems are microchip-based (including micro electro-mechanical gyroscope devices and acceleration sensors) and, in the future, are likely to provide increasing data transfer to or from other avionics within electronic communications, navigation and surveillance technology. VFR flight planning software packages There are several Australian flight planning software packages currently available that have a solid history of development and provide similar VFR application Command Flight Planner from Command Software is a Windows product. IFR oriented but there is a facility to overlay the flight plan on a Google Earth image. The route can be exported to a GPS via a .gpx (GPS exchange format) file. An excellent screencast provides a demonstration of the flight planning procedure, for an IFR flight, but the procedure for a VFR flight is similar. Purchase price is about $400; the annual fee for software updates plus updates of AsA aerodrome, airway, and airspace data in line with ERSA issue dates is less than $100. Flight Planner 3000 from Champagne PC Services is a Windows product. Software has database waypoint route planning with selectable display — but does not include digitised topographical charts, so it may not provide increased VFR situational awareness. The route can be exported to a GPS via a .gpx file. Purchase price is about $400; the annual fee for updates of AsA aerodrome, airway, and airspace data is less than $100. AirNav VFR — from Sentient Software. A Windows system, AirNav VFR comes bundled with one of five VFR map packs containing Airservices Australia's charts, at a cost from about $120. There is an optional discounted subscription for the biannual chart reissues. Each chart pack contains all WACs, VNCs, VTCs and ERC-Ls relevant to the area; for example the south-eastern Australian pack contains 8 WACs, 3 VNCs, 9 VTCs and 4 ERC-Ls. The software prevents access to the stored VNCs, ERC-Ls and VTCs two weeks after the official chart expiry date, but the access to WACs is not time-limited. STRICT COPYRIGHT JOHN BRANDON AND RECREATIONAL FLYING (.com)
 -
 4.11.1 Tracking to an NDB A useful ADF application in visual navigation is to locate a particular NDB and then track — or home — directly to it. The ADF receiver is tuned to the NDB frequency, and the audio volume turned up, so that the NDB can be identified as soon as the aircraft comes within range. The ADF needle indicates the bearing to the NDB. The wind correction angle necessary to maintain that track is then ascertained by bracketing, a technique that bears some similarity to the double track error method. The term 'bracketing' is derived from the artillery technique for ranging the target by deliberately placing initial rounds behind and in front of it. Note: this sequence is best performed if the heading being flown is positioned on the ADF card at TDC. The diagrams in the left column below indicate the readings with those settings. PROCEDURE Needle position Compass heading Event sequence 060° Position A. When receiving the NDB signal turn the aircraft so that the head of the ADF needle is pointing to TDC, then check the heading from the compass. That heading is the track required to home directly to the NDB; for our example, 060° magnetic. Rotate the ADF compass card to set 060° at TDC and the needle head will also indicate 060°. Remember that all heading changes should be logged. 060° Position B. As the flight progresses, holding the 060° heading, the crosswind causes the aircraft to drift to the south of the required track and the ADF needle has moved left about 5° to 055°. 030° Position C. We now have to make a first rough cut at the track error — it is best to initially overestimate so let's choose 15° and, applying the double track error technique, we turn left 30° onto an intercept heading of 030° magnetic. Positioning the 030° heading at TDC, the head of the needle will still initially indicate 055° but will move towards 060° as we close with the required track. 045° Position D. When the needle reaches 060°, the 060° track to the NDB has been regained. Now halve the intercept angle (i.e. subtract the track error) and turn right onto an initial wind correction heading of 045° magnetic; i.e. the estimated track error was 15°, we turned left 30° onto the intercept heading of 030° and now, having regained the required track, we turn right 15° onto a wind correction heading of 045°. Now rotate the card to the 045° heading and the needle remains at the 060° bearing. 045° Position E. If the 15° WCA is correct then the ADF needle will remain at the 015° position whilst the 045° heading is maintained. However, it is most likely that we have overcorrected. The aircraft will drift north of track, shown by the needle moving clockwise a few degrees from the 015° position — so we now have to refine the wind correction angle. 055° Position F. We might guess that we have overestimated the WCA by about 5° so, applying the double track error technique, we turn right 10° onto an intercept heading of 055° magnetic. Positioning the 055° heading at TDC, the head of the needle will still initially indicate something greater than 060°, say 063°, but will move towards 060° as we close with the required track. 050° Position G. When the needle reaches 060°, the 060° track to the NDB has been regained. Now halve the intercept angle and turn 5° left onto a wind correction heading of 050° magnetic, rotate the card to the 050° heading and, if we've estimated correctly, the needle will remain at the 060° bearing, maintaining a 10° WCA, while we continue along the required 060° track to the NDB. 4.11.2 Tracking from an NDB Another useful application for the ADF in visual navigation is in determining track error when departing from an airfield equipped with an NDB or when overflying an NDB. For example: the flight plan calls for a departure — from overhead an NDB — on a track of 240° magnetic. Any necessary wind correction is to be assessed after departure, using the ADF, with the track recovery and heading correction to be made by a slightly modified double track error method. (The modification is that rather than timing the intercept leg to estimate track recovery we will use the ADF needle to indicate when we are back over the required track.) In this ADF application the ADF card may be used with the 0° position set at TDC or your personal preference may be to set the 240° heading at TDC. The diagrams and the text below indicate the procedure and the readings with 0° positioned at TDC, but the additional text in italics is the procedure when rotating the card to the new heading for every change. Hopefully you will be able to see that the latter method is easier to handle. Note that when tracking away from an NDB we use the tail of the ADF needle, rather than the head, as the indicator. PROCEDURE Needle position Compass heading Event sequence 240° Departing from overhead the NDB to track 240° magnetic. The magnetic compass heading is 240° (i.e. no wind correction provision) and the tail of the ADF needle swings to the 0° position. With the 240° magnetic heading set at TDC the position of the needle relative to TDC is exactly the same as in the diagram but, on the background card, the needle tail indicates the 240° heading. 240° Position B. As the flight progresses holding the 240° heading, the crosswind causes the aircraft to drift to the south of the required track. The tail of the ADF needle has moved about 15° to 345° and is in the left half of the card. Thus the opening angle, or track error, is 15° and the tail of the needle represents the track made good, which is 15° to the left of the required track. With the 240° magnetic heading set at TDC the tail of the needle will indicate the track made good, 225° or an opening angle, or track error, of 15°. 270° Position C. Use the double track error method to intercept the required track. The aircraft is turned 30° (2 × 15) onto a heading of 270° magnetic. The ADF needle tail initially moves 30° to 315° then commences to reverse direction as the 270° heading is maintained and the aircraft is closing the 240° track out. The aircraft is turned 30° (2 × 15) onto a heading of 270° magnetic, and 270° magnetic is now set at TDC. The tail of the needle will then initially still indicate 225° but will move towards 240° as you close with the required track. 270° Position D. When the needle has moved through a 15° arc and is back to the 30° left position (330°), on a heading of 270°, the 240° track out from the NDB has been regained. With the 270° magnetic heading set at TDC, the 240° track out from the NDB has been regained when the tail of the needle reaches 240°. 255° Position E. Subtract the track error (15°) and turn left onto the new heading of 255°, which will then maintain the necessary 15° wind correction angle. The ADF needle moves 15° clockwise and the aircraft should hold the required track – if the heading is maintained and the needle kept at the 345° position. Subtract the track error (15°) and turn left onto the new heading of 255°, which will then maintain the necessary 15° wind correction angle. Set the 255° magnetic heading at TDC — the tail of the needle now indicates 255°. After flying this heading for a while you may find that you still have some drift, which is indicated by movement of the needle. In this case a small heading correction is usually enough compensation. 4.11.3 Running fix/distance from NDB Whenever your track will pass abeam an NDB, it is quite easy to obtain a running fix using the 1-in-60 rule and a little mental arithmetic, providing you have a reasonable idea of your ground speed. The technique is illustrated in the diagram. Procedure 1. Tune and identify the NDB, set your heading at TDC and watch the ADF needle. The NDB is directly abeam when it moves to 90° either side of TDC, position A in the diagram. 2. Note the time and continue flying your heading, for example 040° magnetic. 3. When the needle has moved a sufficient amount to get a good reading (position B on the diagram), note the time and the bearing from the NDB, indicated by the tail of the needle. Let's say the needle has moved 10°, the elapsed time is 8 minutes, the bearing from the NDB is 110° magnetic and you reckon your ground speed at 70 knots. 4. Now we calculate the distance we are along that bearing using the 1-in-60 rule: i.e the distance (nm) from the NDB = elapsed time (mins) × ground speed (kn) degrees traversed = 8 × 70/10 = 56 nm. The aircraft's position at time B is then 110°/56 nm from the NDB. The real difficulty now is to measure and plot that position on the navigation chart (not forgetting to convert the bearing to degrees true) so perhaps get the passenger to do it while you fly the aircraft. It is always a good idea to get your passenger involved in the flight. If you are wondering what happened to the '60' in the 1-in-60 application the answer is that it is negated by the usage of minutes in one factor and nautical miles per hour in another. In the diagram, the dashed red line outlines the right angle triangle on which the calculation is based — the distance from the NDB to position B forms the hypotenuse. 4.11.4 ADF simulation If your browser is Java-enabled then I suggest a visit to FergWorld and try out the ADF trainer applet. Drag the aircraft symbol to position your aircraft then set the aircraft's heading on the directional gyro and read off the bearing to/from the NDB. Note the ADF card is non-rotatable. Try the quiz. STRICT COPYRIGHT JOHN BRANDON AND RECREATIONAL FLYING (.com)
 -
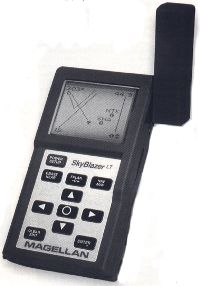 4.10.1 Global navigation satellite systems [GNSS] Future development GNSS is the generic term covering satellite-based, three-dimensional position fixing, timing and navigation systems. The first such — and currently dominant — system is NAVSTAR or GPS, initially developed by the United States Department of Defense for position fix coordination of the inertial navigation systems [INS] on board military aircraft and cruise missiles. GPS has since become freely available — as a valuable primary and supplemental navigation aid — to civilian aircraft of all types and all nations, with the compliments of the U.S. government. The Russian GLONASS GNSS system now has 24 satellites in orbit and providing world coverage. Some GPS receivers can utilise both GLONASS and GPS satellites singly or jointly. The European Union's Galileo GNSS system is undergoing trials with several satellites in orbit and is scheduled for full operation capability by 1920. China's national satellite system is being expanded into 'Compass', a 35 satellite GNSS system. Massive growth is expected in the application of the satellite navigation systems, with aviation being a very small part of the total market. The European GNSS Agency 2012 world market estimate is $48 billion and the 2020 market forecast is $128 billion. The split-up by market sector for cumulated revenues from GNSS devices for the period 2010 to 2020 is: Road: personal navigation devices and in-vehicle devices – 54% Location based services: smart phones etc – 43.7% Aviation – 1% Agriculture – 1% Land and hydrographic surveying – 0.6% Commercial maritime – 0.1% It is estimated that 80% of all applications would be satisfied by a one standard deviation accuracy of one metre. (One standard deviation refers to a statistically normal distribution where 68% of all measurements will be within that accuracy.) The European Space Agency's new [2011] Navipedia website contains a large store of information regarding GNSS in general and Galileo in particular. For a more generalised GNSS overview download the Navipedia Galileo booklet. The Global Positioning System GPS or the NAVigation Satellite Timing And Ranging [NAVSTAR] system consists of a minimum 24 satellites (of which usually three are operating spares) orbiting Earth at an altitude around 19 000 km, with each unit taking about 12 hours to complete one orbit. The NAVSTAR orbits are arranged in six planes with three or four satellites in each plane. This configuration ensures that a minimum of four satellites would be in view from most locations on Earth at any time. Each NAVSTAR unit is solar powered and equipped with atomic clocks for extremely accurate time measurement. The satellites have an operational life of around 10 years, so there is a continuing replacement program, which also allows phased introduction of new technology and expanded facilities. Early launch of replacements plus satellite trials often provides more than 30 units in orbit. Initial Operating Capability was established in 1993 with 24 operational NAVSTAR units in orbit. NAVSTAR satellites continuously broadcast information on very low power at two UHF L band frequencies. The civilian standard positioning service [SPS] 'coarse/acquisition' ranging code at 1575.42 MHz (the L1-C/A code) and an encrypted precise positioning service code (the PPS code) at 1227.60 MHz. The L1-C/A code is freely available to all while the PPS code is only available to authorised users — chiefly military. The basic L1-C/A code is designed to provide a latitude/longitude position-fixing accuracy within 300 metres 99% of the time and within 100 metres laterally and 140 metres vertically 95% of the time; but probably better than 30 metre lateral accuracy is achievable most of the time without augmentation. Some manufacturers quote accuracies of 3 metres, or less. At present it is far more accurate than necessary for flight under the VFR though perhaps the higher accuracies might be valuable if using georeferenced taxiway diagrams at a major airport. All civilian GPS receivers are SPS units receiving the L1 code, however a new, easier to track civilian signal [L2C i.e. Civilian] has been added at 1227.60 MHz to provide some redundancy and improve accuracy for dual-frequency receivers. The accuracy obtained is said to be as good as that obtained with the military PPS code. Each satellite continually transmits three sets of information contained in the L1 code navigation message: its own ID, current date and time ephemeris* data that the receiver uses to calculate the precise position of that satellite at the start of the navigation message and which includes current orbital position data and predicted orbital positions for the next few hours plus its 'health' status almanac data providing future orbital position and time information for all the currently operational GPS satellites in the constellation. The almanac data helps the receiver determine which other satellite ephemeris data to use. The almanac data is valid for 30 days or more. *Note: in astronomy the ephemeris term describes a table of predicted positions and is derived from the Greek word for diary. In essence the aviation GPS receivers use the information, emanating from each satellite in view, to measure the time lapse of a received radio signal, calculate the distance to each satellite's position and then establish the receiver's three-dimensional position by trilateration — a form of triangulation — of the distances from a minimum of three satellites. But simultaneous range calculations from four satellites are necessary to correct for the clock error in the GPS receiver. Although the receiver would normally calculate an altitude, external input of an aircraft's altitude — baro-aiding — can provide a further range measurement — that from the centre of the Earth, thus simulating an additional satellite; but see 'The WGS84 ellipsoid and the geoid-ellipsoid separation'. Aircraft positions are calculated by the receiver in terms of latitude, longitude and GPS altitude. The receiver chips contain mathematical models of the Earth. The most accurate, and commonly used for aviation purposes, is the World Geodetic System 1984 [WGS84] which is the lateral datum for WACs and — in Australia — VNCs, VTCs, aerodrome reference points and VOR sites. The Australian Height Datum is the vertical datum for Australian charts. See 'Defining the shape of the Earth – ellipsoids and geoids'. Note: GLONASS uses a different coordinate system to WGS84 which might result in a 20 metre or so difference in position relative to the GPS calculation. For an outline of the Global Positioning System visit Navigation Programs - Global Positioning System in the Federal Aviation Administration's website. Navigation system performance criteria There are four parameters for assessing the performance of a navigation system: availability/vulnerability, accuracy, integrity (i.e. trustworthiness) and continuity of service. Availability/vulnerability: the basic GPS civilian service is available nearly 100% of the time. Integrity refers to the trustworthiness of the device, i.e. the information provided is of the required standards for the particular application and the user is alerted when it is not. If a particular system is demonstrated to satisfy all four parameters for a flight phase then it may be classified as a sole-means navigation system — for that phase. When operating under the day visual flight rules, only navigation by visual reference to the ground satisfies all four parameters. A supplemental-means navigation system may be used in conjunction with a sole-means navigation system. Pilots operating under the VFR may use GNSS to supplement map reading and other visual reference navigation techniques. Any GPS receiver may be used but if it is an installed (i.e. not readily demountable) receiver it must be fitted in accordance with CAAP 35-1 or AC21-36; see AIP GEN 1.5 section 8.5.4. GNSS is only officially regarded as a primary-means night VFR navigation if the GPS receiver system accords with the FAA's Technical Standard Order [TSO] C129 or TSO C145/6 series, or has other CASA approval. If a system navigation meets the integrity and accuracy requirements all the time, but falls short on availability/vulnerability or continuity of service, it may be approved as a primary-means navigation system for a flight phase, if specified procedures are employed. Day VFR navigation does not use primary-means systems, only the visual reference system plus supplemental-means systems as required. For more information concerning the use of GNSS in VFR navigation see AIP ENR 1.1 paragraphs 19.2 and 19.5. Note the wording of sections 19.2.1e and 19.5.1d together with the latter's link to AIP GEN 1.5 section 8. Also read CAAP 179-1(1) section 5 'Navigation using Global Navigation Satellite Systems'. 4.10.2 GPS receivers and augmentation systems Portable and panel mountable/demountable GPS receivers Manufacture of GPS receivers for all applications is a multi-billion dollar industry supplying, just in the avionics field, a wide range from inexpensive handhelds — not much more advanced than the 1995 Magellan SkyBlazer first-generation receiver illustrated — to very expensive aviation panel mounts with integrity monitoring, ground-based position correction capability and colour moving-map position and terrain awareness warning systems [TAWS] displays. Inbuilt GPS reception capabilility has been added to smartphones and other portable consumer electronic devices, — perhaps in the form of a Trimble chip set — but such GPS capability may not be suitable for aviation use. Some dual receivers have GPS and GLONASS reception capability. The simplest handheld satnav receivers always contain a re-writeable user's database to store a reasonable number of planned flight routes and perhaps a thousand user-defined waypoints (icon, name, latitude and longitude). The actual track date from previous flights can also be stored. Aviation portables will also provide a recognised standard aviation navigation database, possibly compiled by Jeppesen (the Pacific Basin) and containing: location/elevation coordinates and other information for all aerodromes referenced in ERSA; plus VORs, NDBs and intersections shown on ERCs; plus controlled and 'special use' (PRD areas) airspace. Those location references may also be used as waypoints when defining routes. Those simplest receivers provide elementary 'moving map' graphics that display the aircraft's position and the relative position of all the waypoints and aviation-related detail within a user-defined range. The diagram or 'map' can be configured to remove unnecessary items from the display and thus present a less cluttered image. Display diagonal dimensions are typically 4.3 or 7 inches for the portable units. Purchase cost for the simpler aviation 4.3 inch receivers may be $500 - $750 while the cost of those in the middle of the portable range may be $1200 to $1750. The illustrated AvMap EKP IV receiver is in the middle of the portable range. It first appeared around 2006 and is representative of a 7 inch colour 800 × 480 pixel LCD receiver with split screen capability. The image shows two of the navigation screens — moving map on the left and horizontal situation indicator [HSI] on the right. A third screen is a navigation and location screen with a course deviation indicator [CDI] display. A compact flash memory card contains Jeppesen NavData plus land cartography. The amount of cartographic detail displayed can be varied. Internal RAM can store up to 1000 user-defined waypoints and up to 15 flight plans. The unit uses an external antenna and needs external power supply — battery life is limited and may be regarded as an emergency supply. An NMEA 0183 serial input/output data port is included. There are a limited number of portable/panel mountable aviation GPS receiver manufacturers: Bendix King, Garmin and AvMap are probably the best known in Australia. Calculating altitude 'GPS altitude' is calculated as the elevation above the WGS84 ellipsoid, which differs from the Australian height datum geoid [AHD]. Aviation GPS receivers navigation data should include tables/algorithms (based on latitude/longitude grids of varying cell sizes) of the geoid-ellipsoid separation values to allow the altitude above the AHD (rather than the WGS84 ellipsoid) to be displayed. Non-aviation receivers generally display only GPS altitude. In Australia the geoid-ellipsoid separation is quite significant, varying between minus 110 feet and plus 220 feet. At Cooktown, north Queensland, the airfield elevation is 26 feet (7.9m) and the AHD is 65.2m above the WGS84 ellipsoid (the N value) so the ellipsoidal height at the airfield would be 73.1 metres and a GPS receiver that doesn't adjust for the geoid-ellipsoid separation would indicate an airfield elevation of 240 feet; i.e. altitude is overstated by 214 feet. See 'Altitude and Q-code definitions'. The GLONASS system uses a different ellipsoid so the geoid-ellipsoid separation would differ from the WGS84 separation. Configuring displays Aviation GNSS receivers offer a variety of screen displays with user-configurable content that varies between models. The most useful displays for supplementary-means purposes are a moving topographical map screen, a horizontal situation indicator screen and an alphanumeric navigation screen. Some handhelds might provide just a basic cartographic which may be a monochromatic or colour representation of a few significant line or point features (highways, railroads, coastlines) on which aviation-related detail (airfields, PRD areas and controlled airspace boundaries) is overlaid. This is generally sufficient for VFR navigational use, but there are more expensive handhelds on the market which provide a topographic, colour moving map display — possibly with terrain clearance indication — but note these may not be WACs, VNCs or VTCs and such map displays for Australia are likely to have some detail deficiencies. Also the screen area is too small to show normal map detail. GNSS terrain clearance warning is not particularly useful for VFR navigation; Mark 1 eyeball, which also takes in the cloud base, is superior. The basic moving map, which is the preferred navigation mode, is usually configured to show an aeroplane image at the lower centre of the screen representing the aircraft's position in relation to the flight-planned track between current waypoints, airfields and controlled airspace, etc. The display can be configured as 'north up' or 'track up'. The 'track made good' will also be displayed, together with bearing and distance to the next waypoint. The display can normally be zoomed in or out and thus represent an area ranging from a few square miles to thousands of square miles. The alphanumeric display might show track made good, ground speed, distance and bearing to the next waypoint, ETE to the next waypoint plus a course deviation indication similar to that of a VOR omni bearing indicator. The division dots on a GNSS CDI are not spaced at two-degree intervals, but generally indicate distance off track — with the interval between dots being user-scalable from maybe 0.25 nm up to 5 nm. Some devices may change scale automatically as the waypoint is neared. The bar indicates where the required track is in relation to the aircraft; e.g. if the interval is set at one nm and the bar is located three divisions to the right of centre then the required track is 3 nm to the right. Stand-alone GPS/GNSS engines There are packaged GNSS engines available which output the navdata, via a Bluetooth connection, to an iPad, iPhone, Android or other display device. The cost for aviation types is $75 to $150. For example the Garmin GLO for aviation costs about $150 and receives position date from GLONASS and GPS satellites (thus 48 satellite potential) with an update rate of 10× per second. Weight is 60 grams, USB connection also available. 4.10.3 Performance standards for installed receivers in IFR aircraft Unlike aircraft operating under the day Visual Flight Rules, aircraft operating under the Instrument Flight Rules must use a GNSS system that meets the minimum performance standards of a Technical Standard Order (TSO) issued by the United States Federal Aviation Administration (FAA). The manufacturer of the system must hold a TSO authorisation issued by the FAA aircraft certification office; such receivers are then generally acknowledged as being 'TSO compliant' or "TSO'd". Note: there are no certification standards for the hand-held GPS devices used in sport and recreational aviation; i.e. they are non-TSO'd. There is little to gain by installing a more expensive TSO'd device in a RA-Aus aircraft. The TSO'd receivers are not necessarily more accurate than a non-TSO'd receiver. Panel-mounted GNSS receivers are certified to comply with TSO C129 which is a 'supplemental means' standard for IFR en route navigation that includes Receiver Autonomous Integrity Monitoring (RAIM). RAIM is an aircraft-based GNSS augmentation system (ABAS) that identifies any satellite that is not meeting specified standards and alerts the pilot. Portables only have the ability to inform the user when navigation has ceased entirely; they don't warn when a significant degradation in accuracy (the precision of the position solution) is occurring. TSO C145 and C145a add a fault detection and satellite exclusion system (FDE) plus capability to use an American satellite-based augmentation system (SBAS) known as the Wide Area Augmentation System (WAAS); though WAAS is not available in Australia. TSO C146 and C146a includes SBAS and is a standalone system with the same status as ADF and VOR, i.e. a primary means of navigation. No satellite-based augmentation system is yet planned for Australia though the Japanese SBAS, known as MSAS, has one of its six ground reference stations in Canberra. Ground Based Augmentation Systems (GBAS) are local systems installed at airports that transmit data to aircraft during precision approach and landings (GNSS Landing Systems or GLS) and will eventually replace Instrument Landing Systems (ILS). One GLS system is fully functioning at Sydney airport (2012) but handling only GLS receiver equipped Qantas Airbus A380 and Boeing 737-800 approach and autoland operations. See CASA 156/12. In aviation a 'sole means' precision IFR navigation system has to meet certain standards with respect to accuracy, integrity, availability and continuity of service. GPS by itself cannot meet those standards. However, the ICAO nations are developing a sole means global navigation satellite system based on GPS and Galileo augmented with ground- and space-based correction (or Differential GPS) systems, airborne avionics plus digital data link communications and surveillance between aircraft and ground stations. (See ADS-B surveillance technology.) GNSS will eventually make obsolete all VORs, NDBs and other ground-based systems* and — as manufacturers are prepared to develop low-cost light aircraft avionics — it may have considerable spin-off benefits to recreational fliers. *But not a self-contained onboard system like an Inertial Navigation System. GPS is used to supply position-fixing data to INS which, while its electronic DR is very accurate, still has a gyro drift inaccuracy up to one nautical mile per hour. For further information see CAAP 179A-1 Navigation using GNSS [2006], also see the CASA booklet Overview of GNSS [2006] and take particular note of the human factors section. Note: a robotic antenna calibration facility installed at Geoscience Australia and used to calibrate the 200 GNSS antennae forming part of the Australian Geophysical Observing System (AGOS) is expected to increase their satellite positioning precision to less than one millimetre. 4.10.4 GNSS VFR applications Establishing a flight plan The primary use of GNSS in sport and recreational aviation is in en route navigation — monitoring flight progress against the established flight plan and providing the heading corrections necessary to maintain the required track. This requires entering the planned route into the GNSS database, activating that GNSS route on take-off and making the necessary adjustments, as indicated by the GNSS, to maintain track. When used in the moving map navigation mode, the GNSS display exactly complements the en route navigation techniques expounded in section 8.3. The following is a basic illustration of GPS practice, for example let's take our planned flight from Oxford to Tottenham: Completed flight plan Segment Altitude Distance Track [mag] Heading [mag] Ground speed ETI Comms Oxford – Warraway Mountain 3500 74 083° 079° 67 66 ML 124.9 Warraway – junction 3500 52 050° 050° 65 48 ML 124.9 Junction – Tottenham 3500 33 029° 031° 65 30 ML 123.9 QNH: 1027 Last light: 1755 hrs AEST Fuel margin: 40 mins Entering the flight plan route Let's assume our GPS receiver contains a standard aviation database, in which case the only waypoint already existing would be Tottenham (YTOT) and the others would have to be entered into the users database thus: Oxford S33° 02.5' E144° 35.1' Warraway S33° 06' E146° 02.5' Junction S32° 40.6' E146° 57' The route would be given an identification and simply entered into the route database as: Route ID: Oxford – Warraway – Junction – YTOT The processor will calculate and provide an alphanumeric display of the required track and the distance for each leg, which must then be verified with the flight plan data. If they don't agree the cause must be found and corrected. The database contains the isogonals for the region so the required tracks can be displayed as magnetic or true. Note that the map screen will also include details from the standard aviation database; in this case the airfields at Ivanhoe (YIVO), Lake Cargelligo (YLCG) and Condobolin (YCDO). Monitoring progress Once airborne, and the receiver has locked on to the required number of satellites, the planned route is pilot-activated. The navigation computer within the receiver recalculates the aircraft's position at set intervals of one or two seconds, or less, keeps a history log of the track made good, and continually recalculates groundspeed and distance off track. The moving map display at left shows the situation at our position fix at Trida enroute from Oxford. The indication is that we have drifted left of track, the bearing to the first waypoint at Warraway is 085° magnetic and the distance to run is 52.4 nm. The track made good was 077° magnetic and the ground speed since activating the route is 55 knots. In this screen the system acts exactly as if there is an NDB at Warraway and the GPS receiver homes to it by indicating the bearing. However, if you just fly that bearing, without any heading adjustment for the crosswind component, the bearing will keep changing due to the drift and, like the ADF, you will eventually arrive at Warraway — but the track followed will be curved and the magnetic heading flown will be changing consistently. Thus to maintain a constant heading, and the direct track, you still have to calculate and apply the wind correction angle. The GPS doesn't directly calculate the heading to fly, either to regain the planned track or fly direct to Warraway. You don't need to estimate the track error from your chart the GPS shows the track made good as 077°, the track required was 083° thus the track error is 6°. You can then apply the double track error technique to regain and hold the original track. You will know you have regained track when the GPS indicates that the bearing to the waypoint is 083° so you then make the necessary heading adjustment to maintain track. If you continue to adjust your heading so that track made good — not your heading — matches the bearing you will theoretically continue tracking directly to the waypoint. Alternatively if you prefer to fly directly to the waypoint, rather than first regaining the original track, a quick mental calculation of track error/closing angle will provide the wind correction angle to accomplish that. e.g. track required = 083° track made good = 077° thus opening angle = 6°. Track required = 083°, bearing to waypoint = 085° thus closing angle = 2° Opening + closing angles = 8° WCA to track direct to the waypoint. In fact that calculation is simplified by using the difference between the track made good and the bearing; i.e. bearing = 085°, track made good = 077° thus WCA = 8°. Some handhelds may do the calculation for you in providing a TURN display, which is just that difference between the track made good and the bearing. The alphanumeric display at left, for the same flight situation, shows the same bearing, distance, track made good and ground speed information. In addition the CDI indicates that the required track is about 3 nm to the right of the present position, the estimated time en route to reach Warraway is another 55 minutes and the actual distance off track or the cross-track error [XTE] is estimated at 3.15 nm. The type of navigation using this display is very much the same as tracking in on a selected VOR radial and obviously to maintain a constant heading you still have to calculate and apply the wind correction angle. Handheld aviation GPS receivers normally provide an E6-B page where, if you enter the heading being flown and the true airspeed, the receiver will estimate the 'winds aloft' from the TMG and ground speed, and then calculate the heading to fly. Due to the limited key board it is not so easy to input data during flight in a light aircraft , so it is much easier to just use the variant of the track error/closing angle calculation outlined above. Remember that during flight under the Visual Flight Rules you are required to navigate by map reading and visual reference to the ground, not the GPS display. That display should only be a fractional portion of your continuing scanning pattern. The VFR rules (ERSA ENR 1.1 para 19.2) state 'the pilot must positively fix the aircraft's position by visual reference to features shown on topographical charts at intervals not exceeding 30 minutes.' Emergency search feature Aviation GPS receivers all provide an emergency search key, possibly labelled 'GOTO/NRST'. Pressing this key once will bring up a screen displaying the 10 nearest airfields extracted from the database together with the distance and bearing to each. Highlighting one of these airfields and then pressing the 'GOTO/NRST' key again will bring up the alphanumeric navigation screen to 'go to' that airfield. However, and this is a big however, the GPS indicates the direct route to the selected airfield not the safe route nor the route that avoids controlled airspace or restricted areas — though the device should warn when the aircraft is approaching such areas. The GPS does not take into account the type of terrain or the height of terrain — the GPS indicated route might be over 'tiger country' or straight through a mountain. The 'GO TO' function is for emergency use; you must not use it as a substitute for proper route planning. 4.10.5 GNSS constraints Antenna placement. The capability of a handheld receiver is greatly reduced if the receiver antenna is sited where it is shadowed by the airframe or is within one metre of a VHF antenna. An externally mounted antenna usually provides the best reception. Interference. Ensure that (1) the mounting/placement of the GPS unit, and associated cables, within the cockpit can cause no interference with the magnetic compass; and (2) other equipment within the cockpit (including mobile phones) can't interfere with the GPS receiver. Satellite signal quality [SQ]. The SQ number is an indication of signal to noise ratio for each satellite in view: 0–1 is useless, 2–3 is undesirable and 7–9 is good. The SQ may be indicated as an unnumbered bar chart but the scale usually reflects the 0–9 range. Horizontal dilution of precision [HDOP]. Some handhelds may show the HDOP value reflecting the relative geometric positioning of the satellites in view. Low HDOP (less than 02) is best, high HDOP (greater than 06) is not so good for accuracy. Ease of use. The keypads of aviation handhelds are not designed for entering data whilst flying a light aircraft, thus it is very difficult to change route details whilst airborne. Some GPS receivers now on the market, purporting to be aviation receivers, seem to have been designed for the much larger road vehicle market. Improper use of the 'go to' function. There is always the temptation to use the 'go to' function as a replacement for proper flight planning. Further reading Airservices Australia's document 'Safety_Net: using GPS as a VFR navigation tool' concerning avoiding airspace infringements while using GNSS. An excellent online book written by John Bell of Orlando, Florida titled 'A practical guide to using GPS in the cockpit'. The book is in pdf format (4 MB), and also contains links to additional material. It was published in 2006 (developed from an earlier publication) and updated November 2007. STRICT COPYRIGHT JOHN BRANDON AND RECREATIONAL FLYING (.com)