Admin
-
Posts
9,304 -
Joined
-
Last visited
-
Days Won
109
Content Type
Profiles
Forums
Gallery
Downloads
Blogs
Events
Store
Aircraft
Resources
Tutorials
Articles
Classifieds
Movies
Books
Community Map
Quizzes
Videos Directory
Everything posted by Admin
-

2.12 Acquiring aviation weather reports and forecasts
Admin posted a tutorial in Aviation meteorology
 2.12.1 The Bureau of Meteorology's Aviation Weather Service The Australian Government's Bureau of Meteorology (BoM) is required to support civil and military aviation by the provision of aviation weather services in the form of weather observations, forecasts and warning or advisory material. The BoM also supplies selected aviation products to Airservices Australia for their online pilot briefing system — the NAIPS Internet Service [NIS]. The following aviation products can be accessed from the BoM Aviation Weather Services page — select the product category from those listed in the left-hand frame of the page. Aviation forecasts Low-level Area Forecasts [ARFOR] are a coded statement of the general weather situation for the lower levels of the atmosphere (up to 18 500 feet) and the expected conditions for a particular forecast area — the latter as detailed on the PCA or as indicated on the clickable map of Australia. The forecast period is not less than 9 hours or greater than 15 hours. The forecast is available at least one hour before commencement of the validity period. Pilots should regard forecasts as the best possible predictions from professional meteorologists supported with extensive computer modelling. However, meteorologists and computer modelling may not predict local micrometeorological events. Terminal Aerodrome Forecasts [TAF] are a statement of the most likely meteorological conditions expected, for a specified period, in the airspace within the vicinity of the aerodrome. TAFs are issued for about one third of Australian aerodromes, at not less than six hourly intervals, and are usually valid for 12 hours. Most of the weather reports and forecasts are encoded using the World Meteorological Organization/International Civil Aviation Organization international weather code. Area QNH (Terminal) Trend Forecasts [TTF] are only issued for the 20 or so major airports and military bases. TTFs are an aerodrome actual weather report combined with a forecast of changes to conditions during the next three hours. The TTF was introduced to overcome the time-span deficiencies of the TAF. Instructions on how to read the ARFORs, TAFs and METARS are available online at the BoM's 'Knowledge Centre', accessible from the right hand side of the Aviation Weather Services page. The older aviation eHelp section still exists on the BoM website. (If a user name is requested use 'bomw0007' and the password 'aviation'.) You may find other useful material via the 'Educational and reference' box. Aviation observations Aerodrome routine meteorological reports [METARs] are routine observations of weather conditions at an aerodrome issued on the hour or half hour, often through automatic weather stations. SPECI are special reports issued when conditions meet specified criteria. Aerological diagrams and low level wind profiles are useful information for glider pilots. Aviation weather packages Click the 'Charts only' button from the options provided to display all of the following: The latest Australian mean sea level pressure analysis The latest Australian mean sea level pressure forecasts The latest satellite image The aerodrome weather information service [AWIS] Automatic weather stations [AWS] are located at about 190 airfields. All the stations are accessible by telephone and about 70 are also accessible by VHF NAV/COMM radio. The access telephone numbers and the VHF frequencies of the AWS can be found by entering the 'Location information' page and downloading the pdf for the relevant state. For an example of the service from an AWS call 08 8091 5549 to hear the current automatic weather information broadcast at Wilcannia, NSW. 'Plain English' area forecasts, terminal aerodrome forecasts and meteorological observations Ian Boag has produced an excellent, freely available, online, well-tested, plain language meteorological translator [PLMT] available here on Recreational Flying (.com) under Resources , providing current ARFOR, METAR and TAF within all Australian ARFOR areas decoded into 'plain English'. However, pilots must still get the NOTAM from the Airservices site. Bear in mind that CAR 120 imposes penalties for use of forecasts that were not made with the authority of the Director of Meteorology, or by a person approved for the purpose by CASA, and it may be that plain English conversions are not authorised by the Director, but as the original section of code is presented under the decoded text, it is most likely that there is no problem with Ian Boag's excellent facility; it could be conceived as an learning tool for student pilots. Student pilots should be aware that the ability to decode BoM aviation reports and forecasts will be tested in some of the aviation examinations. General weather observations, forecasts and radar images Access to the latest general rather than aviation specific weather observations and forecasts plus satellite imagery (visible and infrared) are obtained via the BoM home page. Weather radar images (precipitation location and intensity), from about 50 weather watch radars, are updated at 10 minute intervals. The images from individual radars cover an area of 256 km radius but may be combined into a larger mosaic. The last four snapshots from each radar can be looped to provide a good indication of current storm development, intensity plus the direction and rate of movement. Lightning tracker websites such as Weatherzone provide useful information on current storm location and movement. 2.12.2 Airservices Australia's NAIPS Internet Service The most convenient way to download the coded ARFOR, TAF and METAR plus the NOTAM is from Airservices Australia's NAIPS Internet Service [NIS], 'a multi-function, computerised, aeronautical information system. It processes and stores meteorological and NOTAM information as well as enabling the provision of briefing products and services to pilots and the Australian Air Traffic Control platform'. NIS is accessed through the internet with any web browser or access may be integrated within flight planning software. The Bureau of Meteorology provides all the weather products to the NIS. You must register with AsA before you can access the NIS. You are required to create a 'user name' and a password. If you don't have an ARN or Pilot Licence Number leave that field blank, don't use your RA-Aus or other sport and recreational organisation membership/Pilot Certificate number, it may conflict with someone's Aviation Reference Number. Download the NIS user manual (1.6 MB). When registered, you can log in; enter user name and password, and then click the required link. If you choose 'Area Briefing' you can select up to five briefing areas by clicking on the map or by entering the required areas in the entry boxes, and then click on the 'Submit Request' button. The ARFOR plus TAFs and METARs and NOTAM for the aerodromes in that area will be presented in the form of a pre-flight briefing. See an actual briefing with explanatory notes added. For further information read the weather check section of the Flight Planning and Navigation Guide. 2.12.3 Acquiring weather information in flight There are several means of obtaining a limited amount of weather information while airborne: AERIS — the Automatic Enroute Information Service network ATIS — the Automatic Terminal Information Service at some aerodromes AWIS — the Aerodrome Weather Information Service at all automatic weather stations can be accessed by telephone and about 70 of them also provide VHF access. FLIGHTWATCH — the on-request service provided by Airservices Australia. For further information read the acquiring weather information section of the VHF Radiocommunications Guide. Inflight weather warning broadcasts by Air Traffic Services SIGMETs report the occurrence or expectation of significant meteorological events such as widespread duststorms, a severe line squall or heavy hail. SIGMETs are issued by the BoM but broadcast by the Air Traffic Service for the affected area as a hazard alert; see AIP GEN section 5.1. AIRMETs report the occurrence or expectation of less severe meteorological events and applies only to aircraft operating below 10 000 feet. AIRMETs are issued by the BoM but broadcast by the Air Traffic Service as a hazard alert for the affected area; see AIP GEN section 5.3. 2.12.4 AIP Book and ERSA Airservices Australia publishes online versions of the AIP Book and ERSA at www.airservicesaustralia.com/publications/aip.asp. You must click the 'I agree' button to gain entry. For further information about the meteorological service reports and forecasts, read the section AIP GEN 3.5 (about 50 pages). To find a particular section of AIP or ERSA you have to click through a number of index pages. The section/sub-section/paragraph numbering system is designed for an amendable loose leaf print document and you may find it a little confusing as an on-line document. STRICT COPYRIGHT JOHN BRANDON AND RECREATIONAL FLYING (.com)
 -
 2.11.1 Light scatter Rayleigh and Mie scatter Some of the visible light radiation from the sun, passing through the atmosphere bounces off atoms, molecules and other particles, and is scattered in all directions without losing energy or altering frequency. Gas molecules, being very much smaller than the wavelength of visible light (0.4 to 0.8 microns, see section 1.8 Electromagnetic wave spectrum), scatter the shorter violet and blue wavelengths much more strongly than the longer yellow and red wavelengths. But as the human eye is not very sensitive to violet light, the skyglow appears blue. Atmospheric dust and smoke particles are considerably larger than the gas molecules. But they may still be smaller than the wavelengths of visible light and thus also selectively scatter the blue end of the spectrum, but more strongly than the gas molecules. This phenomenon is termed selective scatter or Rayleigh scatter. Cloud droplets and small ice crystals are some 50 times larger than the light wavelengths and scatter all equally. Thus the light scattered from clouds retains the white light spectra, Mie scatter, and even though the droplets are colourless and transparent, the clouds appear white. Thicker clouds have darker bases because most of the light is scattered out the top and sides. When the sun is directly overhead, the direct parallel rays that reach the eye from the sun's disc travel only a short distance through the atmosphere, so the sun's disc appears white. As the sun lowers, the distance travelled through the atmosphere increases, as does the scattering of the blue end. The depleted unscattered light that reaches the eye makes the disc appear yellow to orange to red, depending on the number and size of non-gaseous particles in the air. If there is a lot of dust or smoke haze in the path, only the red end of the sun's rays will remain unscattered — even the scattered light becomes reddish. The amount of the visible light spectrum scattered is dependent on line-of-sight distance through the atmosphere. The sky near the horizon appears less blue, or whiter, at midday than the sky overhead; thus if the atmosphere were thicker, the sky would be whiter. Similarly, when looking horizontally at a series of mountain ranges they appear bluer at a distance, until a point where the far ranges start to appear whiter than those in the middle distance. The trees on the ranges emit terpenes or essential oils — hydrocarbon molecules about 0.2 micron diameter, which combine with ozone infiltrating from the stratosphere. These molecules selectively scatter blue light — hence the blue haze on warm days. Air molecules selectively scatter sunlight forward and backward equally, and at about twice the intensity of the light scattered at right angles to the beam. For particles larger than the wavelengths of light, back-scattered light is less intense than that for gas molecules but forward scatter is much more intense. Thus, in an atmosphere containing many large particles, the sky is less bright than blue sky when looking 'down sun' and much brighter when looking in the azimuth of the sun. White-out conditions can occur when the surface has a complete snow or ice cover, matched with an extensive cloud cover. The brightness of the cloud cover is increased by light that is successively scattered many times between surface and cloud, with little absorption. The light travels in all directions and at all angles. In such conditions there can be no shadows, the horizon line disappears and the form of the landscape is no longer discernible. This leads to spatial disorientation. Partial white-out or flat light is a less severe condition where a pilot's ability to judge ground references for distance, height and attitude are detrimentally affected. Twilight effects The characteristic light, during the morning and evening twilight periods, is due to atmospheric scattering. The duration of twilight is geometrically dependent on latitude, season and the observer's elevation. Evening civil twilight is the period from sunset until the centre of the sun's disc is 6° below the normal horizon; i.e. ignoring the topography. If the sky is clear, it is usually practicable to carry out normal outdoor activities without artificial light; thick overcast will reduce available light at the surface considerably during the civil twilight periods, as may elevated topography to the west in the evening and to the east in the morning. Last light is the end of evening civil twilight; and the official end of daylight in VFR air navigation regulations. First light is the beginning of morning civil twilight and the official start of daylight in the regulations. It is not the time at which a line of light appears on the eastern horizon — if you take-off in those conditions you will be night flying. Evening nautical twilight ends when the sun is 12° below the horizon. During this period the western horizon is still clearly defined, weather permitting, and the brighter stars are visible — thus providing good conditions for ocean navigators to take star sights; hence nautical. Noctilucent clouds may be seen in higher latitudes. Evening astronomical twilight ends when the sun is 18° below the horizon, after which all scattered sunlight disappears from the upper atmosphere and the stargazers have good viewing conditions. The morning twilight periods are reversed, of course. The twilight wedge, or curve, divides the Earth's shadow from that part of the sky lit by direct sunlight. It appears on clear days as a blue-grey arc next to the eastern horizon as the sun disappears, highest at the antisolar point and curving down to the horizon. Initially there is a fairly sharp boundary bordered by a reddish band, the counterglow, then becoming diffuse as it rises. An airborne observer should see a sharp boundary above the horizon. Similar shadowing occurs at sunrise on the western horizon. Usually after sunset the sky above that point is pale yellow with a blue-white arch above, the twilight arch, with yellow above and orange sky to either side. As twilight progresses, the arch above the sunset point becomes pink with yellow and orange below. These areas gradually flatten as the sky above changes from blue-grey through to dark blue. The final glimmers on the horizon are possibly greenish-yellow. Very rarely, and mostly when viewed over water when the air is free from any form of haze, a green flash is seen on the top of the sun's disc just before it disappears. Zodiacal light is a faint, luminous glow in the night sky, easily seen in low to mid-latitudes at twilight in moonless conditions. It is caused by sunlight scattered by dust particles in interplanetary space. Zodiacal light extends over the entire sky but is brightest in the zodiacal band, and at about 30° angular distance from the sun, where the intensity is about three times that of the brightest part of the Milky Way. It is best seen when the ecliptic is close to vertical; i.e. autumn evenings and spring mornings. Brightness decreases with angular distance from the sun, being lowest at 120° then gradually increasing to the 180° antisolar point. The enhanced brightness near the solar point, and covering an area 6° by 10°, is the Gegenschein or counter-glow. Airglow is visible infrared [IR] and ultraviolet [UV] emissions from the atoms and molecules in the ionisation layers caused by absorption of much of the solar UV radiation and of cosmic radiation. Daytime airglow, dayglow, may be seen from the surface at twilight when the blue skyglow is sufficiently weak. Dayglow is caused mainly by the dissociation of atoms, whereas nightglow emissions are due to recombination. The sum of all visible nightglow emissions, together with zodiacal light and scattered starlight, can be seen as the faint light between stars. Crepuscular (twilight) rays are alternate light and dark bands that appear to diverge fan-like from the sun's position when it is hidden behind a cloud bank or the topography, in a humid or hazy atmosphere. The rays pass through gaps, like light beams shining through high windows. The divergence is due to perspective, if the rays pass overhead they then appear to converge on the antisolar point — anticrepuscular rays. There are three types of crepuscular rays: rays of light passing through gaps in low clouds rays of light diverging from behind a cloud bank pinkish rays radiating from below the horizon. 2.11.2 Atmospheric optical displays Electromagnetic wave refraction, reflection and diffraction When a light ray passes obliquely from one transparent medium to another, or between layers of different density within the same medium, part of the ray is returned back at the boundary. The remainder, passing through, is deviated from its original course; i.e. its direction changes. The deviation is dependent on angle of incidence; the wave lengths of the light beam, or radio wave; and the refractive index for that medium. The refractive index is the ratio of the speed of electro-magnetic radiation in free space to the speed of radiation in that medium; in air it is effectively 1.0, and in water it is 1.33. Refraction has two components — deviation and dispersion. As the components of sunlight have different wavelengths, in the atmosphere the deviated light ray is dispersed into its component colours but the red light deviates less than the blue light when passing from air through ice crystals or water droplets. Radio waves in the High Frequency [HF] bands are refracted by the ionisation layers in the atmosphere. The downward bending of the wave is sufficient to redirect the wave back to the Earth's surface but at a distance from the transmission point. If there is sufficient energy, the wave may then be reflected back to the ionosphere. Thus a high-energy HF transmission is able to 'skip', between the surface and the ionosphere, for a considerable distance around the world. Reflection is the bounce back of all, or part, of a light ray when it encounters the boundary of the two media, and the angle of reflection equals the angle of incidence. The amount of light reflected depends on the ratio of the refractive indices for the two media. Diffraction is the bending of a light beam (or radio wave) into the region of the geometric shadow of an obstacle, or the spreading of light waves around obstacles. This produces a series of light and dark bands or rings or coloured spectra, from the inter-ray interference; constructive interference results in light bands, while destructive interference results in dark bands. The degree of diffraction depends on wavelength — red light is diffracted more than blue — and particle size. Ice crystal displays Halos are a range of optical phenomena that result when the sun or moon shines through thin cloud — particularly CS — fog or haze composed of ice crystals. The small ice crystals that grow in the troposphere tend to be hexagonal flat plates or hexagonal columns. Light passing through the sides of a hexagonal ice crystal is refracted in exactly the same way as if it were passing through a 60° prism. The magnitude of the deviation angle depends on the orientation of the crystal. For a 60° ice prism the minimum deviation angle for all orientations is 22°; and for small rotations of the crystal, at the minimum deviation angle, the variation from 22° is insignificant. Thus in an atmosphere of randomly oriented crystals there will be a concentration of rays deviated by 22°. The deviation of light from its original path, through many hexagonal crystals, brings sunlight or moonlight to the observer's eye from different directions and in varying intensities. However, the concentration of refracted rays around 22° produces a solar or lunar halo whose inner, red edge has an angular radius of 22° from the observer's eye. The red edge merges into a yellow band then all the colours overlap in an outer white band. Halos are minimum deviation effects; each colour has a concentration at its minimum deviation angle, but also has a significant amount of light refracted at greater angles and overlaps other colours. Only the red, with the lowest deviation, cannot be overlapped. Light passing through one side and an end of a hexagonal crystal is refracted in the same way as in a 90° prism and, in this case, there will be a concentration of rays at a 46° deviation angle. In suitable conditions a very large solar or lunar halo with an angular radius of 46° may appear, but it will be much less intense than the 22° halo and will rarely be complete. The 22° halo is the most frequently observed of all the ice crystal displays; the 46° halo is rather rare. As cloud crystals grow during fall (flat plates perhaps 50 microns thick and several millimetres across, columns perhaps 100 microns across and several millimetres long), the drag creates lee eddies and the crystals tend to orient with their longest dimension near horizontal. They oscillate randomly as they fall in a spiral path, producing complicated optical effects through reflection, refraction and diffraction. Sun pillars are vertical columns of light that appear above or below the sun, or both, when the sun is near the horizon. They are caused by reflection of sunlight from the near-horizontal surfaces of ice crystals and are similar to the glitter path of sunlight reflected on water. Light pillars are also associated with the moon. A subsun is a particular form of sun pillar seen from an aircraft when the sun is high — becoming a reflected, elongated image of the sun in nearly horizontal ice crystals in lower clouds. The image appears as far below the horizon as the sun is above. Sun pillars may be associated with AC. The parhelic circle is a reflection from the vertical surfaces of horizontally oriented flat plate or columnar crystals when very small ice crystals, diamond dust , fall through the air. The crystals reflect the light in all directions of the azimuth but always downward at the same elevation as the sun. Thus if the sun's elevation is 25° an observer would see the parhelic circle 360° around the horizon by looking up 25°, but usually only part of the faint white circle is seen. The parhelic circle and a sun pillar may form a cross in the sky, centred on the sun. If falling plate crystals maintain a horizontal position, with the sun low in the sky, they have the possibility to refract light to the observer from the sides of the 22° halo, but not from other positions in the halo. The result is a spot of increased light intensity and colour separation — red towards the sun — in the 22° halo each side of the sun, where the halo would intersect the parhelic circle; sometimes it appears with a white tail pointing away from the sun. As the sun elevation increases, the spots move further from the sun and outside the halo, disappearing at sun elevations greater than 60°. These intensified light spots are called parhelia, sundogs or mock suns and are the most common ice crystal phenomenon after 22° halos; they are often associated with CI, CS and possibly AC. Similar effects associated with the moon are paraselena or mock moons. Refraction through the edges of plate crystals with nearly horizontal bases may produce a circumzenithal arc. This is part of a circle, possibly one third, centred directly above the observer's head and above the sun, just outside the 46° halo position. The halo may also be visible. The circumzenithal arc cannot occur when the sun's elevation exceeds 32°. Colour separation occurs with red on the outer rim, blue on the inner. The arc may be associated with CI and CS. An anthelion is a concentration of back reflected light at the anthelic point, 180° from the sun and at the same elevation. The anthelic point may be the centrepoint for various reflection / refraction phenomena — the anthelic arcs. Various other light intensifications are associated chiefly with refraction and may appear in ice crystal displays in Antarctic conditions. Among them are: Parry arcs circumhorizontal arcs supralateral arcs infralateral arcs contact arcs upper and lower tangents to the 22° halo. Cloud droplet effects The moon or sun when viewed through CC, AC, thin AS or SC may be surrounded by a diffraction disc, or aureole of light, of varying size and intensity. The aureole is bluish near the sun or moon,and whiter further out with a red/brown periphery. The aureole may be enclosed by rings with blue inner and red outer edges forming a corona. The size of the rings depends on droplet size, smaller droplets produce larger rings. If there is a wide mixture of droplets of varying size then the diffraction rings will be of widely varying size, overlapping each other and blurring into a uniform illumination, leaving only the aureole visible. Cloud irisation or iridescence ( Iris = the Greek rainbow goddess ) appears when a cloud element or streak, usually AC or CC and sometimes lenticularis, is evaporating around its edges so that the droplet size changes quickly over a short angular distance. Also the entire element or small cloud is contained in roughly the same angular distance from the sun. The diffraction pattern traces blue light around the edge of the cloud where the droplets are smallest, and red light where the drops are uniformly larger. The result is iridescent bands — predominantly pinks and blues or greens with pastel shades — appearing along the thinner edges of individual cloud elements. Cloud iridescence is common but the cloud must be within 20° of the sun and thus not readily noticeable. It can occur in thin SC or AS, and also in nacreous clouds. The corona is the diffraction pattern seen in cloud droplets when looking towards the sun. The glory is the diffraction pattern seen in cloud or fog droplets when looking toward the antisolar point. (A glory is the circle of light or aureole around the depiction of the head of a saint, etc.) When flying in sunlight over a cloud layer, the coloured rings of glory may be seen around the antisolar point; i.e. around the aircraft shadow if it is not diffused. The antisolar point is that of the observer, so the luminous coloured halos are centred on the position of the observer's head shadow. As in other diffraction rings, the blue halo is on the inside and the red on the outside. The 'silver lining' that may be seen around the outer edges of heavier clouds, containing larger droplets, is a diffraction effect. Rainbows As a light ray from the sun strikes a small spherical raindrop (drops less than 150 microns diameter are held as a sphere by surface tension, while larger raindrops are distorted by drag into a flattened sphere) some light is reflected by the outer surface. Some light passes through and reaches the opposite inner surface, where a fraction of the light is reflected internally and the rest passes out of the drop. A ray may be reflected only once inside a drop, or many times, but each reflection is accompanied by light leaving the drop, so each internal reflection diminishes the reflected ray. Each spherical raindrop reflects and refracts, in all directions, the light rays that are striking it. However, due to the spherical surface there is a concentration of first reflection rays reflected back towards the sun, around a maximum angle of about 42° to the axis line joining the raindrop and the sun. The red light is refracted less than the other colours and has a concentration at about 42°. The blue light is concentrated at 40° with the other colours in between. The observer will see this concentration of reflected light rays as an intensified coloured light band. This band consists of the first reflection rays from all the raindrops that lie on the surface of a cone, subtended at the observer's eye, with an angular radius of 42° from an axis line drawn from the sun (directly behind the observer) through the observer's head and extended down-sun to the antisolar point; i.e. below the horizon where the shadow of the observer's head might be. This primary rainbow will have the red band on the outer edge. An observer on the Earth's surface sees only an arc of the rainbow circle. When the sun is 40° above the horizon, just the top of the bow can be seen. The rainbow will rise as the sun lowers, until much of the circle can be seen. The lower ends may appear very close to the observer. An airborne observer could possibly see the full circle. Light that is reflected twice within the raindrops has a deviation angle of 51° and produces the weaker secondary rainbow — concentric with and outside the primary, but with the red band on the inner edge. Thus the observer is seeing the concentration of twice reflected rays from all the raindrops that lie on the surface of a 51° cone, at the same time they are seeing the first reflections from the raindrops on the 42° cone. Third and fourth reflection rays would also form rainbows with angular radii of 40° and 46° respectively. These are so weak, and would also form up-sun, so that they are most unlikely to be seen except against a dark cloud. As the first reflection rays from spherical raindrops have a maximum deviation angle of 42°, it follows that all the low-angle reflections coming back to the observer's eye, from all the raindrops enclosed within the 42° cone, will increase the brightness of the sky within the primary bow. Similarly the sky is also brighter outside the secondary bow. The rainbow ends are frequently brighter than the rest of the bow, particularly when the sun is low. This comes from the approximate straight back reflection / refraction in the larger, flatter raindrops added to the reflection / refraction of the smaller, spherical drops. Diffraction interference of light rays ( the waves are out of synchronisation ) produces changes in light intensity, which may appear as a series of light / dark bands within, and close to, the primary rainbow. When rainbow rays pass through very small water droplets (e.g. cloud or fog droplets) they are spread by diffraction, and each colour band is broadened and overlaps adjoining bands. Where all the colours overlap, the result is a white rainbow, cloud bow or fog bow; this is often seen from an aircraft flying over a smooth, extensive cloud layer. Near sunset, a white rainbow may appear as a red rainbow in a low cloud bank. A full moon can produce a rainbow that appears to be white in the low light conditions but, when photographed, is revealed as a normal rainbow. Atmospheric density layer effects When a light ray passes through the atmosphere, where the density changes gradually, the light ray changes direction in a curved path rather than abruptly as when passing through an ice crystal. With changes in atmospheric density, the deviation path curves toward the denser air. Thus when a star is low in the sky, the change in atmospheric density with height, particularly with a cold surface layer under an inversion, causes refraction to bend the light rays so that the star's apparent position is higher than actual and the dispersion may produce a multi-colour image — upper part blue, middle white and lower part red. This gives the impression of an aircraft's lights, and is often reported as strange, moving lights in the sky, as the atmospheric effects make the object appear to jiggle. At sunset or sunrise, refraction can cause the sun's image to appear above the horizon when it is actually below. Small-scale atmospheric temperature and density variations in the line of sight between the observer and a star, or other light-emitting object, produce the twinkling effect scintillation, and the shimmering of distant landscape. Parcels of cooler or warmer air can act as lenses, reducing or increasing the apparent brightness or size of the object. Mirages are optical phenomena produced by refraction of light rays through air layers with large temperature gradients. An inferior mirage (i.e. it appears below its actual position) occurs when the temperature initially decreases rapidly with height. For example, the heat flux from a hot surface, such as tarmac or sand, greatly increases the temperature of the adjacent shallow air layer and consequently the density of that layer decreases (see equation of state). The result is a layer of less dense air underlying denser air, the reverse of the normal lapse rate. Light rays from the sky moving through the layers will be refracted upward in the less dense air (i.e. bent toward the denser air), giving the appearance of a layer of water. When seen from the ground or water, a superior mirage (i.e. it appears above its actual position) occurs when there is a pronounced inversion near the surface, and normally over the sea or a large body of water. A distant object within the inversion layer, even something below the horizon, will appear in the sky above its actual position — possibly totally upside down or the upper portion upside down, but certainly distorted and wavering. For more information google the phrase "superior mirage". An inversion layer of cooler air, with warmer air above and below, acts as a wave guide for light rays introduced into the layer at a small angle to the horizontal. Unless there is a discontinuity in the layer, the trapped rays cannot escape and may be confined within the wave guide for very long distances, following the curvature of the Earth. In such circumstances, a spectacular superior mirage might be seen from an aircraft flying over land within that wave guide. Whit Landvater is a Nevada balloonist who experienced such a display on November 27, 2003 and said "It was like "living inside a Photoshop document while someone was going crazy with the clone tool and filters!" 2.11.3 Moon phases The geometry of the sun–Earth–moon orbits gives rise to the eight commonly recognised moon phases and the associated moonrise/moonset periods.. The elapsed time from one full moon to the next is about 29.5 days. Moon phases and moonrise / moonset periods Phase Appearance Rises Sets New moon Waxing crescent dawn dusk First quarter Waxing gibbous noon midnight Full moon Waning gibbous dusk dawn Last quarter Waning crescent midnight noon STRICT COPYRIGHT JOHN BRANDON AND RECREATIONAL FLYING (.com)
 -
 2.10.1 The global electrical circuit The Earth's surface — ocean and solid — and the ionosphere are highly conductive. The atmosphere conducts electricity because of the presence of positive and negative ions plus free electrons. Conductivity is poor near sea level but increases rapidly with height up to the ionosphere; also it is greater at polar latitudes than equatorial. The conductivity near sea level is low because there are fewer ions, and those ions tend to become attached to the larger aerosol particles that are more common near the surface. Refer to section '1.5 Atmospheric moisture'. During fair weather there is an electric potential difference of 250 000 to 500 000 volts between the ionosphere and the Earth's surface, the surface being negative relative to the ionosphere. This gives rise to the fair weather current, which is a steady flow of electrons from the surface at about one microwatt per square metre. The three main generators in the global electrical circuit are the solar wind entering the magnetosphere, the ionospheric wind and thunderstorms. The average CB generates a current of about one amp during its active period. With an estimated 1000 to 2000 thunderstorms continually active around the globe, emitting possibly 5000 lightning strokes per minute, there is an electrical current of 1000 to 2000 amps continually transferring a negative charge to the surface, and an equal and opposite charge to the upper atmosphere. The electrical charge continually flowing into the stratosphere/ionosphere from the CBs maintains the fair weather current flowing to the surface. 2.10.2 Static charge and discharge Apart from the CB clouds, the atmosphere carries a net positive charge and the electric potential increases with height, and in cloud and fog. Strong electrical forces also exist in and around rain showers, which can transfer a charge of either polarity to the surface, or to an aircraft. Static electricity is the imbalance of negative and positive charge. Aircraft accumulate electrical charges in two ways. The most substantial is from flying through the extremely high voltage electrical fields associated with CB, or potential CB development. The static charge can pervade the whole aircraft, internally and externally, and render navaids useless. The rapid discharge of this charge — a single-channel spark discharge rather than a slow bleed-off from the airframe — may happen in any conditions, but the chances are more probable in temperatures between 10 °C and –10 °C, and where flying in rain mixed with snow. The other lesser type is precipitation static. The aircraft charge accumulates from the charge carried by precipitation particles, particularly snow crystals, and separates when the particles break up against the aircraft. Maximum build-up occurs in temperatures a few degrees either side of 0 °C. Static charges imparted to antennae will affect communications, particularly navaids where the effect on signal-to-noise ratio may be considerable. The built-up static charge is usually slowly bled off into the atmosphere, or as a quiet, non-luminous point discharge. In extreme build-ups, the consequent corona discharge streamers or brush discharge are manifested as St Elmo's fire, which is usually not visible in daylight but visible at night as a continuous, luminous blue-green discharge from wing tips, propellers and protuberances. 2.10.3 Lightning The electrostatic structure within CB, or CU CON, is such that pockets of different charge exist throughout the cloud. Generally, the main net positive charge resides on the ice crystals in the upper part of the cloud and the main net negative charge of similar magnitude is centred near the middle or lower part of the cloud at the sub-freezing level. That charge mainly resides on supercooled droplets. A smaller positive charge centre may exist at the bottom of the cloud where temperatures are above freezing. The electrostatic forces of repulsion and attraction induce secondary charge accumulations outside the cloud, a positive region accumulates on the Earth's surface directly below the cloud. Above the cloud, positive ions are transferred away from, and negative ions are transferred toward, the cloud. One favoured theory for the charge separation mechanism is the 'precipitation' theory. This suggests that the disintegration of large raindrops, and the interaction between the smaller cloud particles and the larger precipitation particles in the updrafts and downdrafts, causes the separation of electrical charge — with downward motion of negatively charged cloud and precipitation particles, and upward motion of positively charged cloud particles. Discharge channels Lightning is a flow of current, or discharge, along an ionised channel that equalises the charge difference between two regions of opposite charge; this occurs when the charge potentials exceed the electrical resistance of the intervening air. These discharges can be between the charged regions of the same cloud (intra-cloud), between the cloud and the ground (cloud-to-ground), between separate clouds (cloud-to-cloud) or between the base of a cloud and a charge centre in the atmosphere underneath it (cloud-to-air). The discharge channels, or streamers, propagate themselves through the air by establishing, and maintaining, an avalanche effect of free electrons that ionise atoms in their path. Lightning rates, particularly intra-cloud strokes, increase greatly with increase in the depth of clouds. Cloud-to-cloud and cloud-to-air discharges are rare but tend to be more common in the high-base CB found in the drier areas of Australia. Discharges above the CB anvil into the stratosphere and mesosphere also occur. When intra-cloud lightning — the most common discharge — occurs, it is most often between the upper positive and the middle negative centres. The discharge path is established by a 'stepped leader', the initial lightning streamer that grows in stages and splits into more and more branches, as it moves forward seeking an optimal path between the charge centres. The second, and subsequent, lightning strokes in a composite flash are initiated by 'dart leaders', streamers that generally follow the optimum ionised channel established by the stepped leader. The associated electrical current probably peaks at a few thousand amperes. A distant observer cannot see the streamers but sees a portion of the cloud become luminous, for maybe less than 0.5 seconds, hence 'sheet lightning'. Cloud-to-ground discharges Most cloud-to-ground discharges occur between the main negatively charged region and the surface — initially by a stepped leader from the region, which usually exhibits branching channels as it seeks an optimal path. When the stepped leader makes contact, directly with the surface or with a 'ground streamer' (which is another electrical breakdown initiated from the surface positive charge region and which rises a short distance from the surface), the cloud is short-circuited to ground; to complete each lightning stroke, a 'return streamer', or return stroke, propagates upwards. (The return streamer starts as positive ions that capture the free electrons flowing down the channel and emit photons. The streamer carries more positive ions upward, and their interaction with the free-flowing electrons gives the impression of upwards movement.) The charge on the branches of the stepped leader that have not been grounded flow into the return streamer. Subsequent strokes in the composite flash are initiated by dart leaders, with a return streamer following each contact. The return streamer, lasting 20–40 microseconds, propagates a current-carrying core a few centimetres in diameter with a current density of 1000 amperes per cm² and a total current typically 20 000 amps, but peaks could be much greater. A charged sheath or corona, a few metres in diameter, exists around the core. The stroke sequence of dart leader–return streamer occurs several times in each flash to ground, giving it a flickering appearance. Each stroke draws charge from successively higher regions of the CB and transfers a negative charge to the surface. Return streamers occur only in cloud-to-ground discharges and are so intense because of the Earth's high conductivity. Some rare discharges between cloud and ground are initiated from high surface structures or mountain peaks, by an upward-moving stepped leader and referred to as a ground-to-cloud discharge. Rather rarely an overhanging anvil-to-ground discharge can be triggered by heavy charge accumulation in the anvil, and the high-magnitude strike can move many kilometres from the storm — a 'bolt from the blue', but another reason for recreational pilots to give large storm cells a very wide berth. The temperature of the ionised plasma in the return streamer is at least 30 000 °C and the pressure is greater than 10 atmospheres. This causes supersonic expansion of the channel, which absorbs most of the dissipated energy in the flash. The shock wave lasts for 10–20 microseconds and moves out several hundred metres before decaying into the sound wave — thunder — with maximum energy at about 50 hertz. The shock wave can damage objects in its path. The channel length is typically 5 km. Channel length can be roughly determined by timing the thunder rumble after the initial clap; e.g. a rumble lasting for 10 seconds x 335 m/sec = 3.3 km channel length. When a lightning stroke occurs within 150 m or so, the observer hears the shock wave as a single, high-pitched bang. Effect on aircraft instruments The lightning discharges emit radio waves — atmospherics or 'sferics — at the low end of the AM broadcast band and at TV band 1. These radio waves are the basis for airborne storm mapping instruments such as Stormscope and Strikefinder. The NDB/ADF navigation aids also operate near the low end of the AM band, so that the tremendous radio frequency energy of the storm will divert the radio compass needle. Weather radars map storms from the associated precipitation. Strike effect on aircraft When most aeroplanes, excluding ultralights, are struck by lightning the streamer attaches initially to an extremity such as the nose or wing tip, then reattaches itself to the fuselage at other locations as the aircraft moves through the channel. The current is conducted through the electrically bonded aluminium skin and structures of the aircraft, and exits from an extremity such as the tail. If an ultralight is struck by lightning, the consequences cannot be determined but are likely to be very unpleasant. Ultralights particularly should give all CBs a wide berth; supercells and line squalls should be cleared by 25–30 nm at least. Although a basic level of protection is provided in most light aeroplanes for the airframe, fuel system and engines, there may be damage to wing tips, propellers and navigation lights, and the current has the potential to induce transients into electrical cables or electronic equipment. The other main area of concern is the fuel tanks, lines, vents, filler caps and their supporting structure, where extra design precautions prevent sparking or burn-through. In heavier aircraft, radomes constructed of non-conductive material are at risk. 2.10.4 Red sprites and blue jets When large cloud-to-ground lightning discharges occur below an extensive CB cluster with a spreading stratiform anvil, other discharges are generated above the anvil. These discharges are in the form of flashes of light lasting just a few milliseconds and probably not observable by the untrained, naked eye but readily recorded on low-light video. Red sprites are very large but weak flashes of light emitted by excited nitrogen atoms and equivalent in intensity to a moderate auroral arc. They extend from the anvil to the mesopause at an altitude up to 90 km. The brightest parts exist between 60–75 km, red in colour and with a faint red glow extending above. Blue filaments may appear below the brightest region. Sprites usually occur in clusters that may extend 50 km horizontally. Blue jets are ejected above the CB core and flash upward in narrow cones, which fade out at about 50 km. These optical emissions are not aligned with the local magnetic field. Images and further information are available at the University of Alaska site. 2.10.5 Auroral displays The Aurora Australis is usually only seen from latitudes higher than 60° south but may sometimes be seen from the Australian mainland. The displays, or aurora storms, take place at altitudes of 100–300 km. The auroral glow is caused by an increase in the number of high-energy, charged particles in the solar wind (separated hydrogen protons and electrons) associated with increased solar flare activity. Some of these particles, captured by the magnetosphere, are accelerated along the Earth's open magnetic field lines (which are only open in the polar regions) and penetrate to the inner Van Allen belt, overloading it and causing a discharge of the charged particles into the ionosphere. The discharges extend in narrow belts 20–25° or so from each magnetic pole. The excitation of oxygen and nitrogen atoms by collision with the particles causes them to emit visible radiation — forming moving patches, bands and columns of limited colours. The display colour depends on the gas and the altitude. Oxygen atoms emit a red glow at high levels, orange at medium levels and pale green at low levels. Nitrogen emits blue and violet at high levels and red at low levels. The major forms of auroral display, and typical sequence of appearance, are: glow — a faint glow near the horizon, usually the first indication of an aurora arch — a bow-shaped arc running east to west, usually with a well-defined base and small waves or curls rays — vertical rays or streaks, often signifying the start of an aurora substorm and forming into bands band — a broad, folded curtain moving in waves and curves, and indicating maximum activity is near corona — rays appear to converge near the zenith veil — a weak, even light across a large part of the sky often preceding the end of the display patch — an indistinct nebulous cloud-like area which may appear to pulsate. Extensive auroral displays, which are associated with high sunspot activity, are accompanied by disturbances in radio communications. The period of maximum and minimum intensity of the aurora follows the 11-year sunspot cycle. STRICT COPYRIGHT JOHN BRANDON AND RECREATIONAL FLYING (.com)
 -
 2.9.1 Airframe icing High humidity and low winter freezing levels in south-east Australia provide likely conditions for icing at low levels. Hopefully it is unlikely that an ultralight or VFR GA pilot would venture into possible icing conditions, but the pilot of an enclosed cockpit ultralight may be tempted to fly through freezing rain or drizzle. Aircraft cruising in VMC above the freezing level, and then descending through a cloud layer, may pick up ice. The prerequisites for airframe icing are: the aircraft must be flying through visible, supercooled liquid; i.e. cloud, rain or drizzle the airframe temperature, at the point where the liquid strikes the surface, must be zero or sub-zero. The severity of icing is dependent on the supercooled water content, the temperature and the size of the cloud droplets or raindrops. The terms used in the Australian Bureau of Meteorology icing forecasts are: light: less than 0.5 g/m³ of supercooled water in the cloud — no change of course or altitude is considered necessary for an aircraft equipped to handle icing. No ultralight and very few light aircraft are equipped to handle any form of airframe ice moderate: between 0.5 and 1.0 g/m³ — a diversion is desirable but the ice accretion is insufficient to affect safety if anti-icing/de-icing is used; unless the flight is continued for an extended period severe: more than 1.0 g/m³ — a diversion is essential. The ice accretion is continuous and such that de-icing/anti-icing equipment will not control it and the condition is hazardous. The diagram below shows the ice accretion in millimetres on a small probe, for the air miles flown in clouds with a liquid water content varying from 0.2 g/m³ to 1.5 g/m³. The small, supercooled droplets in stratiform cloud tend to instantaneous freezing when disturbed and form rime ice — rough, white ice that appears opaque because of the entrapped air. In the stable conditions usually associated with stratiform cloud, icing will form where the outside air temperature [OAT] is in the range 0 °C to –10 °C. The continuous icing layer is usually 3000 to 4000 feet thick. The larger, supercooled droplets in convective cloud tend to freeze more slowly when disturbed by the aircraft; the droplets spread back over the surface and form glossy clear or glaze ice. Moderate to severe icing may form in unstable air where the OAT is in the range –4 °C to –20 °C. Where temperature is between –20 °C and –40 °C the chances of moderate or severe icing are small except in CB CAL; i.e. newly developed cells. Icing is normally most severe between –4 °C and –7 °C where the concentration of free supercooled droplets is usually at maximum; i.e. the minimum number have turned to ice crystals. Refer to section 3.1 Cloud formation. Mixed rime and clear ice can build into a heavy, rough conglomerate. Flying through snow crystals or snowflakes will not form ice, but may form a line of heavy frosting on the wing leading edge at the point of stagnation, which could increase stalling speed on landing. Flying through wet mushy snow, which is a mixture of snow crystals and supercooled raindrops, will form pack snow on the aircraft. The degree and type of ice formation in cloud genera are: CI, CS and CC; icing is rare but will be light should it occur AC, AS and ST; usually light to moderate rime SC; moderate rime NS; moderate to severe rime, clear ice or mixed ice. As the vertical extent of NS plus AS may be 15 000 or 20 000 feet the tops of the cloud may still contain supercooled droplets at temperatures as low as –25 °C TCU and CB; rime, clear or mixed ice, possibly severe. Freezing rain creates the worst icing conditions, and occurs when the aircraft flies through supercooled rain or drizzle above the freezing level in CU or CB. The rain, striking an airframe at sub-zero temperature, freezes and glaze ice accumulates rapidly — as much as one centimetre per four air miles. Freezing rain or drizzle, occurring in clear air below the cloud base, is the most likely airframe icing condition to be encountered by the VFR or ultralight pilot. As it is unlikely to occur much above 5000 feet amsl, choices for descent are possibly limited. 2.9.2 Effect of airframe ice Ice accretion on the wing leading edge is a major concern for aircraft not equipped with anti-icing or de-icing. Airflow disruption will reduce the maximum lift coefficient attainable by as much as 30–50%, thus raising the stalling speed considerably. Because the aircraft has to fly at a greater angle of attack to maintain lift, the induced drag also increases and the aircraft continues to lose airspeed, making it impossible to sustain altitude if the stall is to be avoided. Fuel consumption will also increase considerably. The weight of 25 mm of ice on a small GA aircraft might be about 30 to 40 kg but the increased weight is usually a lesser problem than the change in weight distribution. Also, accretion is often not symmetrical, which adds to increasing uncontrollability. Forward visibility may be lost as ice forms on the windshield. Icing of the propeller blades reduces thrust and may cause dangerous imbalance. Ice may jam or restrict control and trim surface movement; or may unbalance the control surface and possibly lead to the development of flutter. Communication antennae may be rendered ineffective or even snapped off. Extension of flaps may result in rudder ineffectiveness or even increase the stalling speed. Aircraft operating from high-altitude airfields in freezing conditions may be affected by picking up runway snow or slush, which subsequently forms ice and possibly causes problems such as engine induction icing or frozen brakes. Engine air intake icing Impact icing may occur at the engine air intake filter. If 'alternate air' (which draws air from within the engine cowling) is not selected or is ineffective, power loss will ensue. When air is near freezing, movement of water molecules over an object such as the air filter may sometimes cause instantaneous freezing. Ice may also form on the cowling intakes and cause engine overheating. Pitot or static vent icing Pitot or static vent blockage will seriously affect the ASI, VSI and altimeter, as shown in the table below, but be aware that blockage of the static vent tubing from causes other than icing — water for example — will render the ASI, VSI and altimeter useless, unless the aircraft is fitted with an alternative static source. If the static vent is totally blocked by ice Flight stage Altimeter reading VSI reading ASI reading During climb constant zero under During descent constant zero over During cruise +constant zero OK On take-off constant zero under If the pitot tube is totally blocked Flight stage Altimeter reading VSI reading ASI reading During climb no effect no effect over* During descent no effect no effect under* During cruise no effect no effect constant* On take-off no effect no effect zero* If the pitot tube is partially blocked Flight stage Altimeter reading VSI reading ASI reading During climb constant zero under* During descent constant zero under* During cruise +constant zero under* On take-off constant zero under* 2.9.3 Ice jamming control surfaces and cables Many aircraft are prone to accumulation of water from dew or rain in areas which, if that water freezes during flight, will inhibit control movement and affect hinge, cable or torque tube movement. This particularly applies to ailerons and elevators if the gap between the control surface and main structure contains some form of flexible seal (to improve aerodynamic efficiency) that allows accumulation of water. Engine controls may also be affected if exposed cables or cable runs are wet and subsequently ice up. If water has accumulated within a control surface and frozen before it has the opportunity to drain, then the mass balance of the surface will be degraded and there is a possibility of flutter development. Before flight, water should be removed from areas that may affect controls. Care must be taken to avoid flight into freezing conditions after flying through rain. 2.9.4 Hoar frost obscuring vision on take-off In frosty, still, early morning, winter conditions the air layer adjacent to the ground will be much colder and drier than the air just 10 or 20 feet higher. Pilots planning a post-first light departure in these conditions should be aware that, while on the ground, the airframe will have cooled to freezing point or below. On take-off, the aircraft will quickly rise into the warmer, moister air and it is quite possible, in an unheated cockpit, that atmospheric moisture condensing onto the cold canopy will immediately form an external light, crystalline hoar frost; refer to 'Atmospheric moisture'. The hoar frost will suddenly and completely wipe out vision through the canopy for a short period, and at a most critical time. Under slightly warmer conditions it is possible that a dense internal fogging of the canopy and instrument faces will occur during take-off, which will also wipe out forward vision for a short, but critical, period. If dewpoint is below freezing, hoar frost may be deposited on parked aircraft in clear humid conditions at night when the skin temperature falls below 0 °C. Rime ice will form on parked aircraft in freezing fog. 2.9.5 Carburettor icing Ice is formed in venturi-type and slide-type carburettors in ambient air temperatures ranging from about –10 °C to +30 °C if refrigeration and adiabatic cooling within the airways are sufficient to lower the air/fuel mixture temperature — and consequently the metal of the carburettor — below the freezing point. There must also be sufficient moisture in the air, but this need not be visible moisture. Ice may form at the fuel inlet, around the valve or slide, in the venturi and in curved passages, choking off the engine's air supply. If icing continues, this will cause the engine to stop. Carburettor ice may form in flight or when taxying; the latter event will severely degrade take-off performance. Temperature reduction within the carburettor Adiabatic cooling — in the induction system the constrictions at the throttle valve and choke venturi cause a local increase in air velocity, with consequent increase in dynamic pressure and decrease in static pressure. Density remains constant, so the temperature instantly decreases in line with the decrease in static pressure, refer to section 1.2 Equation of state. This adiabatic cooling is more noticeable when the throttle is closed or partly closed for extended periods, but it is unlikely to be more than a 5 °C drop at the coldest part, and probably much less — say 2 to 3 °C. Refrigeration cooling — when fuel is injected into the airstream a certain amount evaporates. The latent heat for fuel evaporation is taken from the surrounding air and metal, which is already being cooled adiabatically. The temperature drop caused by refrigeration may be as much as 15 °C, giving a total drop within the carburettor as high as 20 °C. If the metal of the carburettor is thus reduced to a temperature at or below freezing then cooled or supercooled water droplets will freeze on contact — as in airframe icing. Sublimation of water vapour Even if there is no visible water in the air, the temperature reduction may cause ice to be deposited on the freezing metal by sublimation of the water vapour in contact with it; refer to sections 1.5 Atmospheric moisture and 1.6 Evaporation and latent heat. The amount forming depends on the absolute humidity of the atmosphere. Normally the higher the temperature, the greater the absolute humidity can be. Thus it is possible that when flying in OAT as high as 20 °C, even 25 °C, carburettor ice can form. Air with a relative humidity of 25% at 20 °C, or 50% at 10 °C, will reach saturation at 0 °C. However, an OAT range of 0 °C to 25 °C, peaking at around 10 °C to 15 °C and with relative humidity exceeding 60%, are the most significant conditions for moderate to severe clear air icing — particularly at low throttle openings — as shown in the probability diagram below. Note that the region to the left of the 100% relative humidity line would be visible moisture — mist, fog and cloud. Locally high absolute humidity may also occur in the following conditions: poor atmospheric visibility at low levels, especially early morning and late evening after heavy rainfall in light wind conditions in clear air just after morning fog has dispersed just below a stratiform cloud base. When flying through visible moisture, cloud patches or light rain, some of this moisture will evaporate in the carburettor, further reducing the temperature in the airstream. The drop is slight but may be enough to tip the scales. The probability of icing is increased if fuel flow is not leaned — the excess fuel injected into the intake airstream increases the refrigeration. Combatting carburettor icing The formation of carburettor ice is indicated by a slow decrease in manifold pressure in aircraft equipped with a constant speed propeller, or a decrease in rpm in fixed-pitch aircraft, probably with ensuing rough running as the ice build-up further restricts the airflow and enriches the mixture. Corrective action is usually by FULL application of carburettor heat, which pre-heats the air entering the carburettor. Full carburettor heat should also be applied in conditions conducive to icing, particularly at low throttle settings such as on descent or taxying, but never on take-off. Carburettor heat will increase the fuel vaporisation in a cold engine. Application of partial heat may cause otherwise harmless ice crystals in the airstream to melt then refreeze on contact with freezing metal. Rough running may increase temporarily after application of full heat, as the less dense air will further enrich an over-rich mixture; however, full heat must be maintained until the engine eventually settles into smooth running. Pre take-off checks: note the rpm and apply full heat — the rpm should drop. Return the heat to the cold position — the rpm should return to the initial reading. If a higher reading is obtained, then icing was — and is — present. Non-venturi carburettors, such as the various slide types attached to two-stroke engines — the throttle slide performs as a throttle valve and venturi — are considered, for various reasons, not to be very susceptible to icing. Consequently, they are usually not fitted for carburettor heat, or intake air heating, on the principle that any ice formed will be immediately downstream of the slide, or multi-hole spray bar, or around the main jet, and movement of the throttle slide will dislodge it. This is provided of course, that the rpm drop is noticed before things get out of hand. STRICT COPYRIGHT JOHN BRANDON AND RECREATIONAL FLYING (.com)
 -
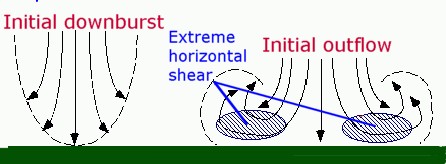 2.8.1 Boundary layer turbulence In meteorology, the term boundary layer is used to describe the lowest layer of the atmosphere in which the influence of surface friction and surface temperature on air motion is important. It is also referred to as the friction layer, planetary boundary layer or the mixed layer and is perhaps 1000 to 5000 feet thick by day and thinning by night. (Under high surface temperature conditions the depth of the layer affected by thermals can be much more extensive; see 'Dry thermals in the superadiabatic layer'.) The term 'surface boundary layer' or surface layer is applied to the thin layer (roughly 50 feet deep) immediately adjacent to the surface (and part of the boundary layer) within which the friction effects are more or less constant throughout, and the effects of daytime heating and night-time cooling are at a maximum. Air flow becomes turbulent when its natural viscosity cannot dampen out pressure forces arising when air flows past obstacles, through temperature gradients or over/around curved boundaries. In the wake of a topographic or constructed obstacle, the average wind speed is reduced but mechanical turbulence is increased. Some of the velocity energy is converted to turbulence energy; thus intense, intermittent gusts and matching lulls can be experienced on the lee side of sentinel hills, ridge lines and mountain ranges. Turbulence may take any form — eddies, vortices, upflow or downflow — and be aligned in any plane. Turbulence increases with the square of the wind speed. Doubling of wind speed will increase pressure forces, and thus turbulence, by a factor of four. Such mechanical turbulence will affect the aoa of an aircraft flying into it, even exceeding the critical aoa. The downward vertical component of eddies and gusts can cause an aircraft to sink rapidly. Such turbulence that occurs when an aircraft is flying near the surface, particularly in take-off and landing, may place the aircraft in a dangerous, possibly irrecoverable, situation. Extract from an RA-Aus accident report: "The pilot took off ... towards a saddle in a range of hills which rise 400–600 feet above the airstrip. While attempting to turn 180 degrees in the lee of the saddle he experienced strong turbulence and sink and was unable to complete the turn before the aircraft collided with the ground." 2.8.2 Low-level wind shear Generally, below 2000 feet agl and over flat terrain, the amount of horizontal and vertical shear, in both direction and speed, is largely dependent on temperature lapse rate conditions: Greater lapse rate » greater instability » greater vertical mixing » more uniformity of flow through layer and less shear. An exception is in extremely turbulent conditions below a cumulonimbus. But if the environment lapse rate exceeds about 3º C per 1000 feet then convective thermal turbulence will be severe. Convective turbulence is minimised in stable conditions, so vertical shear in the boundary layer is enhanced, with highest values in the lower 300 feet. That will affect aircraft taking off and landing. High vertical wind shear values are often attained at the upper boundary of an inversion. An aircraft climbing through the inversion layer, in the same direction as the overlaying wind, would experience a momentary loss of air speed — and lift — through the effect of inertia. Also, the difference in wind velocity between the layers, with shearing instability at the interface, causes the formation of short-lived waves across the interface; much the same way as ocean waves — which grow in amplitude until they curl up and break. The waves produce an extensive but shallow area of moderate to severe clear air turbulence. However, severe low-level wind shear can also be associated with other phenomena; for example, lee eddies, lee waves and solitary waves. 2.8.3 Convection currents Thermals When air flows over a surface heated by solar radiation, the surface contact layer is heated by conduction. If the incoming energy is sufficient, the temperature in the lower layer increases and thermals (upward convection currents) rise from the heated contact layer — perhaps initially as bubbles of buoyant air and then developing into downwind slanted, vertical currents of 50–300 metres diameter. The strength of the thermal depends on the heating and thus on the time of day, being weak in the early morning and strongest in mid to late afternoon. But if the wind builds up, turbulent mixing will disorganise the thermals. Areas of sinking air accompany the thermals, surrounding the weaker thermals and, as the day progresses, extending to fill in the inter-thermal gaps. The thermal cools at about 3° C/1000 feet and if it reaches dewpoint — the convection condensation level — cumulus will form. The release of the latent heat of condensation of the included water vapour warms the air in the thermal, and the rising cumulus convection current increases its buoyancy. If developed enough, it can draw in surrounding moist air and maintain itself as a single, steady, organised updraft or 'pulse', perhaps even forming a towering cumulus or a cumulonimbus. As the thermals grow higher, the spacing between them generally becomes wider, although adjoining thermals may merge at height. Thermals are a principal source of good atmospheric lift for soaring paragliders, hang gliders and sailplanes, and particularly so in the summer. Dry thermals in the superadiabatic layer In the arid inland areas of Australia, the very dry continental air produces generally cloudless skies with little or none of the sun's energy being absorbed as latent heat. Most of that insolation is available to heat the surface, making it far warmer than the adjacent air; ground temperatures of 80° C plus have been recorded. (Conversely, at night both the surface and the adjacent air cool rapidly, by long-wave radiation into space, dropping surface temperatures to near zero.) The daytime heating of air in contact with that heated ground produces a superadiabatic layer where the temperature lapse rate exceeds 3º C per 1000 feet. The layer is particularly unstable, with vigorous, accelerating dry thermals, and associated downflow, which may extend to 15 000 feet or more, above the terrain. Such dry thermal convection is much more powerful than that experienced in Europe where the operating limits for recreational aircraft designed for those environments is established. Powered aeroplanes flying in likely conditions should expect vertical gust shear, often with velocities greater than 20 feet per second — occasionally very much greater — and reduce cruising speed accordingly. Willy-willies A surface eddy flowing into the bottom of a thermal tends to circulate around the central core, which may develop into a vortex stretching up as a spinning column usually for hundreds, but possibly thousands, of feet. A dust devil, dust whirl or willy-willy, 30–50 feet in diameter, is sometimes visible near the surface. Rotation increases as the column elongates. Because of the added vorticity, such thermals are very dangerous to light aircraft taking off, landing or flying at low altitude. The disturbance may not be visible unless it is picking up dust, dry grass or other debris. If you sight dust whirls or disturbed vegetation in the airfield area be prepared for very turbulent conditions. Taxying, parked, even tied-down aircraft, are at risk of considerable damage. In coastal areas, cooler maritime air moving over heated, arid ground also provides conditions for propagation of willy-willies. The worst dust or sand whirls — extending to perhaps 3000 feet or more — occur in the dry, sandy interior, and can cause engine and visibility problems. Encounters of willy-willies in flight usually involve a major upset in attitude and height loss, which should generally be countered using the upset recovery technique outlined in the 'Wind shear and turbulence' module of the 'Decreasing your exposure to risk' guide. 2.8.4 Shear and turbulence near thunderstorms Thunderstorms may be classified in four generalised types — single-cell, isolated multicell cluster, multicell squall line and supercell; although supercells may also be multicellular. Their associated surface winds — originating from the downdraughts of cold, dense air — may be both high velocity and extremely turbulent. Single-cell storms are usually isolated storms moving with the mid-level wind. They are common in summer and occur in conditions where the wind velocity, relative to the cell motion, does not change markedly with height. (CB development has to be strong to overcome the detrimental effects of vertical wind shear). A single-cell storm may last less than 30 minutes, its life being limited to the growth and collapse of a single, large updraught pulse. The diameter of the storm may be less than one nautical mile and it will not move very far during its lifetime — less than 3 nm in light winds. Such storms do not usually produce violent wind shear near the surface, although microbursts may descend from even a mild-looking CB prior to its collapse. Single-cell storms tend to form in the afternoon when convection is stronger. The strong updraughts are very dangerous for hang-glider pilots. Isolated, single-cell storms, embedded in low-level cloud layers, commonly form in cold winter air streams entering the south-west of Western Australia, southern South Australia and Victoria. They are generally frequent but short-lived, with soft hail and shallow wind gusts, and are caused by destabilisation of the cold air mass. They can be accentuated by orographic effects. The passage of vigorous winter-time cold fronts, preceding Antarctic polar maritime air moving into the same areas, are likely to produce the more severe multicell storms. In summer 'cool changes' of unstable maritime air moving into South Australia and Victoria from the west/south-west sometimes produce severe storms. Multicell cluster storms (the most common thunderstorm) consist of a series of organised updraft pulses that may be separated by time and/or distance, and be closely or widely spaced. They move as a single unit and perhaps cycle through strong and weak phases. Frontal, pre-frontal, heat-trough and convergence zone systems may produce very vigorous storms several miles wide. By continually propagating new cells, these last an hour or more before the cold downdraft and outflow finally undercuts and chokes off, or smothers, the warm inflow that produces the updraft, and the system then collapses. Each new cell is usually formed in the 'zone of maximum convergence' where the gust front directly opposes the low-level wind. Weaker multicell storms advance with, or to the left of, the prevailing mid-level wind at an average rate of 10 knots or so; but the strongest storms may turn almost at right angles to the wind. The storm turns towards the flank where the new updrafts are building — the flanking line, which is a line of CU or TCU stepped up to the most active CB. If the new cells are forming on the upwind side, usually to the west or north-west (a back-building storm), it may appear to move slowly, possibly staying in one place for considerable time. Strong updraught/weak downdraught storms often form in conditions where there is moist air at most levels. Such storms produce heavy rain and may produce severe hail but, because of the lack of dry air inflow, severe low-level shear is unlikely. In severe storms, with strong updraughts and downdraughts, updraught velocities increase with height, typically 1500 feet per minute at 5000 feet and 3000 feet per minute at 20 000 feet. Updraughts of 5000 feet per minute in the upper part of a storm are not unusual. Downdraught velocities tend to be slightly less at corresponding altitudes. Vertical acceleration loads of 2–3g may be experienced in horizontal flight. The areas that most concern light aircraft are the low-level outflow regions, where downburst gusts of 50 knots or more may be reached in the initial line squall; also, lightning and hail may exist. The spreading, cold, dense current of the outflow — the gust front — may last for 10 to 30 minutes and be 1500 to 6000 feet deep. This forces the warm, moist, low-level air up and so continuously regenerates the updraught. Thus, an area up to 15–25 nm from a large storm, and 10–20 nm for a medium storm, should be regarded as a 'no-go' area for very light aircraft. An intense, narrow, initial microburst may sometimes be produced, bringing short-lived but potentially disastrous wind gusts of possibly 80 knots. There is an area of extreme, low-level shear at the leading edge of the storm, between the nose of any identifiable shelf cloud and the position the gust front has reached; possibly 1–3 nm ahead of any rain curtain. Vertical wind shear is usually detrimental to early development of CB cells. However, if there is: strong vertical wind shear, backing and strengthening with height, associated with a deep surface layer of warm moist air, below a mid-level layer of dry air, with an inversion separating the layers, and a rapid decrease in temperature with height above the inversion, then the ideal conditions are created for a severe multicell storm; or a supercell storm if the surface wind is greater than 20 knots and the vertical wind shear exceeds about five knots for each 3000 feet. The capping inversion keeps a lid on development until the lifting force builds up sufficiently to burst through the inversion and great buoyancy develops in the colder, upper layer. Upper-level divergence and a jetstream will also enhance the vertical motion. Strong wind shear both tilts the updraught and provides the means to rotate it (storm updraughts usually do not rotate) leading to the development of a supercell storm. A supercell is a severe storm with a strong, continuing, organised main updraft and co-existing strong downdrafts, controlling and directing the inflow (which may have a velocity of 30–50 knots) into the cell from the surrounding atmosphere. It will usually diverge to the left of the prevailing mid-level wind. There may be broad, anti-clockwise rotation — as viewed from below — of the cloud base beneath the main updraught. Humid, rain cooled air from the downdraught may also be pulled into the normal inflow (which is often visible as scud beneath the CB). This causes part of the cloud base to lower, forming a circular wall cloud at the updraught base. If vorticity increases within the cloud, a tornadic funnel may form. A gustnado may form on the leading edge of a gust front under a shelf cloud or similar cloud bank, lasting up to several minutes. The gustnado is a brief, intense downburst vortex indicated by rotating scud. Broad-scale rotation of a storm cell forms a mesocyclone, 1–10 nm in diameter, with a surface pressure drop of a few hPa at the centre; although a 30 hPa drop has been recorded. Supercells may last for several hours as organised systems and commonly form in warm, moist, north/north-east flow into a surface trough, and along the Great Dividing Range during summer. 2.8.5 Convective downbursts The CB downdraft can become concentrated into a downburst — a fast-moving plunge of cold, dense air. Peak wind gusts in the squall* usually last less than ten minutes, often 3 to 5 minutes, but extremely hazardous vertical gust and horizontal shear results, with extreme turbulence at the leading edge or 'gust front'. The downburst may be 'dry' or associated with precipitation ranging from virga* showers to heavy rain showers — 'wet'. The cold outflow wedges under warmer, moister air and pushes it up. A curling outflow foot of dust, tree movement or precipitation from the surface touchdown point may be visible on or near the surface. A shelf cloud often forms above the leading edge as the warmer, moister air condenses. (*In meteorological terms a squall is a wind that rises suddenly, exceeds a velocity of 22 knots and is sustained for a least a minute then dies quickly. Gusts are shorter lived. Virga is precipitation that evaporates before reaching the surface.) Microbursts are a more concentrated downburst form, often associated with warm to hot and relatively dry conditions at low levels, and convectively unstable moist air aloft with high (5000 to 10 000 feet) based CU or TCU. If the cloud is forming when the surface temperature/dewpoint spread is 15 °C to 25 °C then the microburst potential is high. The high spread means the atmosphere can retain much more water vapour. Rain falling in, and from, the cloud is evaporating (virga), thus cooling the entrained air, resulting in downward acceleration of the denser air. Consequently, flight through, under or near precipitation from a large CU involves considerable risk. Significant hail is unlikely. The most dangerous area is the horizontal density current vortex ring close to the touchdown point. The ring moves outward from the contact point at high speed until it disintegrates into several horizontal roll vortices spread around the periphery. The vortices may continue to provide extreme turbulence for several minutes; inflight breakup of aircraft is possible. The maximum horizontal winds occur about 100–200 feet above ground level. Flying directly through the outflow ring would see a 180° reversal in gust direction, and extreme shear. In bushfire conditions the firestorms associated with dry microbursts are particularly dangerous to firefighters. Microbursts occur under only 5–10% of CB but a less concentrated, longer-lasting gust front macroburst is normally associated with the entire cold air outflow of the larger storm cells. The severe gust fronts from a microburst extend for less than 2 nm, while those from a macroburst extend much further. The vertical gusts within the downburst, perhaps with a velocity twice the mean, may produce a microburst within the macroburst. (Unfortunately as a consequence of some high-profile airliner disasters in the USA, probably due to storm downbursts, the 'microburst' term now seems to be applied to all downburst events.) The following is extracted from a report by an RA-Aus pilot who apparently encountered a springtime cluster storm on the southern edges of the Great Dividing Range, north-east of Melbourne, only 13 nm from home, but — fortunately — in a very tough recreational aeroplane. "I had encountered a few small rain showers that lasted 15-20 seconds when all of a sudden I noticed the altimeter going nuts ... the next thing to happen was the Cobra Arrow was lifted and it felt like it was just thrown over end first, I pulled the power and then the fun really started; I was now heading to the ground 2000 feet below at over 160 knots ... inverted and going down quick. I can recall just yelling. I pushed down elevator and commenced a bunt — or the upward half of an inverted loop — then a half roll. That's got it up the right way then I was thrown to the right at the same time dislocating my left shoulder, inverted again and rolled back to upright then to the left and bang in went the shoulder; all the time just flying and waiting for something to give! I managed with good luck and a lot of skill to get out of this situation ... I have done a fair amount of aerobatics and I think it more than saved my life this day. I started to ease the power and flew clear of the main front, leaving the mountains two minutes later in blue skies and sunshine and almost nil wind. The most worrying thing about the whole ordeal was that I had seen a small front about 3 miles to the west. It had actually run past me. I was looking towards home and feeling pretty good but in the mountains anything can happen. The microburst came back up a valley and changed direction almost 180 degrees. I can remember the trees just getting smashed about. I got a real close-up view of them as the back blast of the burst was shoving me upwards. I was only about 200 feet above them. After landing at Coldstream we were able to watch the cell's continuing progress from the ground. It moved around the hills over Healesville then south towards Silvan before coming back around and passing directly over the airfield." 2.8.6 Squall lines The usual precipitation downdraft associated with an individual CB cell tends to be concentrated towards the leading edge of the storm where the cold, heavy outflow spreads out at ground level, forming a small, high-pressure cell 10–15 nm across. The dense air lifts the warmer, moist air in its path and may initiate an extremely dangerous, self-amplifying, convective complex.Within this, neighbouring storm cells consolidate into a towering squall line of large thunderstorm cells ranged across the prevailing wind direction. At locations in the path of the squall line, the resultant line squall occurs as a sharp backing in wind direction, severe gusts, temperature drop, hail or heavy rain and possibly tornadoes. If the squall line is formed in an environment of strong mid-level winds the surface gusts may exceed 50 knots. Squall lines vary in length; some of the longest are those that develop in a pre-frontal trough 50–100 nm ahead of a cold front. These squall lines may be several hundred nautical miles in length and 10–25 nm wide moving at typically 25 knots; their very high altitude anvils extend considerably further. The squall line shown in the adjacent BoM weather radar plot is about 250 nm long. The squall lines form ahead of the front as upper air flow develops waves ahead of the front; downward wave flow inhibits and upward wave flow favours uplift. Squall lines are a common northern Australian feature. They develop along active areas of the Inter Tropical Convergence Zone, within the feeder bands of tropical storms, along sea breeze fronts or other convergence zones, and in the summer heat trough. In south-east Australia they may also be associated with fast-moving winter cold fronts, producing severe winds and heavy rainfall. During daylight hours the squall line may appear as a wall of advancing cloud with spreading cirrus plumes; the most severe effects will be close to each of the numerous CB cells. The convective complex releases a tremendous amount of latent heat and moisture, which may be sufficient to generate a warm core mesoscale cyclone, and consequent poor flying weather, lasting several days. 2.8.7 Storm avoidance It can be seen that any downburst encounter — whether the vertical gust or the turbulent horizontal outflow — will be deadly to any light aircraft; any thunderstorm activity or potential activity should be given a very wide berth. Stay well away from any storm sighted — perhaps 10 nm for single cells to 25 nm for the largest storms — and never attempt to fly between storm cells. Be prepared to reverse course if it looks doubtful. Never fly under a CB base, and expect that storm cells may be embedded within an otherwise innocuous cloud layer. It is known for hail to fall from an apparently clear sky; this, in fact, originates from the high anvil of a CB many miles away and, of course, a lightning strike will certainly ruin your day. An encounter with heavy rain may produce total loss of visibility combined with a loss in both airspeed and lift. Before any flight, check the online BOM weather watch radar and the area forecasts for storm activity or developing winds. Don't place total faith in the written forecast — check the latest surface chart for the position of pre-frontal zones, convergence zones, developing inland lows, surface troughs, dips in the isobars or other conditions that might indicate possible storm development or increasing winds. Remember that the latter also brings increasing gusts and thus low-level shear and turbulence; 15 minutes spent checking might save 15 weeks repair — for you and/or your aircraft. Check the sky all round at a reasonable height after take-off; if you have any doubts about what you see, scrub the flight! Light aircraft should not be operating in the vicinity of thunderstorms. The following is an extract from an RA-Aus fatal accident investigation report. "The pilot departed Holbrook airfield in a Sapphire aircraft for his private strip about 30 minutes away ... a line of large thunderstorms were active in the area and a witness reported that one of the nearby cells not only had virga visible below the cloud but also exiting horizontally ... the pilot was aware of the approaching weather and, indeed, was trying to beat it home ... the aircraft impacted the ground in a near vertical attitude ... about 100 metres short of the threshold of his strip ... the owner of the adjacent farm on which the aircraft crashed stated that there were thunderstorms within five kilometres and that a wind squall had passed through the area at the precise time the sound of impact was heard." Michael Thompson's storm chasing diary at ozthunder.com/chase/chase.html provides some excellent reports and photographs of storm encounters in eastern Australia. 2.8.8 Tornadoes, landspouts and waterspouts A tornado is a rapidly rotating, narrow air column extending from the updraught base of a CB to the ground. Intense tornadoes usually develop from areas of rotation inside supercells. One theory is that the horizontal vortices produced by the low-level shear are tilted upward by the updraught inflow initiating the rotation within the cell, which develops into a mesocyclone. The vortex — deriving its energy from the latent heat of condensation released from the warm, moist inflow — spins at perhaps 30 knots, accelerating if the column contracts. Another theory is that the tornado forms when a smaller, more rapidly rotating updraught causes part of the storm base to lower — thus forming a rotating wall cloud from which a condensation funnel cloud appears, which may reach the ground. The funnel is usually located on the edge of the storm?s main updraught, close to the downdraught. The tornado diameter at the tip can vary from a few metres to a few hundred metres. Winds at the outer edge may reach 100 knots and there may be a substantial pressure drop within the core, with the magnitude being about 30 hPa per 1000 feet of funnel length. Some 15 to 20 tornadoes are reported annually in south-east and south-west Australia. Their intensity and size is predominantly classified as ?weak and short-lived? (1–3 minutes). They usually move from the north-west at 30 knots or so and damage a strip perhaps 50 metres wide by 2 kilometres long. (In April 1960, though, a tornado in jarrah forest near Collie, Western Australia cut a swathe 240 metres wide and 30 kilometres long, destroying tens of thousands of trees.) Although tornadic storms can occur in any season, day or night, they are often associated with dewpoint temperatures exceeding 10 °C and an inversion at 6000 feet or so. Bushfires may trigger their development. Areas of high incidence are west of the Dividing Range from southern NSW to central Queensland, western Victoria and the south-west corner of Western Australia. A tornado that struck Brisbane in November 1973 produced winds estimated at 135 knots. Also a wind velocity of 90 knots was reported in the fatal tornado at Sandon, Victoria in 1976. Fujita damage scale number for tornadic winds: F0 35–62 knots: light damage (covers Beaufort scale 8 to 11) F1 63–95 knots: moderate damage — caravans overturned, cars pushed off roads. (Beaufort scale 12 starts at 63 knots) F2 96–135 knots: considerable damage — roofs off, large trees uprooted, light missiles F3 136–180 knots: severe damage — house walls off, heavy cars lifted and thrown F4 181–225 knots: devastating damage — well constructed houses levelled, structures blown some distance, large missiles generated F5 226–275 knots: incredible damage — strong timber houses lifted and carried considerable distance to disintegrate, car sized missiles fly in excess of 100 m. Landspouts and fair weather waterspouts develop, from the surface up, in a superadiabatic or similar layer within an environment with little vertical shear. The landspouts and waterspouts tend to develop from low-lying eddies along wind shifts which, in the unstable atmosphere, roll up into vertical vortices about 0.5 nm in diameter. If a vortex happens to get caught in the updraught under a TCU or developing CB then the updraught stretches (and contracts) the vortex, and the tornado-like landspout or waterspout may form. The funnel is usually indicated by dust in a landspout, but the moist sea air will provide a visible condensation funnel, plus a sheath of spray, around a 'fair weather' waterspout. In Australia most waterspouts occur in northern waters. But the world record height of a waterspout, off the New South Wales south coast in 1898, was measured from land by theodolite at 5014 feet, but this was most likely a tornadic waterspout; i.e. a tornado moving out over coastal waters. Multiple or cluster spouts may form in the one location. Photographs and descriptions of tornadoes, gustnadoes and waterspouts observed in south-east Queensland can be viewed in the Brisbane Storm Chasers Web site. 2.8.9 Other pre-frontal turbulence Cold fronts generally travel south of 25° S latitude and west to east. Their passage produces pre-frontal/frontal wind shear, the severity of which increases with the speed of frontal movement and the temperature differential across the front. For example, a front moving at 10 knots with 5° C differential would probably produce only light/moderate shear, while one moving at 30 knots with 10° C differential is likely to produce very severe shear. New South Wales Southerly Buster The NSW Southerly Buster is an intense, pre-frontal squall leading a cold front moving up from the Southern Ocean. It occurs maybe 30 times per year, with about 10 major events usually in spring and summer. The phenomenon is a shallow density current, 20–50 nm wide, centred on the coast and surging northward at 15 knots with 30–60 knot gusts. The temperature may fall 10–15 °C over a few minutes and there may be extreme low-level turbulence. A spectacular roll cloud may form above the nose of any frontal cloud, but usually there is little cloud and consequently little warning. A prime cause of the Southerly Buster is the interaction of a shallow cold front with the blocking mountain range that parallels the coast; frictional differences over land and sea uncouple the flow. Other phenomena lead to intensification of the temperature gradient between the warm air mass and the cold density current; for example, a hot north-westerly or a warm dry foehn wind preceding the squall. Severe thunderstorm activity may result from the forced lifting of warm, humid air. Sea breeze fronts In coastal areas, differential diurnal heating promotes development of on-shore breezes which, during the day, grow in strength to 'moderate breeze' and, due to Coriolis effect, begin to back. The surface wind is a resultant of the sea breeze vector and the gradient wind vector. In hot land conditions, the sea breeze front (a density current) can travel 100–200 nm inland by midnight, if not blocked or diverted by terrain. The cool air lifts the warmer inland air (providing a lift source for gliders) and, if conditions are suitable for deep convection, a squall line may develop and propagate along the convergence line of the surface flow. Opposing sea breeze fronts, such as occur in Cape York, may cause strong convergence disturbances when they meet. Along the eastern Queensland coast, typically between September and March, storm lines of CB up to 100 nm in length form inland in mid- to late-afternoon then move towards the coast, and are out to sea by mid-evening. Such squall lines may be difficult to avoid if encountered unexpectedly. 2.8.10 Low-level jets Low-level jets may form by interaction between anticyclones and mountain barriers — particularly in the area west of the Dividing Range in northern NSW and southern Queensland. This produces a zone in the friction layer, which may extend 50 nm plus, where wind velocity is highly geostrophic and concentrated both vertically and horizontally, so that large, low-level shears are produced. Core speeds of 25–30 knots,and up to 50 knots, occur in an otherwise light surface wind area, particularly early to mid-morning in winter, with the anticyclone centred over the interior. The overnight cooling of the western slopes produces a horizontal temperature gradient. A low-level jet in a circuit area is very dangerous to light aircraft. 2.8.11 Lee wind downflow, eddies, rotors and vortices Pilots of aircraft flying on the lee side of higher topographic features — particularly if taking off or landing, or flying parallel to a ridge — should be aware that the downflow (sinking air) encountered can exceed a powered aircraft's climb capability; there is usually no indication of the downflow other than that sinking feeling! (Of course glider pilots will find atmospheric upflow on the windward side of the ridge providing the opportunity for 'ridge soaring'.) Strong sink conditions may occur on the lee side of mountains, ridges, valley walls, hills and islands, and even extend above the height of the barrier. The severe sink associated with this lee side downflow is a function of wind speed and slope angle. For example, if the horizontal wind speed is 29 knots and the slope angle is 15 degrees then the ambient downslope velocity is about 30 knots [29 / cosine 15° = 29 / 0.97 = 30]. The sink vector is equivalent to sine 15 degrees [15 / 60] = 0.25 x 30 = 7.5 knots or about 750 feet per minute — greater than the maximum climb rate of many ultralights. This downflow airstream may be non-turbulent, particularly when associated with standing wave conditions, so a pilot may not have an early indication of the danger. Turbulent eddies/curl-overs within the downflow may add to the ambient sink rate. The following is an extract from an RA-Aus fatal accident investigation. Note: the Capella aircraft was last sighted in flight over a lightly forested area not far above tree-top height and thought to be intending to land in the grounds of a winery familiar to the pilot. The aircraft impacted the ground almost on the apex of a small rise and about halfway down the slope in a lawn area. Weather was fine with good visibility, and wind was 10 to 15 knot northerly with strong gusts. "Indentations in the ground and damage to the aircraft indicate that the aircraft had initially contacted the ground travelling in a north-westerly direction at a relatively low forward speed but with high downward force. The wind direction and strength combined with the topography at the accident site (a long east-west ridge to the north) would have combined to produce a small standing wave with significant downflow. An aircraft approaching at minimum speed and tree top height could expect significant sink in that area. This could translate to loss of airspeed if the pilot was concentrating solely on touching down on a given spot." Injuries suffered when an aircraft sinks with high vertical decelerations are usually very much more severe than those suffered in horizontal decelerations of similar magnitude. Some pilots have expressed the opinion that a light aircraft cannot get into real trouble in a lee sink situation because the airstream must level out before reaching the surface and so will take the aircraft with it. This is not so; inertia is related to mass and the mass of a molecule of metal is far greater than that of an air molecule. Eddies with large sink rates, possibly greater than 1000 feet per minute — lee wind eddies — may occur, in only moderate wind conditions, on the lee side of mountains, ridges, hills and islands. Sink will be particularly dangerous when accompanied by high temperature (i.e. high density altitude) and high aircraft loading. Airfields along the eastern Australian coastal strip will be influenced by lee downflow and eddies when the westerlies are blowing during August to October. Vortex-like turbulence tends to develop when slope gradients exceed one in three [18°] and it appears at a lower level than the long horizontal vortices associated with lee waves. As the vortices stream downwind, severe turbulence may be encountered at and below the hilltop level and for some distance downstream. Pre-conditions for these streaming or trailing rotors are a stable layer, a wind vector component across the barrier exceeding 20 knots, and this component should decrease considerably not far above the barrier. Horizontal lee eddies can also develop from friction with the mountain side; this normally requires an inversion at or below the mountain top with a strong, sustained wind exceeding 20 knots. The eddies may be visible if cloud forms under the inversion. Wake vortices, similar to those produced from aircraft wingtips, can develop in the lee of lone hills and peaks in strong, sustained wind conditions. The strong — often twin — spiral turbulence can be felt at a distance ten times hill height and at altitudes considerably above and below hill height. In 1966 a BOAC Boeing 707 suffered in-flight breakup in such conditions, while giving passengers a view of Mt Fuji on a cloudless day. A search and rescue aircraft recorded airframe loads of +9g /−4g when flying through the same vortices. Ravine winds can also develop wake vortices. Ravine or gap winds occur in narrow gaps which that part a mountain range. The pressure difference between the two sides of the barrier when moderate to strong wind flows across the range creates a pressure gradient — with consequent strong, turbulent winds in the ravine and flowing from the exit. This also applies to gullies, to some extent. Effect of windbreak eddies Turbulent windbreak eddies will form in the lee of obstacles such as trees adjoining an airstrip. The distance they spread from the windbreak is dependent on the density and height of the trees. Generally, the windbreak affects airflow for a horizontal distance equal to ten times the height of the tree line, if the flow is perpendicular to the windbreak; the more turbulent flow is closest to the trees. There will also be a significant lee-side downflow extending over the windbreak shadow, its vertical component being dependent on the ambient windspeed. Such downflow conditions require that take-off and approach speeds are higher than normal, and that ample clearance is provided — not a place to be low and slow! In addition, in conditions of high solar radiation, the differential heating of airstrip surfaces caused by partial shading can promote turbulent vertical eddies over the take-off area. The following is an extract from an ATSB fatal accident investigation. "The pilot and his passenger were conducting a private flight in the pilot's Jabiru aircraft in the Southport area. Several other pilots heard the pilot advise over the radio that he was conducting a simulated engine failure and glide approach. The aircraft subsequently impacted a steep embankment short of runway 19 at Southport aerodrome and on the extended runway centreline. The embankment was approximately 2 m high, about 210 m from the displaced approach threshold and 30 m short of the sealed runway surface. An examination of the wreckage indicated that the aircraft had impacted the embankment in a moderately nose-high, left wing-low attitude. Damage to the propeller indicated that the engine was delivering significant power at the time of impact. Local procedures required that pilots conduct right circuits when operating on runway 19. Tall trees adjacent to the aerodrome induced localised mechanical turbulence, windshear and downdrafts when the wind was from the southeast. At the time of the accident, the wind was recorded on the Gold Coast Seaway as 150 degrees at 15 knots, gusting to 18 knots. It is likely that the aircraft entered an area of turbulence and high sink rate generated by the prevailing wind over the adjacent trees. Given the evidence of significant power at the time of impact, it is possible that the pilot had initiated a go-around at a stage in the approach from which it was not possible to establish a positive rate of climb." 2.8.12 Mountain waves Mountain waves or lee waves are a manifestation of an internal gravity wave. Such waves occur fairly frequently over, and in the lee of, the mountainous areas of south-eastern Australia, and in the lee of the mountains along the east coast in strong westerly wind flow conditions. Conditions favourable for the formation of strong mountain waves, and which would be provided in the outer fringes of a high pressure system, are: an isothermal layer or inversion at about ridge height, sandwiched between a low-level unstable layer and instability, or low stability, aloft a wind, in excess of 20 knots, crossing a ridge at a high angle and increasing in velocity with height. A sharp change in wind direction within the stable layer and a large amplitude wave may induce stationary vortex or rotor flow. These vortices differ from the streaming rotors formed in lee wind eddies. They are closed with a long horizontal axis; form in the lee of, and parallel to, a well-defined escarpment, and remain fixed in position. Curl-overs may also be produced by friction slowing the near-surface downflow. Usually cloud will not form in the vortex but should it do so, it may range from scraps of scud to a long, solid roll cloud. Turbulence in and under the rotor area, i.e. from the mountain height down, will be severe to very severe. Some evidence of the rotor may be seen on the surface — rising dust, sudden and erratic wind changes, etc. Readers interested in the techniques recommended for flight in such conditions should check www.mountainflying.com If conditions are suitable, lenticular cloud that appears along the crests may reveal the waves; the stationary clouds continuously form and dissipate in the vertical air motion. Vertical movement of 2000 feet per minute is common in lee waves and could be much greater; the vertical component being dependent on wave length and amplitude. Lee wave downflow can easily exceed the climb capability of any powered light aircraft. In suspected lee wave, or potential vortex, conditions it is advisable to clear the lee side of a ridge or escarpment at an altitude well above it and to cross the ridge lines at an oblique angle; never attempt to cross a ridge at 90° when flying into wind in potential lee wave conditions. Wave length tends to increase with stronger wind aloft, and is also affected by temperature and stability conditions. The shorter the wave length, the steeper the ascents and descents. Amplitude depends on airstream plus the shape and size of the ridge. It will be at a maximum within the stable layer, particularly if the layer is shallow with great stability. The larger the amplitude, the further the air moves up and down. Over a plain, the wave effect can continue for 100 nm. The disturbance may extend to the stratosphere. Depending on length and amplitude, mountain waves may produce considerable areas of smooth, laminar uplift and sink — much sought-after by experienced sailplane pilots. Mountain waves are unlikely to break unless the amplitude is high, but if they do break then moderate to severe clear air turbulence will result. A resonating mountain or orographic wave will produce strong, adiabatically warming downslope winds — called foehn in Europe, chinook in the Rocky Mountains area and Canterbury north-wester in New Zealand. In January 1943, a temperature rise of 27 °C (− 20 °C to 7 °C ) was recorded in the space of two minutes in Spearfish, South Dakota. The resonating waves may reach extreme heights and may produce downslope windstorms exceeding 100 knots in the lee of high, extensive mountain barriers. Updrafts and downdrafts in excess of 3000 feet per minute are common; 7000 feet per minute has been reported in the USA. Weak foehn winds occur regularly in the south-east Australian coastal strip under the influence of westerly or north-westerly flows; they can bring unseasonal warming to areas around Lakes Entrance, Victoria, for example. 2.8.13 Valley winds Valleys and gullies tend to develop their own rather turbulent air circulation, somewhat independently of the ambient wind overflow. They have a tendency to flow up or down the valley/gully regardless of the general wind direction. However, if the overflowing wind exceeds 20 knots or so then significant downflow and turbulent eddies may form over the windward slopes of larger valleys, whilst rising air may be experienced over the leeward slopes. Thus aircraft contemplating a 180-degree turn within such a valley should first move over to the leeward side before commencing the turn; if available an appropriate flap setting should be used to allow a slower speed, smaller radius turn. This minimises the risk of encountering turbulent downflow on the windward side. Circulation within valleys may also be modified by solar heating of the valley slopes. Anabatic winds form during the day when hillside slopes are heated more than the valley floor. The differential heating of contact air causes air to flow upslope. Wind speeds of 10 knots or more may be achieved. 2.8.14 Solitary waves Solitary waves — external gravity waves or undular bores — are common in the dry interior of northern Australia, particularly in spring prior to the wet season. They occur as severe, low-level clear air disturbances (a horizontal vortex) accompanied by a transient surface wind squall. When sufficient moisture is present a long, continuously forming roll cloud may appear with base at 500–1000 feet agl and top at 3000–5000 feet agl. Long distance soaring capability is provided by the uplift at the front of solitary waves. The roll cloud (and thus the vortex) may extend for several hundred nautical miles. Because it forms along the wave leading edge updraft and evaporates in the trailing edge downdraft, it appears to roll backwards. The wave may manifest itself as one large amplitude wave closely followed by several smaller diminishing waves. Solitary wave disturbances seem to be generated on an inversion by a disturbance such as late afternoon thunderstorm activity, the collision of opposing sea breeze fronts or the interaction of the northern end of a cold front with a developing nocturnal inversion. The waves, usually a 'family', propagate at a speed of 15–30 knots, relative to the ambient air flow, in a low-level stable layer under an inversion at 1500–2000 feet or so with a deep stable layer above. The neutral layer enables the wave to propagate without being damped and to travel long distances; i.e. the layer acts as a wave guide. The Gulf of Carpentaria Morning Glory is a product of the late-afternoon interaction of the sea breeze fronts on Cape York. The north-easterly sea breeze, aided by the prevailing easterly/south-easterly winds, is more dominant than the westerly sea breeze. The westerly breeze increases the depth of the cooled surface layer and produces a sharp gradient in the low-level wind profile. The surging higher-density air from the north-east collides with the westerly flow. This builds a long ridge of the cooler, denser air protruding into the inversion. The resulting disturbance in the inversion layer, when the convergence collapses at night, produces solitary waves in the boundary layer that propagate to the south-west on the nocturnal inversion. The waves reach the southern Gulf coastline about dawn and provide an amazing soaring ride for sailplane and hang-glider enthusiasts. Similar phenomena occur in other parts of the world but are not as extensive, or as regular, as the Gulf of Carpentaria phenomenon. Photographs of magnificent Gulf of Carpentaria roll clouds can be viewed on the Morning Glory web site. Be sure to view the Gulf of Carpentaria satellite image for 8 October 1992 (8:00 am local time) to see the Morning Glory threaded diagonally right across the Gulf. The occurrence of several roll clouds arriving in the Burketown, Queensland area from the north-east, south-east and south, during the same morning has been recorded. When opposing solitary waves meet, they pass through each other and reform their shape and velocity. If unaccompanied by a roll cloud, solitary waves arrive unannounced, presenting a very severe low-level wind shear and turbulence hazard to aircraft. With suitable surface conditions, aircraft flying at low levels may be warned by a line of raised dust. With the passage of a wave, the closely spaced updrafts and downdrafts may each exceed 2000 feet per minute and the transient wind gusts may vary surface wind by 30 knots or more; not something to fly into head-on, but providing an outstanding ride for the capable pilot. 2.8.15 Aircraft wake vortices Aircraft themselves induce another form of mechanical turbulence. All aeroplanes (and helicopters) develop wake vortices in flight, their size and energy being dependent on both the aircraft's mass and the dimension of the lift coefficient. The latter, of course, is dependent on aoa and wing configuration (i.e. flap and high-lift device settings) so, for any particular aircraft, its wake vortices are greatest at the slowest flight speeds — at rotation for take-off followed by the climb out, plus the approach followed by the flare for landing. The relatively large surface area and the shape of weight-shift trike wings, at high aoa during take-off and landing, generate significant vortices that may trap any following aircraft with a low wing loading. In light winds, the vortices generated by aircraft the size of twin turboprops tend to persist for at least a couple of minutes as they slowly sink a couple of hundred feet below the flight path and, of course, drift with the wind. Gusty wind conditions or contact with the ground will dissipate vortices more rapidly but will spread additional turbulence while doing so. It is often thought that an aircraft encountering the wake vortices from an aircraft of similar size would not be unduly upset; however, this is not so and particularly if the vortex is of higher energy such as that generated by a high lift coefficient STOL aeroplane. Such encounters with relatively small vortices can be very dangerous if there is insufficient height to recover from any consequent uncommanded roll and yaw; and, of course, the upset will increase in severity as the relative mass of the vortex-generating aircraft increases. The most likely points of wake encounter are when turning base to final behind an aircraft landing from a straight-in approach and before touchdown or after lift-off if too close to any aeroplane. Certainly it is wise for light aircraft to anticipate and avoid encounters with the vortices from significantly larger aircraft. The general concept is to follow at least two minutes behind them in take-off or landing, and try to maintain a flight path somewhat above (which may not be possible) and upwind of the preceding aircraft. (In 1994 a Mooney 201 aircraft failed to do that when taking off behind an RAAF Hercules at Wagga Wagga, New South Wales, and ended up as wreckage alongside the runway.) 2.8.16 Clear air turbulence Turbulence above the boundary layer and not directly associated with convective cloud is clear air turbulence [CAT]. CAT is usually associated with regions of strong vertical wind shear and temperature inversions; with jet streams, particularly in convergence/divergence areas; or with internal gravity waves, generated in the lee of mountain regions. The waves may break at various altitudes and distances from origin, generating many patches of CAT. Thus CAT is not just a concern for high-altitude aircraft; it can also adversely affect aircraft flying at comparatively low altitudes. Gravity waves, with consequent turbulence near thunderstorm tops [TNTT], also propagate from the intrusion of strong convective clouds into a stable upper layer. Upper-level turbulent patches vary in length from one to thirty nautical miles and are usually less than 2000 feet deep. Aircraft loads of minus 1g to plus 3g may occur. Upper-level frontal zones form independently of surface fronts in conjunction with jet stream intensification and with strong temperature gradients. The frontal zones are characterised by subsiding dry air and a downfold in the tropopause. Strong wind shear at the zone produces severe CAT. 2.8.17 Effect of heavy rain Flight through rain causes a water film to form over the wings and fuselage; if the rain falls at a rate exceeding perhaps 20 mm per hour, the film over the wings is roughened by the cratering of drop impacts and the formation of waves. The effect, which increases with rainfall rate, is a lowering of the lift coefficient value at all angles of attack, with laminar flow wings being most affected and fabric wings least affected. The stall will occur at a smaller angle of attack; i.e. the stalling speed increases, which is further compounded by the increased weight of the aircraft. The water film will increase drag, and the encounter with falling rain will apply a downward/backward momentum, which may be significant to a light aircraft. Propeller performance is degraded and water ingestion may affect engine output. Thus the rain effect can be hazardous when operating in conditions of low excess aircraft energy — typically when taking off, landing or conducting a go-around. Visibility through a windscreen may be zero in such conditions, so a non IFR-equipped aircraft will be in difficulties. Further reading The online version of CASA's magazine Flight Safety Australia contains some articles relating to microscale meteorological events, which are recommended reading. A categorised index of articles of interest to recreational pilots contained in Flight Safety Australia since 1998 is available on this site. Particularly check the articles in the 'Micrometeorology and weather emergencies' category; there are also relevant articles within the other categories. STRICT COPYRIGHT JOHN BRANDON AND RECREATIONAL FLYING (.com)
 -
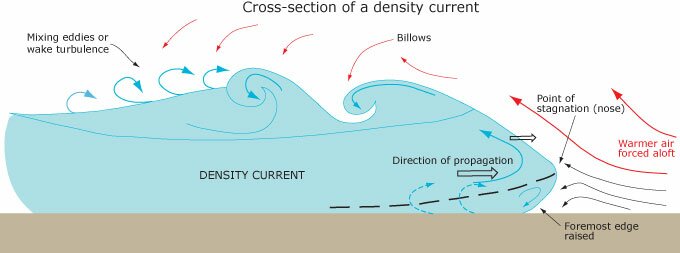 2.7.1 Thermal systems Density or gravity currents A density or gravity current is formed whenever denser air intrudes into and displaces less dense air, and (usually) flows across the surface; for example, katabatic winds, convective cloud downbursts and the New South Wales Southerly Buster. Density current motion is dependent on dynamic pressure, hydrostatic pressure and surface friction. These, in turn, are dependent on the height of the intrusion and the relative densities. The flow speed is also a function of the ambient wind flow. Two circulations evolve within the head of a density current, and provide the mass for the mixing billows and eddies. One is below the nose, or point of stagnation (as with an aerofoil), due to surface friction. The other is above the nose where the internal speed is greater than the current propagation speed. The nose tends to repeatedly collapse and reform as the current advances, thereby adding to the turbulence of the squall. A strong, opposing, ambient wind would tend to flatten the nose into a wedge shape. The advancing head of density currents, such as the NSW Southerly Buster, often have no warning cloud associated with them. On the other hand they may produce a spectacular shelf cloud, or arcus, by forcing the warmer inflow air to rise. The leading edge of the shelf may become detached to produce a horizontal cloud tube — a roll cloud. The passage of the leading edge of a density current is marked by a temperature fall, pressure jump and a strong gust-line with large, rotational shear. Other thermal systems include: thunderstorms squall lines tornadoes and sea breeze fronts. 2.7.2 Wave systems Gravity or buoyancy waves Wave motion is the basic mechanism by which local disturbances are transferred from one part of the atmosphere to another without net mass transport. Gravity waves, or buoyancy waves, are pressure waves generated by disturbances within the atmosphere, where the restoring forces (potential energy) for the wave motion are provided by buoyancy and gravity, rather than compression and expansion as in higher-frequency acoustic waves. The kinetic energy is provided by mass; i.e. an air parcel, vertically displaced by a disturbance, will be acted on by gravity because its density differs from its environment. The potential energy of displacement is converted to kinetic energy when buoyancy returns the parcel to its original level. However, kinetic energy reaches a maximum at its original position, so the parcel overshoots that position and again is returned by the restoring force of buoyancy. The air parcel tends to oscillate around its undisturbed position, at a typical frequency of 5–10 minutes. If successive parcels of air are subject to displacement then a gravity wave is generated in the direction of propagation. The source of the disturbance could be orographic effects, frontal lines, density currents, jet streams, convection penetrating a stable layer, squall lines or low level turbulence. Gravity waves can be external waves or internal waves. External waves are those propagating on a discontinuity surface such as an inversion or — in regions where the gradient is strong enough to guide the propagation in a direction perpendicular to the gradient — a solitary wave. Ocean waves are external gravity waves. Internal waves propagate horizontally or obliquely to the density strata. If propagating obliquely they transport energy to the upper atmosphere and produce clear air turbulence. If the layer in which internal waves are produced is bounded above and below by discontinuity surfaces — for example the ground, or density or wind discontinuities — then the upward oblique waves may then be deflected downward, so the waves are then effectively contained within a wave guide. Mountain waves are an example where, depending on the thickness of the layers and the intrusion of the mountain into the airstream, the deflected energy may return in phase with the following primary waves. In this case, the amplitude of the deflected waves adds to the primary wave and the wave grows by resonance. Strong convective cloud punching into a stable layer aloft may generate internal gravity waves and consequent clear air turbulence within the upper layer; e.g. turbulence near thunderstorm tops. Passage of a gravity wave is marked by a pressure jump and a wind change but no change in temperature or humidity, as there is no air mass change. The vertical lifting may initiate cloud and precipitation. Solitary waves are well-known wave systems. 2.7.3 Orographic systems The orographic systems of interest are: Slope and valley winds Low-level jets Lee wind downflow, eddies, rotors and vortices STRICT COPYRIGHT JOHN BRANDON AND RECREATIONAL FLYING (.com)
 -
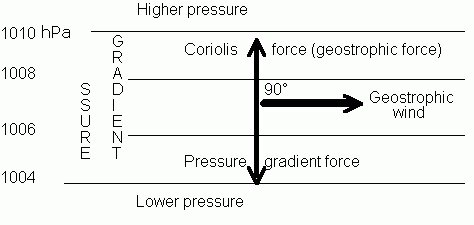 2.6.1 Geostrophic and cyclostrophic winds Winds exist because of horizontal and vertical pressure gradients, so atmospheric motion can be deduced from isobaric surface charts. In the absence of surface friction, if the horizontal pressure gradient force is exactly balanced in magnitude by Coriolis effect then accelerations of the air will be relatively small and a geostrophic wind (from the Greek 'geo' = earth, strophe = turning ) will flow horizontally at a constant speed that is proportional to the isobaric spacing gradient. The flow will be perpendicular to the two opposing forces and parallel to straight isobars. Air will be accelerated to the extent that these forces are unbalanced. Transitory disturbances and vertical movement will create imbalance. When vertical motion is present the horizontal wind cannot be exactly geostrophic. Geostrophic flow is predominant above the friction layer in very large-scale weather systems, where the pressure gradient force and the Coriolis force are nearly equal and opposite; e.g. the Southern Ocean west wind belt. Between 15°S and 15°N latitudes there is little geostrophic flow due to weak Coriolis effect (it being zero at the equator), and winds tend to flow across the isobars. (In which case it is more useful to show wind flow on upper air charts as streamlines. A streamline arrow shows the direction of flow, whereas an isotach is a line along which the speed of flow is constant.) At the other end of the scale in short-lived mesoscale systems, Coriolis has insufficient time to take effect or is relatively weak compared to other forces, so geostrophic balance is not present and air accelerations can be quite large. If atmospheric circulation was always in perfect balance between geostrophic forces and pressure gradient forces, geostrophic winds would flow and there would be no change in pressure systems. In reality the pressure distribution takes the form of curved isobars resulting in a third force — the centripetal acceleration — which pushes the flow inward of the curve. The gradient wind is the equilibrium wind for the three forces — centripetal acceleration, pressure gradient force and Coriolis (or geostrophic). It is roughly aligned with the isobars on the meteorological surface chart. The vector difference between the geostrophic and the gradient winds is the ageostrophic wind. Thus, ageostrophic movement is large for small-scale systems and small for large-scale systems. When the centripetal acceleration becomes the major control of the gradient wind, there is an extremely strong curvature of the airflow and the winds are called cyclostrophic (Greek = circle – turning); for example, tropical cyclones and tornadoes. When a body is moving in a curved path, centripetal force is the radial inward force that constrains the body to move in that curved path and, even at constant speed, there is an inward acceleration resulting from the body's continually changing velocity. (The same applies to an aircraft in a constant-speed level turn.) The equal and opposite centrifugal force that appears to act outward on a body moving in a curved path is a fictitious force, but convenient to show the equilibrium forces for air moving in a cyclonically curved path; e.g. around a surface low pressure system, thus: For the gradient wind to follow cyclonically curved isobars, the pressure gradient force must be slightly stronger than Coriolis to provide the centripetal force. As the magnitude of the Coriolis is directly dependent on wind speed, it follows that the wind speed around a low is less than would be expected from the pressure gradient force and the gradient wind is sub-geostrophic. For air moving in an anticyclonically curved path (e.g. around a high), the opposite occurs, and the Coriolis provides the centripetal force. For the three forces to be in equilibrium, the Coriolis must exceed the pressure gradient force. Consequently, the gradient wind speed must be greater than would be expected from the pressure gradient force — and thus is super-geostrophic. Air moving within a pressure pattern possesses momentum. If the air moves into a different pressure pattern and gradient it will tend to maintain its speed and Coriolis for some time, even though the pressure gradient force has changed. The resultant imbalance will temporarily deflect the airflow across the isobars in the direction of the stronger force — Coriolis or the pressure gradient force. 2.6.2 Effect of surface friction The Earth's surface has a frictional interaction with atmospheric motion that reduces the wind speed and thus the Coriolis effect. The pressure gradient force remains the same, so the wind is deflected towards the region of lower pressure. The friction effect is greatest at the Earth's surface and reduces with height until, at the top of the friction layer or boundary layer, the wind velocity is the gradient wind. This will usually occur somewhere between 1500 feet and 5000 feet above the terrain — much lower over the sea. In this 'spiral layer' the cross-isobar flow is greatest at the surface and decreases with height, while the speed of the flow is least at the surface and increases with height. So, the gradient wind flow tops the boundary layer and, as height within the layer decreases, the wind speed decreases and the wind direction veers* (in the southern hemisphere, backs* in the northern) until the wind velocity at the surface has the maximum cross-isobar component and a much lower speed. Thus, in the presence of surface friction — a force that always acts opposite to wind direction — the veering boundary layer air spirals in towards a low (clockwise rotation) and out from a high (anticlockwise rotation) in the southern hemisphere. *The terms veering and backing originally referred to the shift of surface wind direction with time, but meteorologists now also use the terms when referring to the shift in wind direction with height. Winds shifting anti-clockwise around the compass (e.g. from west to south) are 'backing', while those shifting clockwise (e.g. from south to west) are 'veering'. Velocity change between surface wind and gradient wind Over land, the surface wind speed may be only 30–50% of the gradient wind speed. In the boundary layer, wind slants across the isobars in the direction of the gradient force; i.e. towards the lower pressure. The stability of the boundary layer affects the strength of the friction force; a very stable layer suppresses turbulence and friction is weak, except near the surface. In a superadiabatic layer, convective turbulence is strong and the friction force will also be strong (refer to sections 3.3.2 and 9.1). The following table is for a typical neutrally stable layer, and shows the daytime average angular change in wind direction for an average wind profile over various terrains and beneath a moderately strong gradient wind of 30 knots or so. Typical vertical wind profile Height (feet) Flat country Rolling country Hilly country Wind speed (knots) below 500 +30° +36° +43° 12 500 – 1000 +22° +30° +36° 20 1000 – 2000 +10° +17° +25° 25 2000 – 3000 +2° +5° +10° 28 Within the friction layer the wind is backing as height increases; the change in direction in the first 300 feet is negligible in strong winds but greatest in light winds (below 10 knots) and may be as much as 15–20° if the surface wind is less than 5 knots. The greatest change in wind speed occurs at night and early morning. Also read the 'Wind shear and turbulence' module of the 'Decreasing your exposure to risk' guide. 2.6.3 Calculating low-level geostrophic wind speed The geostrophic wind can be estimated from the isobar spacing on a surface (mean sea level) synoptic chart. The estimation is usually a reasonable approximation of the wind speed around 3000 feet agl over much of Australia. The equation applied is: Geostrophic wind speed (knots) = 3832 G × T / P sine L where G = horizontal pressure gradient in hPa/km T = air temperature in Kelvin units P = msl pressure in hPa L = the latitude in degrees Because the proportion T/P normally doesn't vary greatly at msl, the equation can be simplified to: Geostrophic wind speed (knots) = 2175/D sine L where D = the distance in kilometres between the 2 hPa isobars on the chart. The sine of an angle less than 60° can be estimated easily without reference to tables by using the 1-in-60 rule of thumb; i.e. the sine of an angle is roughly degrees × 0.0167 [or 1/60]; e.g. sine 36°S = 36 × 0.0167= 0.601; or 36/60 = 0.6 The following table is derived from the preceding simplification and shows the estimated wind speed in knots for spacings between the 2 hPa isobars, from 40 to 600 km. If the surface chart shows 4 hPa spacing, then just halve the estimated distance between the isobars and still use the table below. Estimated wind speed from 2 hPa isobar spacings of 40 to 600 km Latitude 40 km 60 km 80 km 100 km 120 km 160 km 200 km 400 km 600 km 10°S 300 210 160 130 110 80 60 30 20 20°S 160 110 80 65 55 40 30 16 10 30°S 110 75 60 45 35 30 25 12 8 40°S 90 60 45 35 30 25 18 10 6 2.6.4 Slope and valley winds Valleys tend to develop their own air circulation, somewhat independent of the ambient wind overflow. They have a tendency to flow up or down the valley regardless of the prevailing wind direction. This circulation is modified by solar heating of the valley slopes. Anabatic winds form during the day when hillside slopes are heated more than the valley floor. The differential heating of contact air causes air to flow upslope. Wind speeds of 10 knots plus may be achieved. Katabatic winds normally form in the evening. They are the result of re-radiative cooling of upper slopes, which lowers the temperature of air in contact with the slope and causes colder, denser air to sink rapidly downslope. In some circumstances, katabatic winds can grow to strong breeze force during the night but cease with morning warming. Anabatic and katabatic winds are usually confined to a layer less than 500 feet deep. However, the turbulence — and the sink — associated with a katabatic wind will adversely affect aircraft. Aircraft flying in a southern Australian valley late in a warm evening should expect the onset of katabatic winds. Katabatic winds are density or gravity currents. They can also occur in the tropics; for example, the Atherton tablelands in northern Queensland form a plateau adjacent to the tropical coast. Winter nocturnal temperatures on the plateau can reduce to near freezing and the cold, dense surface layer air flows downslope onto the warm coastal strip. In some cases katabatic winds can persist for days; an extreme example is the large-scale diurnal katabatic winds flowing from the dome of intensely cold, dense air over the Antarctic ice plateau — average elevation 6500 feet. These winds can achieve sustained speeds exceeding 80 knots, though speeds of 160 knots have been recorded at Commonwealth Bay — the windiest place on earth. 2.6.5 Squalls and gusts Squalls or 'squally winds' are a sudden onset of strong wind lasting at least a minute then dying quickly. Wind speeds exceed 22 knots, and possibly reach 70–90 knots. They may be associated with a thunderstorm (rain squall, snow squall), with a squall line, with a dry outflow from a thunderstorm in the interior (dust squall) or with an intense cyclone where the squall reinforces the strong environment wind. Gusts or 'gusty winds' are onsets of increased wind speed that exceeds the mean wind speed by at least 30% but are shorter-lived than squalls, and often complemented by matching lulls. 2.6.6 Tropical cyclones Tropical cyclones form only in very moist air in ocean regions where surface water temperatures exceed 26 °C. They generally occur between November and April, and in latitudes 5° – 20° South and are prominent features on the synoptic charts. Coriolis effect within 5° of the equator is too weak to develop the initial vorticity and sea surface temperatures are too low at latitudes higher than 20°. To be named as a tropical cyclone (typhoon in South-east Asia) the storm must have sustained wind speeds exceeding 33 knots; if wind speed is less, it is a tropical depression. In the eastern Pacific and the Atlantic the tropical cyclone would be named as a tropical storm for wind speed between 34 and 62 knots, then upgraded to hurricane status when the sustained wind speed exceeds 62 knots; the hurricane is then downgraded back to tropical storm when it weakens. Small tropical depressions (warm-core lows) form on a trough line. Warm-core lows usually become less intense with increasing height but — powered by the latent heat of condensation and if the vertical wind shear is low (below 20 knots) — some become more intense with height. They develop into a tropical storm or a monsoon low, with a very rapid updraught. This may create a cyclostrophic vortex and possibly grow, over two or three days or even less, into a full-scale tropical cyclone, with wind speeds often much greater than 62 knots. A gust of 139 knots was recorded at Mardia, near the Pilbara coast of Western Australia, in February 1975. The pressure drop within the tropical cyclone may be 50 to 100 hPa. (TC Orson produced a msl pressure of 905 hPa at the North Rankin gas platform in April 1989.) The diameter of the vortex may be 400 km, with a central eye 20–40 km in diameter surrounded by spiral feeder bands of CB cloud reaching the tropopause. The dry air in the eye usually descends slowly and warms adiabatically; near the surface it may be 5–8 °C warmer than the surrounding cooled air. The enormous energy within a large tropical cyclone can result in a local lifting of the tropopause; the Atlantic hurricane Bonnie of August 1998 produced chimney clouds reaching 59 000 feet. The tropical cyclones affecting Australia mainly form in the Coral Sea, Arafura Sea, Timor Sea and the Gulf of Carpentaria. They are usually more compact, but no less severe, than their counterparts elsewhere. While developing, the cyclone usually drifts to the west or south-west at about 10 knots. Sometimes it recurves and accelerates to the south-east and, unless it crosses a coastline, loses its impact by 30° S. They last about six to 10 days (although TC Justin persisted for three weeks off the Queensland coast in 1997. When a cyclone crosses a coast it loses the source of latent heat from the warm, moist ocean air, and weakens into a rain depression, which has high potential for major flooding. About nine tropical cyclones occur around Australia each year. Wind speeds felt at the surface in the south-west quadrant, before recurving, will be much greater than those in the north-east quadrant, due to the addition or subtraction of the forward movement to the rotational movement. Wind speeds of 148 knots, with a core pressure of 877 hPa, have been recorded in Pacific Ocean tropical cyclones. Monsoon lows are a feature of the active period of the northern Australian wet season. They develop over land from tropical depressions but don't grow into a tropical cyclone unless they move offshore. Monsoon lows bring turbulence, low cloud and heavy rain with reduced visibility over an extensive area for a considerable time; as does a tropical cyclone when it weakens into a rain depression. Further information concerning tropical cyclones can be found at the Australian Bureau of Meteorology's tropical cyclone page. Tropical cyclone categories The Australian Bureau of Meteorology defines cyclone intensity in its area of responsibility, 90°E to 160°E, from category 1 to category 5, according to the expected strongest gust, as below: 1 below 69 knots Negligible damage to houses. Damage to crops, trees and caravans 2 69 to 92 Minor house damage, significant damage to trees and caravans. Heavy damage to crops 3 93 to 120 Roof and structural damage. Power failure likely 4 121 to 150 Caravans blown away. Dangerous airborne debris 5 above 150 knots Extremely dangerous with widespread destruction Cyclone Tracy, which wrecked Darwin (24/12/1974) was category 4, but the highest recorded gust in the city was 117 knots. Cyclone Vance (22/3/99) was category 5. The Saffir-Simpson scale, however, is used in the Atlantic and Eastern Pacific for categorising hurricane intensity: Saffir-Simpson scale Class Central pressure Max. 1 minute sustained speed Damage potential Tropical depression below 33 knots nil Tropical storm 33 – 62 minimal Hurricane cat.1 above 980 mb 63 – 83 minimal Hurricane cat.2 965 – 980 84 – 96 moderate Hurricane cat.3 945 – 965 97 – 113 extensive Hurricane cat.4 921 – 945 114 – 135 extreme Hurricane cat.5 below 921 over 135 knots catastrophic 2.6.7 Determining wind velocity During pre-flight planning, pilots determine the forecast wind velocities, at various cruising levels and at aerodromes along their route, by reference to forecast information provided by an authority such as the Australian Bureau of Meteorology or Airservices Australia. Meteorological forecast information for an area [an ARFOR] can be obtained from Airservices Australia's NAIPS Internet Service. See Obtaining weather forecasts, NOTAM, first light and last light. The real-time weather observations, at about 190 airfields, can be obtained by telephoning the Australian Bureau of Meteorology automatic weather station at the location and listening to the audio data. See AWIS in the VHF radiocommunications guide. As the flight progresses, the navigation techniques employed enable calculation of the actual wind velocity at cruising level. While airborne, a radio-equipped aircraft can usually obtain a report of actual weather conditions at the larger aerodromes; see 'Acquiring weather and other information in-flight' in the VHF radiocommunications guide. If a mobile phone is carried, the AWIS (if available) can be used to obtain surface wind and some other weather data. However, surface wind velocity at smaller airfields can be estimated from the probable wind profile knowing the upper level velocity — see 'Effect of surface friction' above — or determined by observation. Determining surface wind direction visually while airborne Apart from an airfield windsock, the most obvious indicators of surface wind direction are dust from agricultural operations or moving vehicles and smoke from chimneys or smaller fires. Wind ripples in grassland, crops or tree tops provide a reasonable indication in light to moderate winds, as does wave movement on small to larger lakes. In lighter winds the wind shadow of still water, at the upwind edge of a small lake or dam, is usually apparent. And, of course, when the aircraft is flying at a lower level the aircraft's drift is a strong indicator of the near-surface winds. The Beaufort wind speed scale (land) No. Wind speed Gust speed Meteorological classification Terms used in general forecast Wind effect on land 0 <1 knot calm calm Smoke rises vertically 1 1 – 3 light air light winds Smoke drifts 2 4 – 6 light breeze light winds Leaves rustle, water ripples; '15 knot' dry windsock tail drooping 45° or so 3 7 – 10 gentle breeze light winds Wind felt, leaves in constant motion, smooth wavelets form on farm dams and small lakes, smoke rises at an angle above 30°; '15 knot' dry windsock tail 15° or so below horizontal 4 11 – 16 moderate breeze moderate wind Small branches move, dust blown into air, crested wavelets form 5 17 – 21 fresh breeze fresh wind Small trees sway, smoke from small fires blown horizontally; '15 knot' dry windsock horizontal 6 22 – 27 strong breeze strong wind Large branches sway, whistling in wires 7 28 – 33 near gale strong wind Whole trees in motion 8 34 – 40 43 - 51 fresh gale gale wind Twigs break off, difficulty in walking 9 41 – 47 52 - 60 strong gale severe gale Some building damage 10 48 – 56 61 - 68 whole gale storm Trees down 11 57 – 62 69 - 77 storm violent storm Widespread damage 12 63 + 78 + tropical cyclone tropical cyclone Severe extensive damage The Beaufort wind speed scale (sea — and perhaps large lakes) 0 – Sea is mirror-like 1 – Ripples present but without foam crests 2 – Small wavelets, glassy appearance and do not break 3 – Large wavelets, crests begin to break, with scattered white horses 4 – Small waves becoming longer, fairly frequent white horses 5 – Moderate waves, many white horses with chance of spray 6 – Large waves are forming with extensive white foam crests, spray probable 7 – The sea heaps up, white foam from breaking waves is blown in streaks 8 – The edges of crests break into spindrift with well marked, foam streak lines 9 – High waves with tumbling crests and spray, dense foam streaks 10 – Very high waves with overhanging crests, surface appearance white, visibility affected 11 – Chaotic sea, large parts of waves blown into spume with foam everywhere 12 – Air filled with foam and spray, visibility severely impaired State of seas classification The following table is the state of seas classification, with likely maximum wave height in metres, used in general meteorology reports and warnings for Australian coastal waters: Calm zero No waves Rippled 0.1 m No waves breaking on beach Smooth 0.5 m Small breaking waves on beach Slight 1.3 m Waves rock buoys and small boats Moderate 2.5 m Sea becoming furrowed Rough 4 m Sea deeply furrowed Very rough 6 m Disturbed sea with steep-faced rollers High 9 m Very disturbed sea with steep-faced rollers Very high 14 m Towering seas Phenomenal >14 m Hurricane seas State of swell classification The following table is the state of swell classifications used for reporting the wave-train height and length: Swell height Swell length Low swell 0 - 2 m Short 0 – 100 m Moderate 2 - 4 m Average 100 – 200 m Heavy >4 m Long >200 m The length and speed of the wave-train can be calculated readily if the period (in seconds) is measured; i.e. the length in metres is 1.56 × the period squared and the speed in knots is 3.1 × the period. e.g. if period = 10 seconds, then train lengths = 156 metres and propagation speed = 31 knots 2.6.8 The compass rose and the wind rose In nautical terms there are 32 compass 'points' each division being 11.25° of azimuth. Winds shifting anticlockwise around the compass rose are 'backing', those shifting clockwise are 'veering'. The names of the compass points and the associated compass direction in degrees are shown in the following table. The term 'by' indicates plus or minus one point (11.25°) in the stated direction; e.g. 'nor'east by north' indicates north-east (45°) minus 11.25° = 33.75°. Compass rose points 11.25 North by (one point) east 191.25 South by (one point) west 22.50 Nor'nor east 202.50 Sou'sou'west 33.75 Nor'east by north 213.75 Sou'west by south 45.00 North east 225.00 South west 56.25 Nor'east by east 236.25 Sou'west by west 7.50 East nor'east 247.50 West sou'west 78.75 East by north 258.75 West by south 90.00 East 270.00 West 101.25 East by south 281.25 West by north 112.50 East sou'east 292.50 West nor'west 123.75 Sou'east by east 303.75 Nor'west by west 135.00 South east 315.00 North west 146.25 Sou'east by south 326.25 Nor'west by north 157.50 Sou'sou'east 337.50 Nor'nor'west 168.75 South by east 348.75 North by west 180.00 South 360.00 North The wind rose The term 'wind rose' nowadays applies to the diagram meteorologists use to represent the wind velocity statistical data collected for a particular location. To view the wind rose for a specific location in Australia, go to the Bureau of Meteorology's wind rose page. STRICT COPYRIGHT JOHN BRANDON AND RECREATIONAL FLYING (.com)
 -
 2.5.1 Air masses An air mass is a relatively homogeneous body of air usually covering millions of square kilometres of the Earth's surface and perhaps around 20 000 feet thick; even extending to the tropopause. To be homogeneous, the air mass source region must be exclusively continental (dry air) or exclusively maritime (moist air). All air mass source regions lie in tropical (warm air) or polar (cold air) latitudes. The air masses originating there are modified by passage into — and interaction within — the mid-latitudes, so producing 'mid-latitude air'. The modification of the air mass, by heating or cooling from the surface it is passing over, will change stability. Additional heating will make moist air more unstable, while additional cooling makes moist air more stable. Low-level convergence produces upper-level instability and low-level divergence produces upper-level stability. The air masses, and their source regions, affecting the Australian climate are: Equatorial maritime: Hot, humid air with dewpoint around 25 °C, bringing monsoon conditions to northern Australia. Tropical maritime: Warm, humid air with dewpoint around 20 °C, bringing showers, rain and tropical cyclones. Tropical continental: The source region is northern Australia. Hot, dry air in summer, dewpoint around 0 °C, bringing heat waves to southern Australia. Warm, dry air in winter, dewpoint around 4 °C. Southern Ocean maritime: Cool, moist air with dewpoint around 10 °C, bringing clouds, rain and drizzle to southern Australia. Antarctic polar continental/maritime: Cold, moist air with dewpoint around 5 °C, bringing cold outbreaks to southern Australia with snow and sleet. (South of Australia, the coastline of Antarctica lies north of the Antarctic Circle with the ice pack extending to about 60°S, only 1200 km from Tasmania). Frontal zones, or fronts, separate air masses of different characteristics. They usually extend from the surface to the middle troposphere, and occasionally to the upper troposphere. Within the frontal zone, changes of temperature, pressure, density and wind velocity are large compared to changes outside the frontal zone. In section 4 we established that the Antarctic front is the boundary region between the intensely cold Antarctic polar continental air and the warmer, moister polar maritime air. Also that the polar fronts are the major frontal regions of the southern hemisphere — mixing between polar air, mid-latitude air and returning tropical air. The Antarctic and polar fronts are quasi-stationary frontal regions, and may extend for several thousand nautical miles. They are distinct from the mobile cold fronts that directly affect southern Australia's daily weather patterns. The diagrams below indicate typical positions of the air masses, and the polar and Antarctic fronts, in the summer and winter seasons. 2.5.2 Extra-tropical cyclones The effect of the potential energy stored in the zone of strong surface temperature gradient in the polar frontal regions, with the cold air masses pushing north-west and wedging under the warmer air pushing south-east, is that the polar fronts spawn a series of migratory depressions south and west of Australia — typically in latitudes 35°S – 45°S. The depressions tend to be intense — surface pressures below 940 hPa with gradients of 50 hPa over 1500 km have been recorded. These transient depressions forming in the westerly wind belt (also known as cold-core cyclones, lows, storm depressions or, more correctly, extra-tropical cyclones) — often with embedded, smaller-scale storms — are the principal cause of day-to-day weather changes in southern Australia. A common theory for the development of these extra-tropical cyclones is that the interaction of the air masses cause a disturbance to develop on the line of the polar front. This initiates the process of converting the potential energy of the strong temperature gradient into the kinetic energy of a developing extra-tropical cyclone, so distorting the polar front into a wave-like configuration. The extent of each wave/trough is dependent on which air mass is stronger at that point. A wave crest may develop into an extra-tropical cyclone after several days (see following diagrams A to G) forcing southward movement of the warm air and northward movement of the cold air as mobile fronts. The intense, mobile cold front moves at 15–30 knots, faster than the warm front which it may eventually overtake to form an occluded front. That may then lead to an intensified storm. The development of the low also requires that the mass of the vertical column of air over the area is reduced by mass divergence, thus reducing the surface pressure. Consequently, the upper-air Rossby waves — and the jet streams — support and direct (and may enhance) the development of surface cyclones and other features. The maturing storm depression usually moves south-east to about 60°S – 65°S, into the Ross Sea and the sub-polar low belt. Here, cut off from the warmer moister air, it decays. Depressions may have a life cycle of one week or so. Some primary depressions may head north-east into the high-pressure belt. As they are then isolated from the westerly wind belt, they are consequently termed cut-off lows. Depressions tend to travel in groups of three or four, creating large eddies in the westerly wind belt. Secondary depressions occur on the trailing arm of the primary low cold front, and may curve north-east before decaying or swinging to the south-east. These secondary lows are often fast-developing, intense, short-lived storms. The spring-time msl analysis (below) from the World Meteorological Centre, Melbourne, shows the synoptic features in a polar projection of half the southern hemisphere, from the prime to the 180° meridians. It covers the area of southern Africa at the left, the Indian and Southern oceans, Antarctica at the bottom, and Australia/New Zealand at the right. The planetary-scale synoptic features displayed are the Antarctic polar high and the two anticyclones of the sub-tropical high belt extending a ridge right across the chart and centred at 35°S — also with a spur extending south to link into the polar high. There are also three or four centres of low pressure in the sub-polar low belt just off the Antarctic coastline at 65°S, each associated with an extensive front — some extending for maybe 3000 nautical miles. These are the polar fronts. There are about four migratory lows in the westerly wind belt at 55°S, one at 150°E and a group around 30°E — each associated with mobile cold and warm fronts. The unusual element is the long trough (the dashed line) extending from north-west Australia into the Tasman Sea and the Southern Ocean. The front passing over the south-east corner of Australia brought with it a cold outbreak of polar maritime air. The diagrams below are a four-day msl pressure forecast issued by the Australian Bureau of Meteorology [BoM]. Note the position of the fragmentary warm fronts well south of the mainland, and the frontal trough systems between the highs. A wide selection of the Bureau's daily msl analysis and prognosis charts can be viewed at BOM charts. In winter, intense primary depressions can develop at rates of one hPa per hour with the pressure gradient steepening towards the centre. Lows also develop in regions where no significant surface temperature gradient exists. They develop from the interaction of airstream flow and consequential frontal development. Weak lows may also form on the lee side of the Great Dividing Range. Occasionally a cold-core high — which unlike a warm-core high, decreases in intensity with height — will form in the southern polar maritime air mass behind a cold front. They are usually short-lived, as the upper levels are warmed by subsidence, and the system moves north-east and merges with the high pressure belt. However, such highs behind an intense low can direct a major cold outbreak of sub-Antarctic air into south-eastern Australia. If the cold-core anticyclone stays in the Southern Ocean and persists, it may form a blocking high, which interrupts and diverts the normal movement of the mobile cyclones. The same result is achieved if a warm-core high extends further south than normal. 2.5.3 Mobile cold fronts The mobile cold fronts, which develop with the extra-tropical cyclones, are typically 5000 feet deep at the nose and expand with depth. They may be 150 to 800 nm long and advance eastward at speeds of 15 to 40 knots — as indicated on the surface chart below. Mesoscale fronts may be much smaller. Small but sharp fronts also develop in the middle and upper troposphere. Warm fronts occur in the region where warm, less dense air is moving in the general direction of the south pole and sliding up over the semi-stationary colder, denser air. The resultant slope is in the region of 1:100 to 1:300. Cold fronts — where colder, denser air is pushing under semi-stationary, warmer air — have a typical slope of 1:60, but the warmer air is tending to ascend slantwise across the slope of the cold front. As the extra-tropical cyclones generally develop south of Australia — and the consequent warm fronts move south — the passage of a warm front over the mainland is rare. Part of a weak warm front may pass over Tasmania from a low developing in the south-east mainland corner or in Bass Strait. Such warm front occurrences over land are fragmentary, weak and transient. The BoM surface chart below shows a weak warm front forming at the south-east mainland corner, it subsequently disappeared within 24 hours. Similarly occluded fronts are rare occurrences in Australia; so, the remainder of this section deals solely with the structure and effects of cold fronts. The presence of a front does not of itself imply cloud formation and rain. Convergence is necessary to produce rain, and when the front is remote from a depression, then convergence may be absent. Cold fronts moving northward into south-west Queensland are usually shallow and diffused but may trigger a surge in the prevailing easterlies. The two diagrams below show the cross-section of typical summer cold fronts. The upper diagram is that of an active summer cold front. When the low pressure system weakens, or the cold front trails towards the high pressure region, the air aloft subsides and warms, the upper cloud disappears and the front weakens — as shown in the lower diagram. Note that the diagrams greatly exaggerate the frontal slope. In winter, if the normal pattern of eastward movement is halted then cold fronts will cross south-east Australia every few days. They are usually relatively weak but with widespread cloud bands, low cloud bases and showery precipitation. Some winter cold fronts may be vigorous and fast moving, with embedded thunderstorms and a narrow band of cloud and precipitation. Such winter fronts are usually associated with a very deep depression forming further north than usual. Cross-section of an unstable cold front When an active cold front moves north-east — particularly in spring and summer — a subsidence may occur in the cold air behind the frontal zone, which causes the frontal zone to bulge ahead of its surface position. Thus, the lifting of the warm air occurs ahead of the frontal surface position and is accompanied by increased instability — the nose of the cold front pushes up a bow wave that creates lift similar to orographic lift. Depending on the moisture content of the lifted air, thunderstorms — or even a squall line — may form ahead of the front. The sequence of events associated with the passage of such a front moving at 25 knots (but without a squall line) might be as follows: In the transition zone ahead of the front, warm to hot north to north-westerly winds freshen, pressure is falling and cirrus clouds are moving from the west, three to six hours prior to passage of the front; this is followed by lowering cloud (Ac, As and Ns). Some rain occurs just ahead of the front, then thunderstorms and violent gusts, and the temperature drops suddenly as the frontal zone passes. In the cold air behind the front, the clouds and showers clear quickly, the wind backs to south/south-west and the pressure rises. There may be a number of pressure changes in the transition zone ahead of any cold front, usually including wind squalls. The airflow in the zone is very unstable, producing large changes in wind velocity — both horizontal and vertical — and distinct lines of convection cells, which may form a squall line particularly in spring and summer. 2.5.4 Synoptic isobaric features East coast lows and cut-off lows Depressions forming off south-west and south-east Australia tend to be large, deep and slow moving. They may dominate the local weather system, bringing heavy rain for several days, particularly in the cooler season. These depressions may be cut off from the westerly wind belt by a high pressure cell or ridge to their south. Deep cut-off low off Western Australia coast Slow moving, cut-off low — eastern coast Blocking pairs About ten times per year a semi-stationary system of high and low pressure cells, located in the Tasman Sea, can block the normal easterly procession of the highs and lows. The blocking pairs occur most frequently in winter with the low pressure cell or trough closer to the equator and the high pressure cell on the polar side, both out of their normal zone. (The high could be a warm-core high that has drifted south-east or a persistent cold-core high). A strong north/south wind is set up between them and the upper, westerly wind flow is split — with one part passing on the northern side of the blocking pair and the other part passing on the southern side. Blocking pairs can cause abnormal weather patterns in south-east Australia. Persistent and recurring pairs lead to low rainfall and drought conditions. 2.5.5 The north-west cloud band The north-west cloud band is a frequent feature in satellite weather images, typically extending over 2500 nm and existing for two to four days. Most occurrences disintegrate after six days. It originates in a convective system in the Indian Ocean south and west of Indonesia, where tropical maritime air flowing poleward on the western flank of a high pressure ridge — extending through eastern and northern Australia — conflicts with a pre-frontal trough of colder, drier air extending from southern Australia into north-western Australia. The maritime air is forced to rise, producing heavy stratiform cloud that eventually extends from the convective source (which continues to feed moisture into the system) to south-eastern Australia. The phenomenon occurs once or twice a month during the colder months. The vertical extent of the cloud band increases toward the south-east with a lowering base and an increasing height of the tops. Two or three times a year a fully active band will present cloud cover right across Australia, extending — unbroken — from very low levels to above 20 000 feet and joining with a low pressure system in the south-east corner. Heavy rain is often associated with the bands and conditions less than standard visual meteorological conditions [VMC] can exist for days. STRICT COPYRIGHT JOHN BRANDON AND RECREATIONAL FLYING (.com)
 -
 2.4.1 General global circulation As the Earth rotates at a constant rate and the winds continue, the transfer of momentum between Earth–atmosphere–Earth must be in balance and the angular velocity of the system maintained. (The atmosphere is rotating in the same direction as the Earth but westerly winds move faster and easterly winds move slower than the Earth's surface. Remember, winds are identified by the direction they are coming from not heading to!) The broad and very deep band of fast-moving westerlies in the westerly wind belt, centred around 45°S (but interrupted at intervals by small, migrating lows moving east — not shown in the diagram above) lose momentum to the ocean through surface friction, resulting in the Southern Ocean's west wind drift surface current. The equatorial easterlies or trade winds and, to a lesser extent the polar easterlies, gain momentum from the Earth's surface. That gain in momentum is transferred, to maintain the westerlies, via large atmospheric eddies and waves — the sub-tropical high and the sub-polar low belts. These eddies and waves are also part of the mechanism by which excess insolation heat energy is transferred from the low to higher latitudes. Globally, the equatorial low pressure trough is situated at about 5°S during January and about 10°N during July. Over the Pacific Ocean the trough does not shift very far from that average position — but due to differential heating it moves considerably further north and south over continental land masses. In Australia the trough will sometimes approach Alice Springs — latitude 23°S in the hot centre of the continent. The average summer msl pressure chart shows the position of the three most intense low pressure areas of the trough over South America, Africa and Australia/Papua-New Guinea. The low-level air moving towards the trough from the sub-tropical high belts at about 30°S and 30°N is deflected by Coriolis, and forms the south-east and north-east trade winds. Coriolis effect deflects air moving towards the equator to the west and air moving away from the equator to the east. Thus, when the north-east trade winds cross the equator in the southern summer, they turn to become the north-west monsoon which brings the 'Wet' to northern Australia. 2.4.2 Cross-section of tropospheric circulation 2.4.3 The intertropical convergence zone and the Hadley cell The trade winds converging at a high angle at the equatorial trough, the 'doldrums', form the intertropical convergence zone [ITCZ]. The air in the trade wind belts is forced to rise in the ITCZ and large quantities of latent heat are released as the warm, moist, maritime air cools to its condensation temperature. About half the sensible heat transported within the atmosphere originates in the 0–10°N belt, and most of this sensible heat is released by condensation in the towering cumulus rising within the ITCZ. A secondary convergence zone of trade wind easterlies — the South Pacific convergence zone — branches off the ITCZ near Papua-New Guinea, extends south-easterly, and shows little seasonal change in location or occurrence. Over land masses the trade winds bring convective cloud, which develops into heavy layer cloud with embedded thunderstorms when the air mass is lifted at the ITCZ. The ITCZ is the 'boiler room' of the Hadley tropical cells, which provide the circulation that forms the weather patterns and climate of the southern hemisphere north of 40°S. The lower-level air rises in the ITCZ then moves poleward at upper levels — because of the temperature gradient effect — and is deflected to the east by Coriolis, at heights of 40 000 – 50 000 feet, while losing heat to space by radiative cooling. The cooling air subsides in the sub-tropical region, warming by compression and forming the sub-tropical high pressure belt. Part of the subsiding air returns to the ITCZ as the south-east trade winds thus completing the Hadley cellular cycle. (The system is named after George Hadley [1685-1768], a British meteorologist who formulated the trade wind theory.) At latitudes greater than about 30°S the further southerly movement of Hadley cell air is limited by instability, due to conservation of momentum effects, and collapses into the Rossby wave system. The Hadley cell and the Rossby wave system — combined with the cold, dry polar high pressure area over the elevated Antarctic continent — dominate the southern hemisphere atmosphere. Fifty per cent of the Earth's surface is contained between 30°N and 30°S, so the southern and northern Hadley cells directly affect half the globe. 2.4.4 The sub-tropical anticyclones The subsiding high-level air of the Hadley cells forms the persistent sub-tropical high pressure belt, or ridge, that encircles the globe and which is usually located between 30°S and 50°S. Within the belt there are three semi-permanent year-round high-pressure centres in the South Indian, South Pacific and South Atlantic oceans. In summer, anticyclonicity also peaks in the Great Australian Bight. In winter the high-pressure belt moves northward, the high in the Bight extends and migrates into a large, semi-permanent winter anticyclone over southern Australia. The Indian Ocean centre produces about 40 anticyclones annually which, as they develop, slowly pass from west to east, with their centres at about 38°S in February and about 30°S in September. The anticyclones, or warm-core highs, are generally large, covering 10° of latitude or more, roughly elliptical, vertically extensive and persistent, and with the pressure gradient weakening towards the centre. The anticyclones are separated by lower-pressure troughs. Winds move anticlockwise around the high, with easterlies on the northern edge and westerlies on the southern edge. Air moving equatorward on the eastern side is colder than air moving poleward on the western side. The high-level subsiding air spreads out, chiefly to the north and south of the ridge due to the higher surface pressures in the east and west. Thus the position of the sub-tropical high belt dominates Australian weather. In summer, when it is centred just south of the continent, sub-tropical easterlies cover much of Australia, with monsoonal movement in the north. In winter the belt, being further north, allows the strong, cold fronts that are embedded in the westerlies to affect southern Australia (refer to section 5.2). 2.4.5 The Antarctic polar high and the sub-polar low belt The lowest surface temperatures on Earth occur at the Antarctic continent, at minus 80 °C or less. The very dry air allows any long-wave radiation to escape without any appreciable atmospheric warming. The cold-core Antarctic polar high is quite shallow — 5000 to 10 000 feet deep — which decreases in intensity with height, and has a very steep inversion and an extensive upper-level low aloft; the combination of high pressure and low temperatures producing very dense air. The air moving in an anti-clockwise direction around the anticyclone produces the surface outflow belt of polar easterlies. But, over the high-altitude icecap, tropospheric circulation consists of mid and upper-level inflow and katabatic outflow in a shallow surface layer. (A monthly mean katabatic wind of 58 knots has been recorded at Commonwealth Bay.) Very cold air masses and minor highs can split off the main Antarctic air mass — following passage of a major cyclone — and move northwards in winter, bringing the very cold Antarctic continental/maritime air towards Australia. By contrast, due to the Antarctic ice cap elevation of 6000 to 13 000 feet, Southern Ocean storms usually do not penetrate the Antarctic region south of Australia and surface pressure mainly depends on elevation. A series of deep lows — usually centred between 50°S and 60°S and tending further south during the equinoctial periods (the Antarctic sub-polar low belt) — surround the Antarctic polar high, the boundary between the two systems is formed by the polar easterlies. This boundary between the intensely cold continental air and the warmer, moister polar maritime air is termed the Antarctic front. 2.4.6 Rossby waves and the westerly wind belt Upper westerlies blow over most of the troposphere between the ITCZ and the upper polar front. They are concentrated in the westerly wind belt where they undulate north and south in smooth, broad waves. These waves comprise one, two or three semi-stationary, long wave, peaks and troughs. They occur during each global circumnavigation and have a number of distinct mobile short waves; each about half the length of the long waves. The amplitude of these mobile Rossby waves, as shown on upper atmosphere pressure charts, varies considerably and can be as much as 30° of latitude. Then the airflow, rather than being predominantly east/west, will be away from or towards the pole. The gradient wind speed in the equatorward swing will be super-geostrophic and the speed in the poleward swing will be sub-geostrophic.The poleward swing of each wave is associated with decreasing vorticity and an upper-level high pressure ridge and the equatorward swing is associated with increasing vorticity and an upper trough. Downstream of the ridge, upper-level convergence occurs, with upper-level divergence downstream of the trough. This pattern of the Rossby waves in the upper westerlies results in compensating divergence and convergence at the lower level. This is accompanied by vorticity and the subsequent development of migratory surface depressions — lows or cyclones (cyclogenesis) — and the development of surface highs or anticyclones (anticyclogenesis). The long waves do not usually correspond with lower-level features, as they are stable and slow moving, stationary or even retrograding. However, they tend to steer the more mobile movement of the short waves which, in turn, steer the direction of propagation of the low-level systems and weather. The swings of the Rossby waves carry heat and momentum towards the poles, and cold air away from the poles. The crests of the short waves can break off, leaving pools of cold or warm air, which assist in the process of heat transfer from the tropics. Wave disturbances at the polar fronts perform a similar function at lower levels. An upper-level pool of cold air — an upper low or cut-off low or upper air disturbance — will lead to instability in the underlying air. The term cut-off low is also applied to an enclosed region of low surface pressure that has drifted into the high pressure belt, i.e. cut off from the westerly stream, or is cradled by anticyclones and high pressure ridges. Similarly the term cut-off high is also applied to an enclosed region of high surface pressure cut off from the main high pressure belt (refer to 'blocking pairs') and to an upper-level pool of warm air that is further south than normal — also termed upper high. Air thickness charts show the vertical distance between two isobaric surfaces. Usually, 1000 hPa is the lower, and the upper may be 700 hPa, 500 hPa or 300 hPa. The atmosphere in regions of less thickness — upper lows — will be unstable and colder, whereas regions of greater thickness — upper highs — tend to more stability. On these charts, winds blow almost parallel to the geopotential height lines. 2.4.7 Southern polar fronts The polar fronts, a series of separate fronts globally distributed in the Southern Ocean, are the major frontal zones of the southern hemisphere. They mix between polar air, mid-latitude air and returning tropical air (refer to diagram 4.2). The very cold, dense air moving from the Antarctic high pressure cell and which is deflected by Coriolis into easterlies, contacts the warmer, moister Southern Ocean air moving away from the sub-tropical high pressure belt and which is deflected by Coriolis into westerlies. The returning tropical air is the upper-level air flowing from the Hadley cell, which subsides behind the front and returns to the sub-tropical region at lower levels. Polar fronts are quasi-stationary and generally located about 45°S, but move with the seasons. 2.4.8 Upper-level jet streams Upper air flow in the Hadley cell moves to about 30°S latitude while cooling and eventually subsiding, forming the sub-tropical high pressure belt or ridge. Applying the principle of conservation of momentum: the rotation at the equator is 464 metres/second while at 30°S the surface rotation is 402 m/sec. Thus at 30°S a molecule of upper air transported from the equator has a surplus momentum of 62 m/sec or 122 knots. This surplus momentum forms the westerly sub-tropical jet stream, with an average velocity of 120 knots — the upper stream represented in the following diagram from The Weather Company www.weatherzone.com.au. The polar front jet streams are embedded in the upper-level westerlies, snaking north and south daily and seasonally with the movement of the polar front depressions. They exist because of the strong thermal gradient in that area and they are regions of maximum upper-level air mass transport. As they meander polewards and equatorwards with the general upper air waves, they tend (by their sheer mass) to steer the movement of major low-level air masses. This encourages development of surface pressure features, and intensification of pre-existing features, by the concentrated convergence/divergence within the jet stream. The jet streams are stronger in the winter when the polar front is closest to the equator. The image indicates the position of the sub-tropical and polar front jet streams on 29 August 2009. Jet streams are not continuous but can be as much as 3000 – 5000 km long, 100 – 300 km wide and 7000 – 10 000 feet deep. About 60% of the width tends to be on the equatorial side of the core, which is located near the tropopause. Over Australia, core wind speeds normally range from 60 – 150 knots, but occasionally reach 200 knots. The wind speeds usually decrease by 3 – 6 knots per 1000 feet above and below the core, but the rate may reach 20 knots per 1000 feet. Horizontally, the wind speeds are diminished by about 10 knots per 100 km distance from the core. Jet stream cirrus may form on the equatorial side of the core. STRICT COPYRIGHT JOHN BRANDON AND RECREATIONAL FLYING (.com)
 -
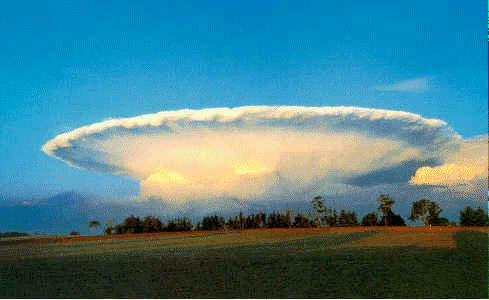 2.3.1 Cloud formation Generally, upward motion of moist air is a prerequisite for cloud formation, downward motion dissipates it. Ascending air expands, cools adiabatically and, if sufficiently moist, some of the water vapour condenses to form cloud droplets. Fog is likely when moist air is cooled not by expansion but by contact with a colder surface. Water vapour generally needs something to condense onto to form liquid. Common airborne condensation nuclei are dust, smoke and salt particles; their diameter is typically 0.02 microns (micrometres) but a relatively small number may have a diameter up to 10 microns. Maritime air contains about one billion nuclei per cubic metre (typically salt), while polluted city air contains many more. The diameter of a cloud droplet is typically 10 to 25 microns and the spacing between them is about 50 times the diameter — perhaps 1 mm — with maybe 100 million droplets per cubic metre of cloud. The mass of liquid in an average density cloud is approximately 0.5 gram per cubic metre. Above the freezing level in the cloud, some of the droplets will freeze if disturbed by contact with suitable freezing nuclei or with an aircraft. Freezing nuclei are mainly natural clay mineral particles, bacteria and volcanic dust, perhaps 0.1 microns in diameter but up to 50 microns. There are rarely more than one million freezing particles per cubic metre; thus there are only enough to act as a freezing catalyst for a small fraction of the cloud droplets. Most freezing occurs at temperatures between –10 °C and –15 °C. The balance of the unfrozen droplets remains in a supercooled liquid state, possibly down to temperatures colder than –20 °C. Eventually, at some temperature warmer than –40 °C, all droplets will freeze by self-nucleation into ice crystals, forming the high-level cirrus clouds. In some cases, fractured or splintered ice crystals will act as freezing nuclei. The ice crystals are usually shaped as columnar hexagons or flat plate hexagons. Refer to sections 3.5.2 and 12.2.2. Condensation of atmospheric moisture occurs when: the volume of air remains constant but temperature is reduced to dewpoint; e.g. contact cooling and mixing of different layers the volume of an air parcel is increased through adiabatic expansion evaporation increases the vapour partial pressure beyond the saturation point a change of both temperature and volume reduces the saturation vapour partial pressure. 2.3.2 Cloud classification Cloud genera Cloud forms are based on ten main genera, conventionally grouped into three altitude bands — high, medium and low — plus a vertically developed group. About 90% of atmospheric moisture exists below 20 000 feet with 50% or more in the band below 6500 feet. The altitudes included in each band are dependent on the thickness of the troposphere at nominal locations — tropical, temperate or polar. These are: Cloud altitude bands Tropical Australia Temperate Australia Antarctic High 20 000–60 000 16 000–43 000 10 000–26 000 Medium 6500–26 000 6500–23 000 6500 –13 000 Low 0–6500 0–6500 0–6500 High clouds A two-letter code is used to identify cloud genera in meteorological reports, observations and aviation area forecasts. Cirrus [CI] (Latin for 'curl'): white patches, banners, threads or delicate filaments of ice crystals. They often appear in patches of individual 'generating heads' with streaks of crystals falling from them thus forming comma-shaped or hooked 'mares' tails'. Cirrus clouds may merge into CS or CB. They are formed by widespread ascent, but sometimes by upper level turbulence in a smaller area. Cirrostratus [CS]: a thin, transparent, amorphous, whitish veil of smooth or sometimes finely fibrous appearance, appearing over much of the sky at very high altitudes. They create the appearance of halos about the sun or moon. Cirrostratus may merge into CC or possibly AS, and are formed by widespread ascent and may thicken when preceding a cold front. Cirrocumulus [CC]: thin, white patches, sheets or rows with small, regularly arranged elements or cloudlets in the form of grains or ripples, which may be merged or separate; sometimes with an appearance like fish scales — a 'mackerel sky'. The apparent width of elements is less than one degree. Cirrocumulus elements may merge together to form CS or separate into CI mares' tails. CC are produced by turbulence aloft — often associated with a front or upper-level disturbance. Medium-level clouds Altostratus [AS]: grey/bluish sheet, with coverage of possibly 8 oktas, of uniform appearance. They are often striated or fibrous, having parts thin enough to reveal a vague sun without any halo but possibly a corona. Altostratus often merges into NS. They are caused by widespread ascent and are usually associated with a front or upper-level disturbance. Altocumulus [AC]: white/grey patches, bands or sheets of regularly arranged globular elements (sometimes called mackerel sky) — waves or rows with light shading, closely packed or merged. The element width is 2 to 5 degrees. (A finger width at arm's length is approximately 2 degrees; the spread between the tips of the little finger and thumb when a hand is splayed is about 22 degrees.) Altocumulus often shows coloured patches (irisation) around elements when illuminated by the sun or moon; a corona may be visible. They are usually caused by turbulence and are not associated with a change in the weather. Nimbostratus [NS] (from the Latin 'nimbus' = cloud, aureole): thick, dense, dark grey layer, often with a ragged or diffused base, with continuous precipitation. Coverage is often 8 oktas. Scud (pannus) may form beneath it. Invariably they occur at medium level, but usually extend to high level and merge with AS; they may also extend to low levels and envelop hills. Nimbostratus are produced by widespread ascent. Low-level clouds Stratocumulus [SC]: grey/whitish patches, sheets or layers of separate or partly merged globular masses or rolls with dark shading and generally irregular appearance. If regularly arranged, the separate elements have apparent width exceeding 5 degrees. Coverage is often 8 oktas and may be penetrated by large CU or CB. Stratocumulus are probably the most frequently seen cloud in south-eastern Australia and are most frequent in winter anticyclones — 'anticyclonic gloom' — when moist air is trapped under an inversion. They are particularly noticeable around Melbourne. Stratus [ST] (Latin = spread, laid down): grey, uniform layer with fairly even base from which drizzle may descend. The sun outline may be visible. Stratus envelops low hills. They sometimes appear in ragged patches, which are produced by frictional turbulence or possibly orographic ascent. Cumulus [CU] (Latin = heap): white, heaped tops with generally grey, horizontal bases. Form is usually sharply outlined but may be ragged if evaporating. Vertical development varies greatly with atmospheric buoyancy, and bases can be at low or medium levels. Cumulus are formed by convection or possibly orographic ascent. Vertically developed clouds Cumulonimbus [CB]: heavy, dense cloud with massive vertical development, bases at low or medium levels, with tops possibly reaching (even overshooting) the tropopause. They may have a 'boiling' appearance during their vertical development stage. The base is usually very dark with lighter inflow areas. They are associated with heavy showers or virga — precipitation that evaporates before reaching the surface. Frequently low, ragged, turbulence cloud is mixed beneath it. Cumulonimbus are produced by vigorous convection. Refer to section 3.6. For more information on the types and dangers of thunderstorms read sections 9.4 through 9.7. Towering cumulus [TCU]: CU with cauliflower appearance, often of great vertical extent. Properly known as cumulus congestus [CU CON]. Cloud structure and composition Cloud type Height of base Vertical extent Composition Associated precipitation CI 20 000 + usually thin* ice crystals fall streaks CS 20 000 + usually thin ice crystals nil CC 20 000 + usually thin crystals/droplets nil AS 6000 – 20 000+ up to 15 000 usually crystals, occasionally mixed rain/snow AC 6000 – 20 000 usually thin usually droplets to –10 °C, some crystals to –30 °C occasionally mixed rain, drizzle NS 0 – 8000+ merges into AS water droplets steady rain, snow, ice pellets SC 1500 – 4000 500 – 3000 mainly droplets down to –15 °C rain, drizzle, virga ST 0 – 2000 200 – 1000 usually water droplets drizzle CU, TCU 1500 – 15 000 up to 15 000 water droplets rain showers CB 1500 – 5000 15 000 – 35 000+ mainly droplets to –15 °C, mixed at lower temperatures rain/snow showers/virga, hail, ice pellets *With fall streaks, the vertical extent of CI may exceed 5000 feet Photographs and more information on cloud classes and identification techniques can be found at the Australian Severe Weather website. Cloud species Each of the cloud genera are subdivided into species by the addition of a common species descriptor (with a three-letter code), according to cloud shape and structure. Fibratus [FIB]: CI and CS in the form of long, irregularly curved or nearly straight parallel filaments, but without tufts or hooks. CI FIB, CS FIB Spissatus [SPI]: dense or thickened CI plumes or CS, often originating from, or the remnants of, a CB anvil. Generally has a stormy appearance, looking greyish when viewed towards the sun. CI SPI, CS SPI Uncinus [UNC] (Latin = hook): CI with filaments that are hooked or comma-shaped. 'Mares tail cirrus'. Ice crystals are forming at the high point of the fall streak where a small tuft of cloud may appear — the generating head. The crystals forming the tail are falling through atmospheric layers of varying wind velocity and persist for quite a while before evaporating. CI UNC Nebulosus [NEB]: CS and AS as an indistinct veil lacking any detail. Also applied to low amorphous ST — lifted fog. CS NEB, AS NEB, ST NEB Stratiformus [STR]: AC and SC, occasionally CC, spread out into an extensive sheet or layer. CC STR, AC STR, SC STR Lenticularis [LEN]: (from the Latin 'lentil shaped') AC of orographic standing wave origin, sometimes CC or SC; occurs as a biconvex shape with a sharp margin, and often elongated if produced by a long ridge. They sometimes display iridescence. May form in long bands parallel to the Great Dividing Range and extend 50 to 100 nm downstream, towards the east; see mountain waves. When there are alternating layers of drier and moister air a tall, well-developed lenticularis formation may resemble an inverted stack of dinner plates, occasionally seen in the mountain areas of south-eastern Australia. CC LEN, AC LEN, SC LEN Castellanus [CAS]: having a turreted or crenellated appearance and connected to a common cloud base line. They are generally AS (but forming AC), or sometimes SC, CI or CC, signifying increasing instability. AC CAS may precede the development of CB. Floccus [FLO] (Latin = tuft of wool): CI, CC or particularly AC occurring in chaotic form, like a flock of sheep, each unit having a ragged base and a small cumuliform tuft above; 'thundery skies'. Often accompanied by virga. If developing CU reach this humid and unstable layer then energetic CB may develop. Fractus [FRA]: ST or CU shreds with broken, ragged or wispy appearance, associated with formation or dispersion of low cloud. CU FRA often appears early in the morning, rising only slightly above the condensation level; they are also found in precipitation under CB. ST FRA is much darker than CU FRA when found under CB. ST FRA normally forms below NS or AS, and derives moisture from evaporating raindrops or surface water. Uplift from near-surface turbulence may produce ST FRA, particularly in areas of rising ground or low hills. If forming without overlying cloud, ST FRA forewarns of worsening low-level visibility and ST formation. Pannus or scud is a mix of CU FRA and ST FRA. Humilis [HUM] (Latin = lowly): CU with small development and usually flattened at an inversion that is not far above the condensation level — 'fair weather CU'. Lifetime is 5 to 45 minutes. CU HUM Mediocris [MED] (Latin = of middle degree): CU of intermediate vertical growth, occurring at no more than 3000 feet. They have tops showing small protuberances that are not actively growing. CU MED Congestus [CON] (Latin = piled up): CU with cauliflower appearance, often of great vertical extent, perhaps 10 000 feet; generally known as towering CU [TCU]. Freezing does not occur. CU CON may produce heavy showers or microbursts, the latter particularly so in northern Australia. Calvus [CAL] (Latin = bald): developing CB prior to anvil stage, but at least some of its upper part is losing its CU outline due to freezing. CB CAL Capillatus [CAP] (Latin = hair): CB with distinct icy, upper fibrous or striated cirriform appearance. Frequently anvil-shaped, or untidy plumes, or disordered cirrus mass. CB CAP Cloud varieties Each of the cloud genera and species can be further classified into varieties by use of a common descriptor for element arrangement, transparency, etc. Intortus [IN]: irregularly curved or tangled CI. Vertebratus [VE]: CI looking like fish bone, ribs or vertebrae. Lacunosus [LA]: thin CC or AC with regularly spaced, net-like holes or a honeycomb appearance. Undulatus [UN]: parallel undulations in patches, sheets or layers of CC, CS, AC, AS, SC or ST caused by waves in the airstream. Radiatus [RA]: broad, parallel bands of CI, AC, AS, CU or SC appearing to converge towards a radiation point on the horizon, or both horizons. Duplicatus [DU]: more than one layer of CI, CS, AC, AS or SC at slightly different levels. The winds at each layer are usually blowing in slightly different directions. Translucidus [TR]: AC, AS, SC or ST in large sheets thin enough to show position of the sun or moon. Perlucidus [PE]: AC or SC in broad layers or patches with small lanes that allow the sky to be seen. Opacus [OP]: AS, AC, SC or ST that completely masks the sun or moon. Accessory clouds There are three cloud types that only exist in association with one of the main cloud genera: Pileus (Latin = cap, hood, like mushroom cap): a short-lived, smooth lenticular cloud appearing in a humid stable layer above a CB or TCU when the rising thermal deflects the moving air in the layer up and over into the condensation level. Further CB or TCU development will push through the cap cloud, which may hang on as a temporary collar. There is a good photograph of such an event in the Sydney Storm Chasers website. In strong shear conditions, the cap cloud may form downwind. Velum (Latin = veil): a thin, wide and persistent sheet of cloud accompanying a CB or TCU and forming in a humid, stable layer. Velum is dark in contrast to the convective cloud that generally rises through it. Pannus (Latin = piece of cloth): a mix of CU FRA and ST FRA, or just a lump of ST. Scud rapidly forms or reforms generally at lower levels under precipitating CU, AS, CB or NS bases in turbulent lifting conditions, particularly when air rises rapidly at the edge of cool moist outflow, or a downburst or in upflow caused by the topography — and exacerbated by evaporation of moisture from forest canopies. Scud changes size and shape constantly, and may be drawn into the cloud base. Flight in a locality where pannus is forming — scud running — is a very dangerous activity for aviators. Cloud features Some notable cloud features are: Incus (Latin = anvil): the anvil of a large CB, particularly a multicell or supercell storm, which has spread out, usually when upper-level winds are light. A severe storm attains maximum vertical development when the updraught reaches a stable layer which it is unable to break through — often the tropopause — and the cloud top spreads horizontally in all directions to form an overhanging anvil. The photograph and text below appeared in the "NSW Lightning Bolt" of August 1997 — produced by the Severe Weather Section of the Bureau of Meteorology, NSW. That anvil had a spread of about 30 km. The rollover around the underside of the anvil indicates rapid expansion. "Rose's magnificent photo (below) of a storm cloud near Millthorpe in NSW is familiar to many Bureau staff from the 1996 Weather Calendar, a 1995 Bureau Christmas card, and the new thunderstorm poster. The story of how the photo came to be taken may attract the writers at the Disney Studios. Rose relates the tale: '... my son Ian phoned to tell me about the clouds and to ask if I had a spare film, as his camera was empty. I tied a film to our kelpie's collar and sent him down the hill to Ian. Meanwhile, Ian's daughter Melanie was cycling up to get the film ... by the time they both met Ian the cloud had started to break up. Fortunately by then I had climbed two fences and taken the two shots ...' " Arcus (Latin = arch, bow or curve): a shelf-like cloud indicating the inflow region at the leading edge of a thunderstorm or a squall line. If conditions are very humid the shelf cloud will be a low, thick, curved and well-formed cloud bank. If there is a sharp, severe gust front there may be a vortex indicated by twisting scud under, and leading up to, the shelf. A roll cloud, like a horizontal tube, may develop if the leading edge of the shelf speeds up and detaches. SC, AC roll clouds are also associated with mountain waves and solitary waves. Granitus: a localised cloud (always forming below the lowest safe altitude [LSALT] marked on aeronautical charts) enclosing and obscuring a large chunk of land, usually in the form of a hill or peak. Granitus is sometimes known as 'stuffed CU', which refers to both the solid content and the consequences of entering such a cloud. Wall cloud: a localised, possibly rotating, lowering from a CB cloud base. Situated at the main updraught with a diameter ranging from 0.5 km to 5 km. Refer to section 9.5. The Sydney Storm Chasers website has many images of thunderstorm features. There are good photos of wall clouds, arcus, pannus and mammatus. Mammatus: hard, downward protuberances, pouches or bulges from the underside of a CB anvil (frequently) or CI, CC, AS, AC or SC, indicating descending pockets of small droplets or ice crystals. The sinking, saturated air is cooler than the air around it. As it sinks it warms, but warming is retarded because some of the heat is used in evaporating cloud droplets in the saturated air. If more energy is required for evaporation than is generated by adiabatic warming, then the air and the cloud pouches will continue to sink and will elongate the protuberances. The mamma associated with CI and CC are very shallow, forming undulations in the cloud trails. Mamma associated with CB are an indication of a dissipating storm rather than severe turbulence. Fall streaks: virga-like showers of ice crystals or snowflakes from CI generating heads, which sink at rates up to 0.5 m/sec but slowing as they sublimate. As they sink through several thousand feet they become deflected by falling into winds of lower velocity, or slow through sublimation, and thus appear to trail back from the parent head as hooks, mares' tails, etc. Dense streaks combined with a strong drop in wind speed produce jet-stream banners — CI features that stream with the wind. AS and most stable cloud features lie across the wind. Billow clouds: AC and AS found in a series of regular bands with clear areas between of similar width, occurring most frequently at 15 000 to 25 000 feet. At other times the upper surface (usually but could be the lower surface) of the cloud may have regular wave-like troughs and crests – undulatus. When a higher-level inversion occurs, the upper and lower air layers are generally stable. If there is a significant difference in wind velocity between the layers then there is vertical wind shear at the interface, and a phenomenon known as 'Kelvin-Helmholtz shearing instability' causes the formation of long but short-lived waves across the interface — in much the same way as ocean waves — which grow in amplitude until they curl up and break. The waves produce an extensive but shallow area of clear air turbulence. If sufficient moisture exists, the waves become visible as Kelvin-Helmholtz billows. Billows always move with the wind so that in wave clouds they appear to move from the front to the rear of the formation, evaporating in the troughs and re-condensing in the crests. Kelvin-Helmholtz instability produces the ripples seen when a light wind blows across a pond of water. Pyrocumulus: CU initiated by bushfire thermal activity. Ray Kennedy's photograph below shows a CU CON building above the brown smoke during the Gippsland bushfires on New Year's Day 1998. Stratospheric clouds Nacreous (mother-of-pearl) clouds are rare, high-latitude, stratospheric clouds resembling CC LEN or AC LEN. Small patches are occasionally formed in winter, usually in stationary standing waves, and often in the lee of mountain ranges, which provide abrupt uplift. They usually occur in the ozone layer at about 25 km with temperatures down to –80°C or –90°C. Nacreous clouds are probably composed of spherical ice crystals about one to two microns diameter. Brilliant iridescence is shown at angular distances up to 40 degrees from the sun, and green and pink colours predominate. These clouds are brightest at sunset but are rarely seen in daylight. Noctilucent clouds [NLC] are rare, tenuous, mesospheric cloud formations only seen from higher-latitude locations, normally around 40° to 60° south, against a twilit (nautical and astronomical) sky in summer. Sufficient contrast for observation occurs when the sun is between 6° and 16° below the horizon with maximum contrast at 10° when solar illumination and light scatter is at the maximum. They are seen close to the sunward horizon and extend maybe 20° above, along the twilight arch, although the clouds can be seen at a much higher elevation. The clouds appear to be near the mesopause at about 80 km and are moving with the zonal easterlies. They resemble high CI with pronounced band or wave structures, commonly herring-bone, bluish-white to pure white with yellow beneath. They are probably composed of cosmic dust with thin ice deposition, saturation of traces of water vapour being reached through orographic waves resonated from the earth's surface, or possibly oxidation of atmospheric methane. The Australian Severe Weather website has many excellent images grouped into cloud classifications, cloud features and atmospheric phenomena. Also the Cloud Appreciation Society website is well worth a visit. ICAO / WMO Cloud continuity scale SKC — sky clear, no cloud. FEW — few clouds, one to two oktas cover. SCT — scattered, 3 – 4 oktas cover. Clear intervals between clouds predominate. BKN — broken, 5 – 7 oktas. Cloud masses predominate. OVC — overcast, 8 oktas. Continuous, no clear intervals. 2.3.3 Lifting sources There are four main processes that provide the lifting source for moist air to form cloud: convection frictional turbulence orographic ascent convergence or widespread ascent. Convection When air flows over a surface heated by solar radiation, the surface contact layer is heated by conduction, and some of the heat is transported upward by molecular motion and small turbulent eddies. If the incoming energy is sufficient, the temperature in the lower layer increases and thermals rise from the heated contact layer — initially as bubbles of buoyant air, and then develop as columns with 100 – 300 metre diameters. The strength of the thermal depends on the heating: Thermal vertical velocity Thermal strength Knots Feet/min Metres/sec Weak 1 – 2 100 – 200 0.5 – 1 Moderate 2 – 6 200 – 600 1 – 3 Strong 6+ 600+ 3+ Circling within a thermal (thermalling) is a prime source of uplift for soaring paragliders, hang gliders and sailplanes, and particularly so in the summer. In hot, dry areas of Australia, thermals exceeding 1000 feet/min are common. The rising thermal cools at about the DALR of 3 °C/1000 feet and if it reaches dewpoint — the convection or lifting condensation level — cumulus will form. They are initially maintained by a series of random rising eddies, but if developed enough can draw in surrounding moist air and maintain itself, in a steady organised upward flow, from the release of the latent heat of condensation. If the cloud has enough energy to pass the freezing level it may develop into a rain and wind storm, and possibly a CB. Refer to section 3.6. In most instances the air providing the water vapour for convective cloud growth comes from within the friction layer. When thermal turbulence of sufficient intensity to penetrate above the friction layer is present, and the condensation level lies above the friction layer, then isolated convective cloud — fair weather cumulus CU HUM — is formed with clear-cut bases and tops to the limit of penetration. A subsidence inversion above the condensation level may limit the vertical extent, with the cloud spreading out in broken SC. Night cooling also has the effect of spreading the cloud into broken SC. Air warmed by advection over a warm surface, particularly the sea, in a summer anticyclone provides ideal conditions for development of fair weather cumulus. Frictional turbulence An airstream flowing over ground or water produces a turbulent layer, up to 500 feet deep in light winds or 3000 feet plus in strong winds. The vertical eddies within this friction layer or boundary layer transport air from the upper level to the surface, adiabatically warmed to a temperature above that of the surface air. Similarly surface air is transported to the upper level, cooling adiabatically to temperatures below that of the upper level. Thus, as the turbulent mixing continues, the lower level is warmed and the upper level is cooled until the temperature lapse rate through the layer equals the DALR and the layer is in neutral stability — providing the air remains unsaturated. An inversion is formed at the top of the friction layer. A pre-existing inversion, e.g. a subsidence inversion, will strengthen the process. Thermal turbulence will also be present. The deep, turbulent mixing also has the effect of evening-out the moisture content throughout the layer and if the humidity mixing ratio is high enough a mixing condensation level will be reached within the friction layer. If the lapse rate of the layer above the friction layer is stable, then layer cloud will form with its base at the mixing condensation level and its top at the inversion. Thus the thickness of the cloud layer will vary from very thin to possibly 3000 feet. If the upper air layer is unstable then cloud development would not be halted at the inversion and convective cloud would probably develop. If the wind is light the layer cloud would tend to ST, otherwise SC with undulations in the lower surface continually forming, with breaks where cloud is being evaporated in the down currents. ST FRA may also form with local variations in humidity, temperature and turbulence. Cloud produced by frictional turbulence is not usually associated with precipitation except perhaps for drizzle from dense layers. Orographic ascent Orography is the branch of physical geography concerned with mountains. An airstream encountering a topographic barrier (i.e. hill, ridge, valley spur, mountain range) is forced to rise, in a broad cross-section from at or near the surface to the upper levels, and cools adiabatically. If the lift and the moisture content are adequate, condensation occurs at the lifting condensation level and cloud is formed on or above the barrier. Stratus is formed if the air is stable, whilst cumulus forms if the air is slightly unstable. If there is instability in depth, coupled with high moisture, CB may develop (refer to section 3.6). Solar heating of ridges may cause the adjacent air to be warmer than air at the same level over the valleys; thus the ridge acts as a higher-level heat source, increasing buoyancy and accentuating the mechanical lifting. The orographic lifting of an airstream provides gliders with the opportunity for ridge or hill soaring. Sea breezes crossing relatively small topographic barriers at the coastline (e.g. cliffs) may provide quite smooth uplift. Orographic cloud — cap cloud — in stable conditions tends to form continuously on the windward side of mountain ridges, but clears on the lee side. Lenticular cloud may also form a high cap above a hill when there is a layer of near saturated air aloft; orographic lifting causes condensation, and descent causes evaporation. A mountain wave may form — particularly in a sandwiched, stable layer — resulting in the formation of a series of lenticular clouds. Convergence and widespread ascent The air in the centre of a low pressure centre, trough or heat trough is lifted by convergence, as is the air in the inter-tropic convergence zone. The air in the broad area ahead of a cold front is lifted by the frontal action. Generally the air rises very slowly, possibly one to five feet/minute, and cools. If moist enough, the air condenses at the lifting condensation level producing extensive layers of stratus-type cloud: NS, AS, CS and CI. However active or fast-moving fronts may nose the air up much more rapidly, leading to CB development. 2.3.4 Fog Fog [FG] is defined as an obscurity in the surface layers of the atmosphere that is caused by a suspension of water droplets, with or without smoke particles, and which is defined by international agreement as being associated with visibility less than 1000 metres. If the visibility is between 1000 and 5000 metres then the obscurity is mist — meteorological code BR, from the French brouillard = mist. Radiation fogs are the prevalent fogs in Australia, with occurrence peaking in winter. They are caused by lowering of the ground temperature through re-radiation into space of absorbed solar radiation. Radiation fogs mainly occur in moist air on cloudless nights within a high-pressure system, particularly after rainfall. The moist air closest to the colder surface will quickly cool to dewpoint with condensation occurring. As air is a poor conductor, a light wind of 2–6 knots will facilitate the mixing of the cold air throughout the surface layer, creating fog. The fog itself becomes the radiating surface in turn, encouraging further cooling and deepening of the fog. An increase in atmospheric pollution products supplies extra condensation nuclei to enhance the formation of fog; i.e. smog. A low-level inversion forms and the contained fog may vary from scattered pools in surface depressions to a general layer 1000 feet in depth. Calm conditions will result in a very shallow fog layer, or just dew or frost. The fog droplets sink at about 1 cm/sec. Surface winds greater than 10 knots may prevent formation of the inversion; the cooled air is mixed with the warmer air above, and so does not cool to dewpoint. If the forecast wind at 3000 feet is 25 knots or more, the low-level inversion may not form and fog is unlikely (refer to 'spread' in section 1.5). In winter, radiation fog may start to form in the evening and persist to midday — or later if the sun is cut off by higher-level cloud and/or the wind does not pick up sufficiently to break up the low-level inversion. Advection fog may occur when warm, moist air is carried over a surface that is cooler than the dewpoint of the air. Cooling and some turbulence in the lower layer lowers temperature to dewpoint and fog forms. Sea fogs drifting into New South Wales coastal areas are advection fogs that are formed when the sea surface temperature is lower than the dewpoint, but with a steady breeze to promote air mixing. Dewpoint can be reached by both temperature reduction and by increased water vapour content through evaporation. Advection fogs will form in valleys open to the sea when temperature falls in the evening, and when combined with a sea breeze of 5 – 15 knots to force the air upslope. Thick advection fogs may be persistent in winter, particularly under a mid-level cloud layer. Shallow evaporation fogs or steaming fogs result from the immediate condensation of water vapour that has just evaporated from the surface into near-saturated air. Steaming from a sun-warmed road surface after a rain shower demonstrates the process. Sea smoke or frost smoke is an evaporation fog occurring in frigid Antarctic air moving over relatively warm waters, thereby prompting evaporation into the cold air which, in turn, quickly produces saturation. Freezing fog is a fog composed of supercooled water droplets that freeze on contact with solid objects; e.g. parked aircraft. When near-saturated air is very cold, below –24 °C at sea level to –45 °C at 50 000 feet, the addition of only a little moisture will produce saturation. Normally, little evaporation takes place in very cold conditions but release of water vapour from engine exhausts, for instance, can quickly saturate calm air (even though the engine exhaust heat tends to lower the relative humidity) and will produce ice fog at the surface or condensation trails [contrails] at altitude. If the temperature is below –40 °C, ice crystals form directly on saturation. Contrails persist if relative humidity is high but evaporate quickly if low. Distrails occur when the engine exhaust heat of an aircraft flying through a thin cloud layer dissipates a clear trail. Frontal fog or rain-induced fog occurs when warm rain evaporates at surface level in light wind conditions and then condenses to form fog. 2.3.5 Precipitation Rain [RA] and drizzle [DZ] Cloud droplets tend to fall but their terminal velocity is so low, about 0.01 metres/sec, that they are kept aloft by the vertical currents associated with the cloud construction process; but droplets will evaporate when coming into contact with the drier air outside the cloud. Some of the droplets are larger than others and consequently their falling speed is greater. Larger droplets catch up with smaller ones and merge or coalesce with them, eventually forming raindrops. Raindrops grow with the coalescence process and reach maximum diameters — in tropical conditions — of 4–7 mm before air resistance disintegrates them into smaller raindrops; this starts a self-perpetuating process. It takes about one million cloud droplets to form one raindrop. The terminal velocity of a 4 mm raindrop is about 9 metres/sec. Only clouds with extensive depth, 3000 feet plus, will produce rain (rather than drizzle). But very small, high clouds — generating heads — may produce trails of snow crystals, which evaporate at lower levels — fall streaks or virga. Drizzle forms by coalescence in stratiform clouds with depths possibly less than 1000 feet and with only weak vertical motion — otherwise the small (0.2 – 0.5 mm) drops would be unable to fall. It also requires only a short distance or a high relative humidity between the cloud base and the surface — otherwise the drops will evaporate before reaching the surface. Terminal velocity approximates 1–2 metres/sec. Light drizzle [–DZ]: visibility greater than 1000 metres Moderate drizzle [DZ]: visibility 500–1000 metres Heavy drizzle [+DZ]: visibility less than 500 metres Light rain showers [–SHRA]: precipitation rate under 2 mm/hour Moderate rain showers [SHRA]: 2–10 mm/hour Heavy rain showers[+SHRA]: more than 10 mm/hour Light rain [–RA]: under 0.5 mm/hour, individual drops easily seen Moderate rain [RA]: 0.5–4 mm/hour, drops not easily seen Heavy rain [+RA]: more than 4 mm/hour, rain falls in sheets Weather radar reports precipitation according to the reflectivity level: 1 – light precipitation 2 – light to moderate rain 3 – moderate to heavy rain 4 – heavy rain 5 – very heavy rain, hail possible 6 – very heavy rain and hail, large hail possible Scotch mist is a mixture of thick cloud and heavy drizzle on rising ground, formed in conditions of weak uplift of almost saturated stable air. Snow [SN] At cloud temperatures colder than –10 °C where both ice and supercooled liquid water exist, the saturation vapour pressure over water is greater than that over ice. Air that is just saturated with respect to the supercooled water droplets will be supersaturated with respect to the ice crystals, resulting in vapour being deposited onto the crystal (refer to section 1.5). The reduction in the amount of water vapour means that the air is no longer saturated with respect to the water droplets. To achieve saturation equilibrium again, the water droplets begin to evaporate. Thus ice crystals grow by sublimation and water droplets lessen, i.e. in mixed cloud the ice crystals grow more rapidly than the water droplets. Snow is frozen precipitation resulting from ice crystal growth, and falls in any form between small crystals and large flakes. This is known as the Bergeron-Findeison theory and probably accounts for most precipitation outside the tropics. Snow may fall to the surface or, more often, melt below the freezing level and fall as rain. Snowflakes are built by snow crystals colliding and sticking together in clusters of several hundred — known as aggregation. Most aggregation occurs at temperatures just below freezing, as the snow crystals tend to remain separate at colder temperatures. Hail and other ice forms The growing snow crystals acquire a fall velocity relative to the supercooled droplets. Growth also continues by collision and coalescence with supercooled droplets forming ice pellets [PE]. The process is termed accretion, or opaque riming if the freezing is instantaneous incorporating trapped air, or glazing if the supercooled water freezes more slowly as a clear layer. A similar process occurs with airframe icing. The ice pellets in turn grow by coalescing with other pellets and further accretion — these are termed hail [GR] when the diameter exceeds 5 mm. The size reached by hailstones before falling out of the cloud depends on the velocity and frequency of updraughts within the cloud. Hail is of course a hazard to aviation, particularly when it is unexpected; for example hail falling from a CB anvil can appear to fall from a clear sky. Snow grains [SG] are very small, flattened, opaque ice grains, less than 1 mm and equivalent to drizzle. Snowflakes that, due to accretion, become opaque, rounded and brittle pellets, 2 – 5 mm diameter, are called snow pellets or graupel [GS]. Sleet is transparent ice pellets less than 5 mm diameter that bounce on impact with the ground. Sleet starts as snow, partially melting into rain on descent through a warm layer, then refreezing in a cold near-surface layer. The term is sometimes applied to a snow/rain mixture or just wet snow. Diamond dust [IC] is minute airborne ice crystals that only occur under very cold (Antarctic) conditions. When raindrops form in cloud-top temperatures warmer than –10 °C the rain falls as supercooled drops. Such freezing rain or drizzle striking a frozen surface, or an aircraft flying in an outside air temperature [OAT] at or below zero, will rapidly freeze into glaze ice. Freezing rain is responsible for the ice storms of North America and northern Europe, but the formative conditions differ from the preceding. The seeder – feeder mechanism Any large-scale air flow over mountain areas produces, by orographic effect, ice crystals in cold cloud tops. By themselves, the falling crystals would cause only light drizzle at the ground. However, as the crystals fall through the low-level mountain top clouds they act as seed particles for raindrops that are formed by coalescing cloud droplets with the falling crystals, producing substantial orographic rainfall in mountain areas. Aerial cloud seeding involves introducing freezing nuclei (silver-oxide crystals with a similar structure to ice crystals) into parts of the cloud where few naturally exist, in order to initiate the Bergeron-Findeison process. 2.3.6 Thunderstorm development Like CU, surface heating may provide the initial trigger to create isolated CB within an air mass but the initial lift is more likely to be provided by orographic ascent or convergence effects. In the formative stages of a CB, the cloud may have an updraught pulse of 1000–2000 feet/min. The rising parcel of air reaches altitudes where it is much warmer than the surrounding air, by as much as 10 °C, and buoyancy forces accelerate the parcel aloft possibly reaching speeds of 3000–7000 feet/min. Precipitation particles grow with the cloud growth. The upper levels of the cloud gain additional energy from the latent heat released from the freezing of droplets, and the growth of snow crystals and hailstones. When the growth of the particles is such that they can no longer be suspended in the updraught, then precipitation — and its associated drag downdraught — occurs. If the updraught path is tilted by wind shear or veer, rather than vertical, then the precipitation and its downdraught will fall away from the updraught, rather than back down through it (consequently weakening or stopping the updraught) and a co-existing updraught/downdraught may become established. An organised cell system controlling its environment and lasting several hours may evolve. Middle-level dry air from outside the cloud is entrained into the downdraught of an organised cell. The downdraught is further cooled by the dry inflow air evaporating some of its water and ice crystals, and tends to accelerate downwards in vertical gusts. At the same time, the downdraught maintains the higher horizontal momentum it gained at upper levels from the higher forward speed of the storm at that height. When the cold, plunging air nears the surface, the downburst spreads out in all directions as a cold gust front or squall. This is strongest at the leading edge of the storm and weakest towards the trailing edge. Each organised cell system contains an updraught / downdraught core. Beneath this is the outflow region containing the rain shield. The core is bounded by the downdraught gust front, a flanking line with a dark, flat base. Underneath this is the inflow region of warm, moist air. The CU and TCU generated by the inflow within the flanking line are the genesis of new cells. Within the core, the condensation of moisture from the inflow region produces rain, hail and snow and the associated downdraught to the outflow region. When the cool air outflow exceeds and finally smothers(or undercuts and chokes off) the inflow, then the storm dissipates. High moisture content in the low-level air with dry, mid-level air and atmospheric instability are required to maintain CB development. The amount of precipitation from a large storm is typically 200 000 tonnes but severe storms have produced 2 million tonnes. Anvils may take several forms: Cumuliform: forms when a very strong updraught spreads rapidly and without restriction. Back-sheared: the cloud top spreads upwind, against the high-level flow, this indicates a very strong updraught. Mushroom: a rollover or lip around the underside of an overhanging anvil, which indicates rapid expansion. Overshooting top: a dome-like protusion through the top of an anvil, which indicates a very strong updraught pulse. The overshooting top in large tropical storms has been known to develop into a 'chimney' form, towering maybe 10 000 feet into the stratosphere, with an extensive plume cloud extending downwind from its top. Such clouds transfer moisture to the stratosphere. The Australian Bureau of Meteorology Web site has a storm spotters' guide. Parts 1 and 2 briefly describe the structure and types of thunderstorms likely to be encountered in Australia. For further information on clouds, fog and precipitation consult the University of Manchester's Intute, an online catalogue of internet resources in Earth sciences. 2.3.7 Flight in cloud or without external visual references The human vestibular system When walking, a person's prime sense of orientation is provided by visual references. When vision is severely degraded, the vestibular system in the inner ears, which senses motion and gravity (thus roll, pitch and yaw), generally allows us to keep our balance when walking without using visual references. However, the vestibular system is not designed for high speed or angular motion, and cannot be used as an in-flight back-up system; i.e. you cannot close your eyes and continue to fly straight and level. Motion of the fluid within the ears' semicircular canals is affected by inertia and will feed quite erroneous prompts to the brain, resulting in various types and levels of vertigo. For example, without the external visual references of clear sky, terrain or a horizon, forward deceleration tends to give a pitching-down sensation whilst forward acceleration gives a pitching-up sensation. Once settled into a constant rate turn, the sensation is of not turning at all; but when the turn is halted, the sensation is then of turning in the opposite direction. In addition, the vestibular system will not detect slow rates of bank, so that if the aircraft is banking at the rate of one or two degrees per second the vestibular system will not send any prompts to the brain — it will consider the aircraft is still flying straight and level, while any associated speed changes may provide contrary sensations. For example, if the aircraft is slowly banking and accelerating in a descending turn, the sensation may well be one of pitching-up. Spatial disorientation Aircraft accidents caused by spatial disorientation are usually fatal and occur when VFR flight is continued in adverse visibility conditions — cloud, fog, smoke, haze, showers, oncoming darkness and combinations thereof. Pilots who have not been trained to fly solely by visual reference to the flight instruments in a 'blind flying' panel will soon find themselves experiencing spatial disorientation should they, inadvertently or deliberately, enter cloud where the external visual references — by which they normally orient themselves in visual meteorological conditions — are lost. The same applies to any atmospheric condition or in adverse weather where the visual references (horizon [principally], terrain and clear sky) are lost or just significantly reduced — smoke from bushfires or extensive burning of sugar cane, for example. Even a pilot who is well experienced in flying in instrument meteorological conditions may occasionally experience a phenomenon called 'the leans'. This usually occurs when the aircraft has been inadvertently allowed to slowly bank a few degrees and the pilot then makes a quick correction to level the wings. The vestibular system doesn't register the initial bank but does register the wing levelling as an opposite direction bank (away from a wings-level attitude) — and the pilot's brain produces a leaning sensation while also perceiving from the instrument readings that the aircraft is flying straight and level. The reaction — which can persist for quite a while — may be for the pilot to lean sideways in her/his seat so that everything feels right! Read the section titled 'Pressing on in deteriorating conditions' in the Flight Planning and Navigation Guide. For more information on the vestibular functions and effects, google the terms 'vestibular spatial disorientation' in a web search. STRICT COPYRIGHT JOHN BRANDON AND RECREATIONAL FLYING (.com)
 -
 2.2.1 Insolation and atmospheric temperature Insolation The Earth's surface and the atmosphere are warmed mainly by insolation — incoming solar electromagnetic radiation. The amount of insolation energy reaching the outer atmosphere is about 1.36 kilowatts per m². About 10% of the radiation is in the near end of the ultraviolet range (0.1 to 0.4 microns [micrometre]), 40% in the visible light range ( 0.4 to 0.7microns), 49% in the short-wave infrared range (0.7 to 3.0 microns ) and 1% is higher energy and X-ray radiation; see 'The electromagnetic wave spectrum' below. The X-rays are blocked at the outer atmosphere, and most of the atmospheric absorption of insolation takes place in the upper stratosphere and the thermosphere. There is little direct insolation warming in the troposphere, which is mostly warmed by contact with the surface and subsequent convective and mechanical mixing; see 'Tropospheric transport of surface heating and cooling' below. On a sunny day 75% of insolation may reach the Earth's surface; on an overcast day only 15%. On average, 51% of insolation is absorbed by the surface as thermal energy — 29% as direct radiation and 22% as diffused radiation; i.e. scattered by atmospheric dust, water vapour and air molecules; see 'Light scatter'. About 4% of the radiation reaching the surface is directly reflected, at the same wavelength, from the surface back into space. Typical surface reflectance values, or albedo, are shown below: Soils 5–10% Desert 20–40% Forest 5–20% Grass 15–25% Snow, dependent on age 40–90% Water, sun high in sky 2–10% Water, sun low in sky 10–80% In the insolation input diagram shown below it can be seen that about 26% of insolation is directly reflected back into space by the atmosphere but 19% is absorbed within it as thermal energy, with much of the UV radiation being absorbed within the stratospheric ozone layer. Clouds reflect 20% and absorb 3%, and atmospheric gases and particles reflect 6% and absorb 16%. Altogether some 70% of insolation is absorbed at the Earth's surface and in the upper atmosphere, but eventually all this absorbed radiation is re-radiated back into space as long-wave (3 to 30 microns) infrared. The result of radiation absorption and re-radiation is that the mean atmospheric surface temperature is maintained at 15 °C. Terrestrial radiation The surface–atmosphere radiation emission diagram below shows that some 6% of input is lost directly to space as long-wave infrared from the surface. Atmospheric O2, N2, and argon cannot absorb the long-wave radiation. Also there is a window in the radiation spectrum between 8.5 and 11 microns where infrared radiation is not absorbed to any great extent by the other gases. About 15% of the received energy is emitted from the surface as long-wave radiation, and absorbed by water vapour and cloud droplets within the troposphere, and by carbon dioxide in the mesosphere. This is actually a net 15%; the total is much greater but the remainder is counter-balanced by downward long-wave emission from the atmosphere. Radiation emitted upwards into space, principally nocturnal cooling, is re-radiated from clouds (26%) plus water vapour, O3 and CO2 (38%). The atmosphere then has a net long-wave energy deficit, after total upwards emission (64%) and absorption (15%). This is equivalent to 49% of solar input and a short-wave insolation excess of 19% (16% + 3% absorbed) resulting in a total atmospheric energy deficit equivalent to 30% of insolation. Energy balance The surface has a radiation surplus of 30% of solar input: 51% short wave absorbed less 21% long wave emitted. This surplus thermal energy is convected to the atmosphere by sensible heat flux (7%) and by latent heat flux (23%). (The 'flux' is a flow of energy). The latent heat flux is greater because the ratio of global water to land surface is about 3:1. Over oceans, possibly 90% of the heat flux from the surface is in the form of latent heat. Conversely over arid land, practically all heat transfer to the atmosphere is in the form of sensible heat. Overall the earth—atmosphere radiation/re-radiation system is in balance. But between latitudes 35°N and 35°S more energy is stored than re-radiated, resulting in an energy surplus. But between the 35° latitudes and the poles there is a matching energy deficit. There is also a diurnal and a seasonal variation in the radiation balance. The average daily solar radiation measured at the surface in Australia is 7.5 kW hours/m² in summer and 3.5 kW hours/m² in winter. All substances emit electromagnetic radiation in amounts and wavelengths dependent on their temperature. The hotter the substance, the shorter will be the wavelengths at which maximum emission takes place. The sun, at 6000 K, gives maximum emission at about 0.5 microns in the visible light band. The Earth, at 288 K, gives maximum emission at about 9 microns in the long-wave infrared band. Tropospheric transport of surface heating and cooling The means by which surface heating or cooling is transported to the lower troposphere are: by conduction — air molecules coming into contact with the heated (or cooled) surface are themselves heated (or cooled) and have the same effect on adjacent molecules; thus an air layer only a few centimetres thick becomes less (or more) dense than the air above by convective mixing — occurs when the heated air layer tries to rise and the denser layer above tries to sink. Thus small turbulent eddies build and the heated layer expands from a few centimetres to a layer hundreds, or thousands, of feet deep depending on the intensity of solar heating; see 'Convection'. Convective mixing is more important than mechanical mixing for heating air, and is usually dominant during daylight hours. In hot, dry areas of Australia the convective mixing layer can extend beyond 10 000 feet by mechanical mixing — where wind flow creates frictional turbulence; see 'Frictional turbulence.. Mechanical mixing dominates nocturnally when surface cooling and conduction create a cooler, denser layer above the surface — thus stopping convective mixing. If there is no wind mechanical mixing cannot occur, see 'Fog'. The term (planetary) boundary layer is used to describe the lowest layer of the atmosphere, roughly 1000 to 6000 feet thick, in which the influence of surface friction on air motion is important. It is also referred to as the friction layer or the mixed layer. The boundary layer will equate with the mechanical mixing layer if the air is stable and with the convective mixing layer if the air is unstable. The term surface boundary layer or surface layer is applied to the thin layer immediately adjacent to the surface, and part of the planetary boundary layer. Within this layer the friction effects are more or less constant throughout, rather than decreasing with height, and the effects of daytime heating and night-time cooling are at a maximum. The layer is roughly 50 feet deep, and varies with conditions. Heat advection Advection is transport of heat, moisture and other air mass properties by horizontal winds. Warm advection brings warm air into a region. Cold advection brings cold air into a region. Moisture advection brings moister air and is usually combined with warm advection. Advection is positive if higher values are being advected towards lower values, and negative if lower values are being advected towards higher; e.g. cold air moving into a warmer region. Advection into a region may vary with height; e.g. warm, moist advection from surface winds while upper winds are advecting cold, dry air. 2.2.2 Electromagnetic wave spectrum The electromagnetic spectrum stretches over 60 octaves, the frequency doubling within each octave. For example, the frequencies in octave #18 range from 68.58 MHz to 137.16 MHz — which includes the aviation VHF NAV/COM band. In a vacuum, electromagnetic waves propagate at a speed close to 300 000 km/sec. The frequency can be calculated from the wavelength thus: Frequency in kHz = 300 000/wavelength in metres Frequency in MHz = 300/wavelength in metres or 30 000/ wavelength in centimetres Frequency in GHz = 30/wavelength in centimetres The very high frequency [VHF] band used in civil aviation radio communications lies in the 30 to 300 MHz frequency range — thus the 10 metre to 1 metre wavelength range. The other civil aviation voice communications band is in the high frequency [HF] range; 3 to 30 MHz or 100 to 10 metres. The amplitude of the wave is proportional to the energy of vibration. The table below shows the wave length ranges — beginning in nanometres [nm] and progressing through micrometres/microns [µm], millimetres, metres and kilometres — and the associated radiation bands. 2.2.3 Tropospheric global heat transfer Precipitation is less than evaporation between 10° and 40° latitudes — the difference being greatest at about 20°. Polewards and equatorwards of these bands precipitation is greater than evaporation. The transfer of atmospheric water vapour, containing latent heat, is polewards at latitudes greater than 20° and equatorwards at lower latitudes. Most of the vertical heat transfer is in the form of latent heat, but possibly 65% of the atmospheric horizontal transfer is in the form of sensible heat following condensation of water vapour. Horizontal latent heat transfer occurs primarily in the lower troposphere. The general wind circulation within the troposphere and the water circulation within the oceans transfers heat from the energy surplus zones to the energy deficit zones, thereby maintaining the global heat balance. About 70% is transferred by the atmosphere and 30% by the oceans. The large mid-latitude eddies, and the cyclones and anticyclones in the broad westerly wind belt that flows around the southern hemisphere, play a particularly important part in the transfer of the excess heat energy from low to high latitudes and in the mixing of cold Antarctic air into the mid-latitudes. 2.2.4 Temperature lapse rates in the troposphere The temperature lapse rates in the troposphere vary by latitude, climatic zone and season, and vary between less than 0 °C/km (i.e. increasing with height) at the winter poles to more than 8 °C/km over a summer sub-tropical ocean. In the mid-latitudes the temperature reduces with increasing height at varying rates, but averages 6.5 °C/km or about 2 °C per 1000 feet. However, within any tropospheric layer, temperature may actually increase with increasing height. This reversal of the norm is a temperature inversion condition. If the temperature in a layer remains constant with height then an isothermal layer condition exists. At night, particularly under clear skies, the air in the mixed layer cools considerably, but the long-wave radiation from the higher levels is weak and the air there cools just 1 °C or so. Consequently a nocturnal inversion forms over the mixed layer, the depth of which depends on the temperature drop and the amount of mechanical mixing;see 'Fog'. Tropospheric average temperature lapse rate profile The altitude of the tropopause, and thus the thickness of the troposphere, varies considerably. Typical altitudes are 55 000 feet in the tropics with a temperature of –70 °C and 29 000 feet in polar regions with a temperature of –50 °C. Because of the very low surface temperatures in polar regions and the associated low-level inversion, the temperature lapse profile is markedly different from the mid-latitude norms. In mid-latitudes the height of the troposphere varies seasonally and daily with the passage of high and low pressure systems. In the chart above, an exaggerated environmental temperature lapse rate profile has been superimposed to illustrate the temperature layer possibilities — starting with a superadiabatic lapse layer at the surface, a normal lapse rate layer above it then a temperature inversion layer and an isothermal layer. 2.2.5 Adiabatic processes and lapse rates An adiabatic process is a thermodynamic process where a change occurs without loss or addition of heat, as opposed to a diabatic process in which heat enters or leaves the system. Examples of the latter are evaporation from the ocean surface, radiation absorption and turbulent mixing. An adiabatic temperature change occurs in a vertically displaced parcel of air due to the change in pressure and volume (see the gas equation in 'Gas laws and basic atmospheric forces') occurring during a short time period, with little or no heat exchange with the environment. Upward displacement and consequent expansion causes cooling; downward displacement and subsequent compression causes warming. In the troposphere, the change in temperature associated with the vertical displacement of a parcel of dry (i.e. not saturated) air is very close to 3 °C per 1000 feet, or 9.8 °C / km, of vertical motion; this is known as the dry adiabatic lapse rate [DALR]. As ascending moist air expands and cools in the adiabatic process, the excess water vapour condenses after reaching dewpoint and the latent heat of condensation is released into the parcel of air as sensible heat, thus slowing the pressure-induced cooling process. This condensation process continues while the parcel of air continues to ascend and expand. The process is reversed as an evaporation process in descent and compression. The adiabatic lapse rate for saturated air, the saturated adiabatic lapse rate [SALR], is dependent on the amount of moisture content, which is dependent on temperature and pressure. The chart below shows the SALR at pressures of 500 and 1000 mb (hPa), and temperatures between –40 °C and +40 °C. The chart shows that on a warm day (25 °C) the SALR near sea level is about 1.2 °C / 1000 feet. At about 18 000 feet — the 500 hPa level — the rate doubles to about 2.4 °C / 1000 feet. The environment lapse rate [ELR] is ascertained by measuring the actual vertical distribution of temperature at that time and place. The ELR may be equal to or differ from the DALR or SALR of a parcel of air moving within that environment. In the atmosphere, parcels of air are stirred up and down by turbulence and eddies that may extend several thousand feet vertically in most wind conditions. These parcels mix and exchange heat with the surrounding air thus distorting the adiabatic processes. If the rate of ground heating by solar radiation is rapid, the mixing of heated bubbles of air may be too slow to induce a well-mixed layer with a normal DALR. The ELR, up to 2000–3000 feet agl, may be much greater than the DALR. Such a layer is termed a superadiabatic layer, and will contain strong thermals and downdraughts. 2.2.6 Atmospheric stability Atmospheric stability is the air's resistance to any disturbing effect. It can be defined as the ability to resist the narrowing of the spread between air temperature and dewpoint. Stable air cools slowly with height and vertical movement is limited. If a parcel of air, after being lifted, is cooler than the environment, the parcel — being more dense than the surrounding air — will tend to sink back and conditions are stable. The temperature of unstable air drops more rapidly with an increase in altitude, i.e. the ELR is steep. If a lifted parcel is warmer, and thus less dense than the surrounding air, the parcel will continue to rise and conditions are unstable. Unstable air, once it has been lifted to the lifting condensation level, keeps rising through free convection. Instability can cause upward or downward motion. When saturated air containing little or no condensation, is made to descend then adiabatic warming causes the air to become unsaturated almost immediately and further descent warms it at the DALR. If the ELR lies between the DALR and the SALR, a state of conditional instability exists. Thus, if an unsaturated parcel of air rises from the surface, it will cool at the DALR and so remain cooler than the environment, and conditions are stable. However, if the parcel passes dewpoint during the ascent it will then cool at a slower rate and, on further uplift, become warmer than the environment and so become unstable. High dewpoints are an indication of conditional instability. The figure below demonstrates some ELR states with the consequent stability condition: ELR #1 is much greater than the DALR (and the SALR), thus providing absolute instability. This condition is normally found only near the ground in a superadiabatic layer — although a deep superadiabatic layer exists in the hot, dry tropical continental air of northern Australia in summer. ELR # 2 between the DALR and the SALR demonstrates conditional instability. It is stable when the air parcel is unsaturated, i.e. the ELR is less than the DALR; and unstable when it is saturated, i.e. the ELR is greater than the SALR. ELR #3 indicates absolute stability, where the ELR is less than the SALR (and the DALR). Neutral equilibrium would exist if the ELR equals the SALR and the air was saturated, or if the ELR equals the DALR and the air was unsaturated. The following diagram is an example of atmospheric instability and cloud development, and compares environment temperature and that of a rising air parcel with a dewpoint of 11 °C. The amount of energy that could be released once surface-based convection is initiated in humid air is measured as convective available potential energy [CAPE]. CAPE is measured in joules per kilogram of dry air. It may be assessed by plotting the vertical profile of balloon radiosonde readings for pressure, temperature and humidity on a tephigram (a special meteorological graph format); and also plotting the temperatures that a rising parcel of air would have in that environment. On the completed tephigram, the area between the plot for environment temperature profile and the plot for the rising parcel temperature profile is directly related to the CAPE, which in turn is directly related to the maximum vertical speed in a cumulonimbus [Cb] updraught. One form of aerological diagram is used to determine the stability of the atmosphere — and thus potential thermal activity — by plotting the ELR from radiosonde data and comparing that with the DALR and SALR lines on the diagram. For more information go to the aviation section of the Australian Bureau of Meteorology website and look in the 'Sports Aviation' box for 'How to use the Aerological Diagram'. While there also look in the 'Learning' box for the 'Aviation eHelp' section. 2.2.7 Convergence, divergence and subsidence Synoptic scale atmospheric vertical motion is found in cyclones and anticyclones, and is caused mainly by air mass convergence or divergence from horizontal motion. Meteorological convergence indicates retardation in air flow with an increase in air mass in a given volume due to net three-dimensional inflow. Meteorological divergence, or negative convergence, indicates acceleration with a decrease in air mass. Convergence is the contraction and divergence is the spreading of a field of flow. If, for example, the front end of moving air mass layer slows down, the air in the rear will catch up — converge — and the air must move vertically to avoid local compression. If the lower boundary of the moving air mass is at surface level, all the vertical movement must be upward. If the moving air mass is just below the tropopause, all the vertical movement will be downward because the tropopause inhibits vertical motion. Conversely, if the front end of a moving air mass layer speeds up, then the flow diverges. If the air mass is at the surface, then downward motion will occur above it to satisfy mass conservation principles. If the divergence is aloft, then upward motion takes place. Rising air must diverge before it reaches the tropopause, and sinking air must diverge before it reaches the surface. As the surface pressure is the weight per unit area of the overlaying column of air, and even though divergences in one part of the column are largely balanced by convergences in another, the slight change in mass content of the overriding air changes the pressure at the surface. The following diagrams illustrate some examples of convergence and divergence: Note: referring to the field of flow diagrams above, the spreading apart (diffluence) and the closing together (confluence) of streamlines alone do not imply existence of divergence or convergence, as there is no change in air mass if there is no cross-isobar flow or vertical flow. (An isobar is a curve along which pressure is constant, and is usually drawn on a constant height surface such as mean sea level.) Divergence or convergence may be induced by a change in surface drag; for instance, when an airstream crosses a coastline. An airstream being forced up by a front will also induce convergence. For convergence / divergence in upper-level waves, refer to Rossby waves. Some divergence / convergence effects may cancel each other out; e.g. deceleration associated with diverging streamlines. Developing anti-cyclones — 'highs' and high pressure ridges are associated with converging air aloft, and consequent wide-area subsidence with diverging air below. This subsidence usually occurs from 20 000 down to 5000 feet, typically at the rate of 100 – 200 feet per hour. The subsiding air is compressed and warmed adiabatically at the DALR, or an SALR, and there is a net gain of mass within the developing high. Some of the converging air aloft rises and, if sufficiently moist, forms the cirrus cloud often associated with anti-cyclones. As the pressure lapse rate is exponential and the DALR is linear the upper section of a block of subsiding air usually sinks for a greater distance (refer to section 2.1 ISA table) and hence warms more than the lower section. If the bottom section also contains layer cloud, the sinking air will only warm at a SALR until the cloud evaporates. Also, when the lower section is nearing the surface, it must diverge rather than descend and thus adiabatic warming stops. With these circumstances it is very common for a subsidence inversion to consolidate at an altitude between 3000 and 6000 feet. The weather associated with large-scale subsidence is almost always dry. However, in winter, persistent low cloud and fog can readily form in the stagnant air due to low thermal activity below the inversion, producing 'anti-cyclonic gloom'. In summer there may be a haze or smoke layer at the inversion level, which reduces horizontal visibility at that level — although the atmosphere above will be bright and clear. Aircraft climbing through the inversion layer will usually experience a wind velocity change. Developing cyclones, 'lows' or 'depressions' and low-pressure troughs are associated with diverging air aloft and uplift of air, leading to convergence below. There is a net loss of mass within an intensifying low as the rate of vertical outflow is greater than the horizontal inflow, but if the winds continue to blow into a low for a number of days, exceeding the vertical outflow, the low will fill and disappear. The same does not happen with anti-cyclones, which are much more persistent. A trough may move with pressure falling ahead of it and rising behind it, giving a system of pressure tendencies due to the motion but with no overall change in pressure, i.e. no development, no deepening and no increase in convergence. 2.2.8 Momentum, Coriolis effect and vorticity Momentum definitions Angular velocityThe rate of change of angular position of the rotating Earth = W = 7.29 x 10⁻⁵ radians per second. (One radian = 57.2958°, 2p radians = 360°) or, the rate of angular rotation around a cyclone or anticyclone = w. (A rotor that spins at 1000 rpm has twice the angular velocity of one spinning at 500 rpm). Tangential angular velocityThe tangential angular velocity of a point on the Earth's surface is the product of its radial distance (r) from the Earth's rotational axis and W = Wr. The radial distance from the rotational axis is zero at the poles increasing to maximum at the equator. Angular momentumThe angular momentum of a point on the Earth's surface is the product of the tangential angular velocity and mass (m), and the radial distance from the rotational axis =mWr². If mass is presumed at unity then angular momentum = Wr². Or, angular momentum for a rotating air mass is the product of w and the radius of curvature = wr. Conservation of angular momentumThe principle of conservation of angular momentum states that the total quantity of energy (mass x velocity) of a system of bodies; e.g. Earth–atmosphere, not subject to external action, remains constant. Friction reduces the angular momentum of an air mass rotating faster than the Earth, e.g. a westerly wind, but the 'lost' omentum is imparted to the Earth, thus the angular momentum of the Earth–atmosphere system is conserved. Coriolis effect Coriolis effect (named after Gaspard de Coriolis, 1792 – 1843) is a consequence of the principle of conservation of angular momentum. The Coriolis or geostrophic force is an apparent or hypothetical force that only acts when air is moving. A particle of air or water at 30° S is rotating west to east with the Earth's surface at a tangential velocity of about 1450 km/hour. If that particle of air starts to move towards the equator, the conservation principle requires that the particle continue to rotate eastward at 1450 km/hour even though the rotational speed of the Earth' surface below it is accelerating as the particle closes with the equator, which is rotating at 1670 km/hour. Tangential eastward velocity at the Earth's surface Equator 1670 km/hour 464 metres/sec 15° South 1613 km/hour 448 metres/sec 30° South 1446 km/hour 402 metres/sec 45° South 1181 km/hour 328 metres/sec 60° South 835 km/hour 232 metres/sec 75° South 432 km/hour 120 metres/sec 90° South 0 km/hour 0 metres/sec Thus air or water moving towards the equator is deflected westward relative to the Earth's surface. Conversely, air moving from low latitudes, with high rotational speed and momentum, is deflected eastward, i.e. as a westerly wind, when moving to higher latitudes with lower rotational speeds. The Coriolis force is directed perpendicular to the Earth's axis, i.e. in a plane parallel to the equatorial plane, so it has maximum effect on horizontal air movement at the poles and no effect on horizontal air movement at the equator. The direction of its action is perpendicular to the particle velocity and to the left in the southern hemisphere, i.e. standing with your back to the wind the Coriolis effect will be deflecting the wind direction to the left (to the right in the northern hemisphere). The rate of turning, or curvature, of a moving particle of air or water is proportional to 2VW sine f, where V is the north/south component of the particle's velocity and f is the latitude. Because sine 90° = 1 and sine 0° = 0, then the Coriolis must be at maximum at the poles and zero at the equator, as expressed above. The Coriolis effect stops turning the moving air only when it has succeeded in turning it at right angles to the force that initiated the movement — a pressure or thermal gradient. The Coriolis parameter, f = 2W sine f, is the local component of the Earth's rotation about its axis that contributes to air circulation in the local horizontal plane. It is assumed negative in the southern hemisphere and positive in the northern hemisphere. Vorticity Vorticity or spin is the measure of rotation of a fluid about three-dimensional axes. Vorticity in the horizontal plane, i.e. about the vertical axis, is the prime concern in planetary scale and synoptic scale systems. Relative vorticity is taken as horizontal motion, relative to the Earth's surface, about the local vertical axis and is measured as circulation per unit area. It is assumed to be negative if cyclonic and positive if anticyclonic. Relative vorticity z = 2w. Absolute vorticity is the relative vorticity plus the Coriolis parameter — which is maximum at the poles and zero at the equator. Relative vorticity is related to horizontal divergence and convergence through the principle of conservation of angular momentum. In the cyclonic movement of air around a low pressure system the fractional decrease in horizontal area due to convergence is matched by a fractional increase in spin, thus conserving the angular momentum. With both increasing vorticity and convergence at lower levels, the vertical extent of the air column is stretched adiabatically and the upper-level divergence lifts to higher levels. Conversely, in anticyclonic rotation, the fractional increase in the surface area of the system, due to lower level divergence, is matched by a fractional decrease in spin. With decreasing vorticity and divergence at a lower level, the vertical extent of the air column shrinks adiabatically and the upper level convergence sinks to lower levels. The relationship is expressed in the principle of conservation of potential absolute vorticity equation: Coriolis parameter + relative vorticity / vertical depth of the air column ( D ) = constant or, f + z / D = constant Thus as the Coriolis at a given southern latitude is constant and negative, a reduction in the depth of a column at that latitude requires z to become more positive with consequent anticyclonic rotation. Conversely, an increase in depth requires z to become more negative with consequent cyclonic rotation. The principle accounts for the development of wave patterns in upper air flow. The cyclonic curvature of the isobars can be seen on surface synoptic charts resulting from the easterly / south-easterly trade wind encountering the mountain ranges along the north Queensland coast. The initial reduction in vertical depth as the airstream encounters the barrier, followed by the increase in depth on the western side, induces anticyclonic and cyclonic curvature. 2.2.9 Thermal gradients and the thermal wind concept The rate of fall in pressure with height is less in warm air than in cold, and columns of warm air have a greater vertical extent than columns of cold air. Consider two adjacent air columns having the same msl pressure; the isobaric surfaces (surfaces of constant pressure) are at higher levels in the warm air column, which result in a horizontal pressure gradient from the warm to the cold air — this increases with height, i.e. the temperature gradient causes increasing wind to higher levels. The horizontal pressure gradient increases as the horizontal thermal gradient increases — this is known as the thermal wind mechanism. The isobaric surface contours vary with height so the geostrophic wind velocity above a given point also varies with height. The wind vector difference between the two levels above the point — the vertical wind shear — is called the thermal wind, i.e. the wind vector component caused by temperature difference rather than pressure difference. On an upper air thickness chart which indicates the heat content of the troposphere, the thermal wind is aligned with the geopotential height lines or with the isotherms on an upper-air constant pressure level chart (isobaric surface chart), and the thicker (warmer) air is to the left looking downwind. *Note: a geopotential height line is a curve of constant height, i.e. the height contours relating to an isobaric surface — 850 or 500 hPa for example — usually shown as metres above mean sea level. Thickness charts are similar but show the vertical difference in decametres (i.e. tens of metres, symbol 'dam') between two isobaric surfaces — usually 1000 hPa and 500 hPa. See the national weather and warnings section of the Australian Bureau of Meteorology and view the weather and wave maps. An isopleth is the generic name for all isolines or contour lines. An isotherm is a curve connecting points of equal temperature and is usually drawn on a constant pressure surface or a constant height surface. The speed of the thermal wind is proportional to the thermal gradient; the closer the contour spacing, the stronger the thermal wind. If the horizontal thermal gradient maintains much the same direction through a deep atmospheric layer — for instance there are no upper level highs or lows, and the gradient is strong with the colder air to the south — then the thermal wind will increase with height, eventually becoming a constant westerly vector. The resultant high-level wind will be high speed and nearly westerly. Generally, colder air is to the south so that the thermal wind vector tends westerly. But if the horizontal thermal gradient reverses direction with height, then an easterly thermal wind will occur above that level and the upper-level westerly geostrophic wind speed will decrease with height. Because the direction of the thermal gradient is reversed above the tropopause, the thermal wind reverses to easterly. The horizontal thermal gradient is at maximum just below the tropopause, where the jet stream occurs. At latitude 45° S a temperature difference of 1 °C in 100 km will cause an increase in thermal wind of 10 m/sec (or about 20 knots) for every 10 000 feet of altitude — giving jet stream speeds at 30 000 feet, ignoring geostrophic wind. Temperature contrasts between air masses at the polar front will be greatest during winter, giving the strongest jet stream. STRICT COPYRIGHT JOHN BRANDON AND RECREATIONAL FLYING (.com)
 -
 2.1.1 Atmospheric structure Temperature-related layers There are four temperature-related atmospheric regions. The outermost is the thermosphere, within which the temperature rises rapidly with height until about 300 km above Earth's surface. In parts of the thermosphere, the temperature varies diurnally (daily) by 30% or so (200 °C – 300 °C ), due to absorption of ultra-violet solar radiation as thermal energy, without the ability to re-radiate. Depending on the sunspot activity cycle, theoretical molecular temperatures at the 150–300 km level vary between 200 °C and 1700 °C but due to the rarified atmosphere there is little sensible heat capacity, i.e. a normal thermometer would sense a temperature less than 0 °C. The absorbed heat is conducted downward below 100 km where the atmosphere can re-radiate at night. 'Space' is said to start at 100 km altitude, which would mark the thermosphere as the beginning of space. Temperature decreases rapidly with height in the mesosphere (from the Greek 'mesos' — middle); the minimum of about –90 °C is reached at the mesopause located at about 80 km where atmospheric pressure is about 0.01 hPa. Carbon dioxide in the mesosphere is an important absorber of terrestrial infra-red radiation. A group of wind systems is centred within the mesosphere, just above the stratopause, extending into the stratosphere and, to some extent, the thermosphere. Most of the atmosphere's ozone [O3] is contained within the stratosphere (from the Latin 'stratum' — layered); the O3 is produced between the 30 and 60 km levels by reaction between atomic oxygen [O] and molecular oxygen [O2]. Atmospheric circulation transports ozone down to the 25 km level where maximum density occurs — this is the ozone layer. The ozone content tends to concentrate at lower levels in the higher latitudes during the winter months and is transported to lower latitudes during spring. Ozone blocks about 90% of the sun's UV radiation — roughly all radiation between 0.25 and 0.35 micrometres. That UV energy absorption results in the temperature in the upper half of the stratosphere increasing until the stratopause. The temperature in the lower half of the stratosphere tends to remain constant or increase slightly with height, thus the layer is usually very stable. Some vertical mixing occurs and there is east-west and west-east circulation, but once gases or particles enter the stratosphere they tend to stay in it for long periods. The troposphere (from the Greek 'tropos' — [over]turning) — its thickness varying from about 8 km at the poles to 28 km at the equator, and varying daily and seasonally — contains virtually all the atmospheric water and more than 90% of the air mass. Condensation of water vapour, forming clouds, occurs almost exclusively in the lowest 8 km where the water vapour comprises up to 3% or 4% of the atmosphere by volume. The troposphere is heated by terrestrial long-wave radiation plus turbulent mixing of latent and sensible heat. Vertical air movement can be pronounced and temperature decreases linearly with height until the tropopause. The low temperature at the tropopause (–40 °C to –50 °C in the mid-latitudes) allows very little water vapour to pass above it; refer atmospheric moisture below. Composition-related layers The troposphere, stratosphere and mesosphere constitute the homosphere (from the Greek 'homos' — same) in which the composition of the atmosphere is more or less uniform throughout. The composition is primarily nitrogen (78%), oxygen (21%) and argon (<1%), plus other trace gases and particles; the two major non-permanent gases ozone (O3) and water vapour (H2O), plus carbon dioxide (CO2), are particularly important as radiation absorbers because of their triatomic structure. The average atmospheric relative molecular mass throughout the homosphere is about 29 atomic mass units (amu). The relative molecular weight of the main atmospheric components is: Relative weight of atmospheric gases (atomic mass units) Atomic forms Diatomic forms Triatomic forms H He C O H2 N2 O2 H2O CO2 O3 1 4 12 16 2 28 32 18 44 48 The composition changes above the mesopause. The atmospheric gases tend to separate into layers according to the relative molecular weight of the individual components, thus the average relative molecular mass decreases with height. This second composition layer, which extends to inner space, is the heterosphere (from the Greek 'heteros' — other).There is little or no nitrogen (N2) above 150 km, atomic oxygen (O) dominates between 300 and 1000 km, helium (He) between 1000 and 2000 km, and hydrogen (H) above that. Radiation-related layers In the photochemical ionosphere (which is mostly contained within the thermosphere but also partly extends into the neighbouring mesosphere), cosmic radiation of high-energy sub-atomic particles and the absorption of much of the solar ultraviolet radiation separates negative electrons from oxygen and nitrogen molecules. The ions and free electrons move rapidly under the influence of electrical forces — the ionospheric wind — and the ionosphere is highly conductive; see the global circuit. Oxygen is chemically active when affected by shortwave ultraviolet radiation and molecular (diatomic) oxygen, O2 , dissociates into atomic (monatomic) oxygen. Above 150 km the molecular nitrogen separates out owing to its higher mass, and the atmosphere is predominantly atomic oxygen. The excitation of oxygen and nitrogen atoms by collision with charged particles (separated hydrogen electrons and protons) from outburst emissions of solar wind produces the aurorae in the ionosphere. Several ionisation layers are formed in the ionosphere that affect radio communications: The F2 or Appleton layer is at about 400 km by day, descending to 200 km at night. Ionisation varies from 106 free electrons/cc during the day to 105 at night. The layer refracts LF, MF and HF radio transmission waves. But transmissions in the VHF, UHF and higher radio frequencies — which are those used by sport and recreational aviation — are not significantly affected. The F1 layer is at about 200 km. Nitrogen is ionised by short-length UV radiation in the F layers. The E or Heaviside-Kennelly layer is at 90–150 km. It has 105 free electrons/cc by day, but disappears at night. The E layer partially reflects LF, MF, HF and sometimes VHF signals back to earth. At night, it is replaced by the F2 layer at 200 km. The longest X-rays ionise oxygen and nitrogen. The D layer, where N2O is ionised by medium length UV, exists only during daylight at 50–90 km. It reflects LF and VLF waves, absorbs MF and attenuates HF. Solar outbursts (sunspots, flares) radiate X-rays in abnormal quantity and ionise the E and D layers strongly, lowering their altitude and adversely affecting HF communications during the day. The changes in the ionisation layers affect the sky waves of older navigation aids such as non-directional beacons which operate in the LF band. Errors in directional indications will increase, particularly during the morning and evening twilight periods. The energy-absorbing region from the tropopause to the D layer, i.e. the stratosphere and the mesosphere, is the ozonosphere. Ultraviolet radiation dissociates the water vapour that reaches the stratosphere and higher regions into hydrogen and oxygen atoms. When such atoms reach the exosphere (from the Greek 'exo' — outside) — above the thermopause at about 500 km and extending out for an indeterminate distance, where the lighter components predominate — some atoms, particularly helium and hydrogen, will reach escaping velocity. The temperature within the exosphere remains roughly constant with height, although it varies daily and seasonally. The magnetosphere limits the Earth's geomagnetic field. Within it are the Van Allen belts of high-energy solar wind and cosmic radiation particles trapped by the magnetic field. The outer, mainly electron, belt is centred about 18 000 km above the equator. The inner, more energetic and mainly proton, belt is centred at 3000 km. Changes within the magnetosphere may influence weather. 2.1.2 Gas laws and basic atmospheric forces Gas laws The density (the mass of a unit of volume) of dry air is about 1.2 kg/m³ at mean sea level [msl] and decreases with altitude. The random molecular activity within a parcel of air exerts a force in all directions and is measured in terms of pressure energy per unit volume, or static pressure. This activity, i.e. the internal kinetic energy, is proportional to the absolute temperature. (Absolute temperature is expressed in kelvin units [K]. One K equals one degree Celsius and zero degrees in the Celsius scale is equivalent to 273 K, so 20 °C equals an absolute temperature of 293 K.) There are several gas laws and equations that relate temperature, pressure, density and volume of a gas. Boyle's law: At a constant temperature the volume [V] of a given mass of gas is inversely proportional to the static pressure [P] upon the gas; i.e. P × V = constant. The pressure law: At a constant volume the static pressure is directly proportional to temperature [T] in kelvin units. Charles' law: At a constant pressure gases expand by about 1/273 of their volume, at 273 K, for each one K rise in temperature; i.e. the volume of a given mass of gas at constant pressure is directly proportional to the absolute temperature. If an amount of heat is taken up by a gas some of the heat is converted into internal energy and the balance is used in the work done in pushing back the environment as the gas expands. The gas equation: For one mole* of gas, the preceding laws are combined in the gas equation PV = RT where R = the universal gas constant = 8.314 joules per Kelvin per mole. The specific gas constant for dry air (i.e. no water vapour present) is 2.87 when P is expressed in hectopascals [hPa]. Ordinary gases do not behave exactly in accordance with the gas laws because of molecular attraction and repulsion. The gas equation approximates the behaviour of a parcel of air when temperature or pressure, or both, are altered; e.g. if temperature rises and pressure is constant, then volume must increase — consequently the density of the air decreases and the parcel becomes more buoyant. Conversely, if temperature falls and pressure is constant then volume must decrease, the air becomes denser and the parcel less buoyant. Warmed air is comparatively light and cooled air is comparatively heavy. (In meteorological terms a parcel is a mass of air small enough that the whole mass moves or behaves as a single object.) *Note: a mole is the basic SI unit of amount of substance. One mole of any substance contains 6 x 10²³ molecules, the latter being the number of molecules in 12 grams of carbon-12.) The equation of state: P = RrT / M where r = density and M = molecular weight. But for meteorological purposes M is ignored and the equation used is P = 2.87rT. For example, if density remains constant and the temperature increases (decreases), then static pressure increases (decreases) or conversely, if density remains constant and the pressure increases (decreases) then temperature increases (decreases). Or, if pressure remains constant then an increase in temperature causes a decrease in density, and vice versa. For our purposes pressure is expressed in hectopascals, density in kilograms per cubic metre and temperature in kelvins. Dalton's law: The total pressure of a mixture of gases or vapours is equal to the sum of the partial pressures of its components. The partial pressure is the pressure that each component would exert if it existed alone and occupied the same volume as the whole. As powered recreational aircraft operate at altitudes below 10 000 feet, the component that we have most interest in is the partial pressure of water vapour because that affects the formation of mist, fog and cloud, but above 8000 feet or so the decreasing oxygen partial pressure may start to affect pilot performance — see the 'Physiological effects of altitude'. Basic atmospheric forces The basic forces acting in the atmosphere are: Gravity, which acts vertically towards the centre of the Earth The vertical pressure gradient force, which acts vertically upwards; and the horizontal pressure gradient force, which acts horizontally. Expanded in the following section 1.3. Coriolis effect, which induces turning or curvature in horizontal air flow; refer to Coriolis force. Friction, which acts to retard horizontal air flow particularly at the surface; refer to these sections; 'Frictional turbulence', 'Velocity change between surface wind and gradient wind and 'Boundary layer turbulence'. 2.1.3 Atmospheric pressure and buoyancy The pressure gradient Atmospheric pressure reflects the average density and thus the weight of the column of air above a given level. Thus the pressure at a point on the Earth's surface must be greater than the pressure at any height above it. An increase in surface pressure denotes an increase in mass, not thickness, of the column of air above the surface point. Similarly a decrease in surface pressure denotes a decrease in the mass. The gradient is the difference in pressure vertically and horizontally. The air throughout the column is compressed by the weight of the atmosphere above it. Thus the density of a column of air is greatest at the surface and decreases exponentially with altitude as shown in the following graph, which is a plot of the rate of decrease in density with increase in altitude. The plot is for dry air at mid-latitudes. ( Mid-latitudes are usually accepted to be the areas between the 30° and 60° parallels, while low latitudes lie between the equator and 30°, and high latitudes between 60° and the poles.) The atmosphere at about 22 000 feet has only 50% of the sea level density. Density decreases by about 3% per 1000 feet between sea level and 18 500 feet, and thereafter the density lapse rate slows. The dry air density gradient in mid-latitudes. See the 'International Standard Atmosphere'. As the pressure decreases with height so, in any parcel of air, the downwards pressure over the top of the parcel must be less than the upwards pressure under the bottom. Thus within the parcel there is a vertical component of the pressure gradient force acting upward. Generally this force is balanced by the gravitational force, so the net sum of forces is zero and the parcel floats in equilibrium. This balance of forces is called the hydrostatic balance. When the two forces do not quite balance, the difference is the buoyancy force. This is the upward or downward force exerted on a parcel of air arising from the density difference between the parcel and the surrounding air. A visible application of this principle is readily apparent in the hot-air balloons and airships of sport and recreational aviation. Atmospheric pressure also varies horizontally due to air mass changes associated with the regional thickness of the atmospheric layer. The resultant horizontal pressure gradient force, not being balanced by gravity, moves air (as wind) from regions of higher pressure towards regions of lower pressure. But the movement is modified by the Coriolis effect. The horizontal force is very small, being about 1/15 000 of the vertical component. (Advection is the term used for the transport of momentum, heat, moisture, vorticity or other atmospheric properties, by the horizontal movement of air: see 'Heat advection') The following graph plots the average mid-latitude vertical pressure gradient and shows how the overall vertical decrease in pressure — the pressure lapse rate — slows exponentially as the air becomes less dense with height. In a denser or colder air mass the pressure reduces at a faster rate. Conversely, in less dense, or warmer, air the pressure reduces at a slower rate. (The hydrostatic equation states that the vertical change in pressure between two levels in any column of air is equal to the weight, per unit area, of the air in the column.) If two air columns have the same pressure change from top to bottom, the denser column will be shorter. Conversely, if the two columns have the same height, the denser column will have a larger change in pressure from top to bottom. In the ICAO standard atmosphere the rate of altitude change for each 1 hPa (or millibar [mb]) change in pressure is approximately: 0 to 5000 feet: 30 feet/hPa or 34 hPa per 1000 feet 5000 to 10 000 feet: 34 feet/hPa or 29 hPa per 1000 feet 10 000 to 20 000 feet: 43 feet/hPa or 23 hPa per 1000 feet 20 000 to 40 000 feet: 72 feet/hPa or 14 hPa per 1000 feet The change in altitude for one hectopascal change in pressure can be calculated roughly from the absolute temperature and the pressure at the level using the equation: altitude change = 96T/P feet. Atmospheric oxygen and partial pressure In the homosphere each gas, including water vapour, exerts a partial pressure, which is the product of the total atmospheric pressure and the concentration of the gas. As oxygen represents about 21% of the composite gases, the partial pressure of oxygen is about 21% of the atmospheric pressure at any altitude within the homosphere. Interpolating from the pressure gradient graph above, oxygen partial pressure at selected altitudes is shown below. The decreasing partial pressure of oxygen as an aircraft climbs past 10 000–12 000 feet has critical effects on aircrew; the maximum exposure time — for a fit person — without inspiring supplemental oxygen, is shown in the right-hand column. Perception gradually decreases within the exposure times and exposure beyond these times leads to unconsciousness. Altitude (ft) O2 pressure (hPa) Maximum exposure time Sea level 210 — 7000 165 — 10 000 150 — 15 000 120 30+ minutes 18 000 105 20–30 minutes 25 000 80 3–5 minutes 30 000 65 1–3 minutes 35 000 50 30–60 seconds 40 000 30 10–20 seconds For further information see 'Physiological effects of altitude' in the Flight Theory Guide. 2.1.4 Atmospheric moisture Water vapour partial pressure, saturation and density Gas molecules normally exert attractive forces on each other, except when in very close proximity where the interaction is repulsive. If a gas or vapour is cooled so that molecular movements become relatively sluggish, the attractive forces draw the molecules close together to form a liquid. This process is condensation and water vapour is the only atmospheric gas that displays this property in nature. A moist atmosphere that includes water vapour is slightly less dense than a dry atmosphere at the same temperature and pressure; because the vapour displaces a corresponding amount of the other gases per unit volume and the molecular weight ratio of water vapour to dry air is 0.62:1*. Thus a parcel of moister air is slightly more buoyant than surrounding drier air. *Note: referring to the 'Relative weight of atmospheric gases' table above, the mass of a molecule of H2O is 18 atomic mass units (amu) while that of the oxygen (O2) and nitrogen (N2) diatomic molecules, that make up 21% and 78% of the atmospheric gases, is 32 amu and 28 amu respectively. So the mass of a dry air molecule averages about 29 amu and water vapour mass (18 amu) is 62% of that. As the water vapour molecule occupies about the same space as the dry air molecules it displaces, so air density (mass per unit volume) decreases a little as the humidity of the air increases, and this should be considered when calculating density altitude. Air doesn't 'hold' water, rather the water vapour molecules 'displace' air molecules. Vapour partial pressure is a measure of the amount of water vapour included in a parcel of air and increases as the amount of vapour increases. Moist air — including the maximum amount of water vapour that can be included, without condensation occurring at the prevailing temperature — is saturated; i.e. the water vapour pressure is equal to its maximum under that particular condition, and is in equilibrium with a surface of liquid water (e.g. an ocean surface or a water droplet, a water-filled sponge or seasoned wood) at the same temperature. When in equilibrium the same number of water molecules are condensed from the air back into the moist surface as are evaporated from the surface into the air. Water vapour and adjacent moist bodies are always striving for equilibrium, and the equilibrium state is achieved at the saturation vapour partial pressure, the level of which is a function of temperature. If saturated air is cooled it becomes supersaturated and the excess water vapour immediately condenses onto aerosols (microscopic particles — larger than molecules — of dust, smoke, pollution products and salt small enough to remain suspended in the atmosphere) and forms the minute water droplets of mist or cloud; see 'Cloud formation'. The overwhelming majority of aerosols in the upper atmosphere are built up in the cosmic radiation processes and are smaller than the wavelength of light, whereas the larger particles are found near the surface. Those condensation nuclei that have a very high affinity with water — such as salt — are termed hygroscopic particles — substances that absorb water vapour from the air. Such nuclei, which originate mainly from sea spray or dust containing salt, help in the initiation of condensation; as it will occur on them well before air is saturated — in the case of sodium chloride it is at 78% relative humidity. If the atmosphere were completely without aerosols, no condensation would occur until extreme supersaturation existed. If cloud droplets or ice crystals already exist, condensation will take place upon them. The maximum amount of vapour that can be present depends on temperature. A warm atmosphere has greater capacity for water vapour than a cold one; e.g. one kg of air at 35 °C can include 35 grams of vapour whereas one kg of air at –15 °C can include only one gram. Generally the atmosphere at a tropical ocean surface is 60 times moister than that at 15 000 feet over polar regions. The graph below plots the saturation vapour partial pressure, over a liquid water surface, for air temperatures between –20 °C and 45 °C. Saturation vapour partial pressure and dew point temperature The dew point is the temperature to which moist air must be cooled, at a given pressure and water vapour content, for it to reach saturation. Condensation occurs when the temperature falls below dew point; e.g. from the graph above it can be seen that an air parcel at 25 °C and 20 hPa vapour partial pressure would reach its dew point on the curve if it were cooled below 17 °C. Very dry air can have a dew point well below 0 °C. At ground level if dew point is below freezing, a light, crystalline hoar frost forms; but if dew forms before ground temperature subsequently falls below freezing then frozen, or white dew, results. Note: the spread between surface temperature and dew point temperature is an indication of relative humidity and the convection condensation level; e.g. the cloud base may be 1000 feet agl for each 2 °C of spread but inversions, turbulence, etc. will modify this. If the spread is less than 1.5 °C then ceiling and visibility may go below VFR minima. But at 2 °C or greater, CAV may be marginal to OK. Cloud scraps seen to be forming near the surface are a forewarning of visibility problems at low levels. The frost point is the point to which moist air must be cooled for it to reach saturation over an ice surface (e.g. airborne ice crystals). Further cooling induces direct deposition of ice onto solid surfaces, including ice surfaces. The saturation partial pressure at temperatures below freezing differs for water and ice surfaces. Thus it is possible that air is supersaturated, relative to ice crystals in clouds, but unsaturated for supercooled liquid cloud droplets. See 'Snow'. Saturation vapour pressure/temperature over ice/water Ambient temperature °C: 0 –10 –20 –30 –40 –60 SVP over water (hPa): 6.1 2.9 1.3 0.5 0.2 - SVP over ice (hPa): 6.1 2.6 1.0 0.4 0.1 0.01 The very low saturation partial pressures between –40 °C and –60 °C, corresponding to temperatures at the tropopause, indicate that only minute amounts of water vapour can pass through the tropopause into the stratosphere. Quantifying atmospheric humidity Specific humidity is the mass of water vapour per unit mass of the moist air in grams per kg. Humidity mixing ratio is the ratio of the mass of water vapour to the mass of dry air expressed as grams of vapour per kilogram of dry air. It is normally very close to specific humidity except in very humid air. Dry bulb temperature is the ambient or outside air temperature (OAT)— the heat content of the air. Wet bulb temperature is the lowest temperature to which the ambient air (flowing around a moistened thermometer bulb) can be cooled by the evaporation of water; see 'Evaporation and latent heat'. The greater the humidity, the lesser the evaporation — which ceases at 100% relative humidity, when the wet bulb temperature will equal the normal dry bulb temperature. If air at 100% relative humidity is cooled, dew point is reached and condensation starts to occur. The dry and wet bulb thermometers comprise a hygrometer; a hygroscope just indicates change in humidity. Relative humidity [RH] is the ratio of the amount of water vapour in a parcel of air to the amount that would be present at saturation point, at the same temperature, and is usually expressed as a percentage; i.e. actual density / saturation density x 100. RH can also be calculated as vapour partial pressure / saturation vapour pressure x 100. Thus from the preceding graph, a parcel of air at 25 °C and 20 hPa partial pressure would reach the saturation curve at 32 hPa partial pressure; therefore the existing relative humidity is 20 / 32 x 100 = 62%. The humidity level published in daily weather reports is the relative humidity. Note that if the temperature of an air parcel changes, then the RH changes. For example, if the amount of water vapour present remains constant, RH decreases when air temperature increases and vice versa. During the evening the temperature falls and the RH increases — if 100% RH is exceeded condensation (evening mist) appears. RH does not indicate the actual amount of vapour present, but in hot weather an increase in RH makes people feel hotter because of the decreased evaporation of perspiration; we rely on evaporative cooling for body temperature control in hot weather. The table below provides relative humidity if the dry bulb and wet bulb temperatures are known. Airfield altitude has a very slight effect in Australia as there are few airfields/airstrips with an elevation exceeding 4500 feet. Relative humidity table Dry bulb Difference between dry bulb and wet-bulb temperatures Relative humidity °C -1° -2° -3° -4° -5° -6° -7° -8° -9° -10° Rule of thumb value 95% 90% 85% 80% 75% 70% 65% 60% 55% 50% 20° 91% 83% 75% 67% 59% 52% 45% 38% 31% 26% 25° 92% 85% 77% 71% 64% 57% 51% 45% 39% 33% 30° 93% 86% 79% 73% 67% 61% 55% 50% 45% 40% 35° 93% 87% 81% 75% 69% 64% 59% 54% 49% 44% 40° 94% 88% 82% 77% 71% 66% 62% 57% 52% 48% 45° 94% 89% 83% 78% 73% 69% 64% 60% 55% 51% 2.1.5 Evaporation and latent heat The amount of moisture contained in the atmosphere at any one time is about 13 000 km³ of water and is equivalent to a world-wide precipitation of 25 mm. As the annual world-wide precipitation is about 850 mm, it follows that the atmospheric moisture is being replenished by evaporation about 35 times per year, or every 10 days or so. About 85% of the moisture evaporates from the oceans, the balance evaporating from fresh-water sources, moist earth and transpiration from plants. Vaporisation is the process of conversion of a substance from the liquid into the vapour state. Fusion is the conversion from solid to liquid state; e.g. snow crystals to rain. Molecules of water in a condensed state are held to one another by strong forces of attraction, which are balanced by equally strong repulsive forces. Tending to overcome the potential energy of attraction is the escaping tendency of molecules, arising from their kinetic energy. The kinetic energy, and thus the escaping tendency, is a function of absolute temperature. At each temperature a certain fraction of the molecules possesses enough kinetic energy to overcome the forces of attraction of the surrounding molecules and to escape from the surface of the water as vapour — whether that surface is an ocean or a cloud droplet. As the molecules that possess excessive kinetic energy (heat) evaporate from the liquid, the average kinetic energy of the remaining molecules decreases and the temperature drops. The heat energy carried away with the water vapour, about 2500 joules per gram of vapour, is the latent heat of vaporisation (this is the principle of the wet-bulb thermometer). Conversely, when water vapour condenses back into the liquid state, the latent heat of condensation is released into the surrounding air as sensible heat (that increases the air temperature) and has a significant effect on the saturated adiabatic lapse rate. Sensible heat is a function of air temperature while latent heat is a function of H2O changing its state, e.g. from liquid to gas. Ice melts at 0 °C and requires 330 joules per gram — the latent heat of fusion. If ice is converted directly to water vapour, at the same temperature, it takes about 2800 joules per gram — the latent heat of sublimation. Sublimation is also the process where water vapour is converted directly to ice; e.g. hoar frost forming on a chilled windscreen during take-off or carburettor icing. 2.1.6 Atmospheric and solid Earth tides In the low latitudes a semi-diurnal pressure variation is quite noticeable. Atmospheric pressure peaks at about 1000 hours and 2200 hours local solar time, with minima at 1600 and 0400. The semi-diurnal pressure variation at Cairns in tropical Australia is about 2 hPa either side of the mean; i.e the pressure might be 1015 hPa at 0400, 1019 hPa at 1000, 1015 hPa at 1600 and 1019 hPa at 2200. Meteorologists adjust the daily pressure observations to remove the tide effect. The atmospheric tide is associated with lunar and solar gravitation, solar heating, and resonance. The tide is not apparent in latitudes greater than 50°–60°. The atmospheric tide is an internal gravity wave with a 12-hour frequency. The semi-diurnal pressure variation is similar to the semi-diurnal gravity variations at the Earth's solid surface, the solid earth being subject to tides — the solid Earth tide — caused by lunar/solar gravitation. A point on the Earth's surface might move up and down by as much as 50 cm, with maximum gravitation occurring every 12 hours or so. The solid tide movement is something to be considered in future aircraft GNSS precision approach and landing systems. STRICT COPYRIGHT JOHN BRANDON AND RECREATIONAL FLYING (.com)
 -
 Trade Paperback + PDF eBook version: Trade paperback book comes with code to download the eBook from ASA's website. Weight and balance is an important aspect to the safety of flight. An overweight aircraft, or one whose center of gravity is outside the allowable limits, is inefficient and dangerous to fly. The responsibility for proper weight and balance control begins with the engineers and designers, and extends to the pilot and mechanic who flies and maintains the aircraft. This Federal Aviation Administration (FAA) publication addresses this safety-crucial topic and in studying this handbook, pilots and Aviation Maintenance Technicians (AMTs) will gain the necessary knowledge on the subject of aircraft weight and balance, in preparation for the FAA Knowledge Exam as well as safe flight and maintenance operations. Basic aircraft weight and balance control principles and procedures for the preparation, and the actual weighing of an aircraft start the discussion, including the methods of determining the location of the empty weight center of gravity. Loading computations with loading graphs and tables of weight and moment indexes follow, including instructions on determining the weight and center of gravity changes caused by repairs and alterations or removal and installation of equipment. Chapters are dedicated to light-sport aircraft, single-engine aircraft, multi-engine aircraft, and commuter and large aircraft, as well as helicopter weight and balance control and determining lateral CG. Also included are examples of solving weight and balance problems using a hand-held electronic calculator, E6-B flight computer, and a dedicated electronic flight computer. This 2016 Edition reflects the latest aviation industry procedures, equipment, techniques, regulations, and is a key reference in the FAA Airman Certification Standards (ACS). Illustrated throughout with detailed, full-color drawings, and includes a glossary and index. Available in the Downloads section right here on Recreational Flying
 -
Version FAA 8083-1B
37 downloads
FAA 8083-1B reprint contains helpful information on weight and balance for pilots, flight engineers, and aviation maintenance technicians (AMTs). Weight and balance is one of the most important factors affecting safety of flight. An overweight aircraft, or one whose center of gravity is outside the allowable limits, is inefficient and dangerous to fly. The responsibility for proper weight and balance control begins with the engineers and designers and extends to the pilot who operates and the aviation maintenance technician who maintains the aircraft. This book explains in detail the process to determine the weight and balance of any aircraft. This new edition, has been updated to include information on new Light Sport Aircraft (LSA) and Very Light Jet (VLJ) categories. Applicable to both airplanes and helicopters, this book is a primary reference for all FAA Knowledge Exams for both pilots and mechanics.Free -
I have spent the last couple of days getting the Resources, Tutorials and Aircraft sections all looking, in my opinion, absolutely incredible...these sections are looking cosmetically really appealing, easy to use and ready for an abundance of great material all making the site a comprehensive "resource" for all aviators. The Resources section has at this stage a full online working copy of an E6B and a comprehensive weather tool full of links to all the pertinent weather information you need The Tutorials section has had some great "How To Read" tutorials added covering NOTAMs, ARFOR, SIGNET, METAR and TAF The Aircraft section has had some extensive cosmetic changes to make this comprehensive resource a gold mine to use...a HUGE thanks from all of us must go to @red750 for tirelessly getting the Aircrat section populated and going for everyone. PLEASE, and as always, let me know what other Tutorials, Resources, Tools and Calculators etc that you would like to see added to these sections for you
-
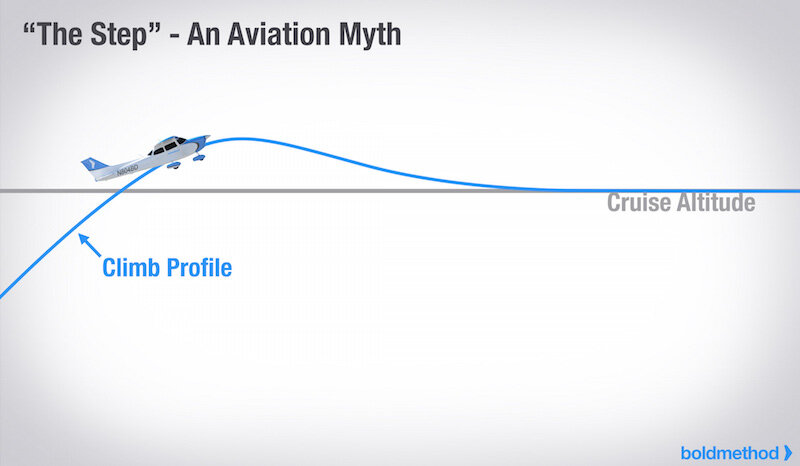 One of aviation’s endearing characteristics involves the abundant myths surrounding aircraft operation: Do this, that or some other thing and your airplane will carry more, fly faster on less fuel and land on a dime. Such myths are great hangar-flying fodder, but most of them fall down when confronted with the real world. One such myth involves “the step,” the mystical and mysterious airplane attitude that, when established only by virtue of a pilot’s superior skill and experience, allows a higher cruise speed. It can be second only to “lean of peak EGT will cook your engine” or “never spin a Tomahawk” as a solemn truism whispered from pilot to pilot. Similar aviation myths are handed down to less-experienced pilots like old headsets. And, like many myths, they may have some basis in fact. But a close examination and a quick demonstration flight can dispel many of them, and give you something else to talk about at your next hangar-flying session. So it is with “the step.” What is “the step,” anyway? A Good Attitude A definition of “the step” might be some specific airplane attitude allowing for the highest airspeed in level flight. Tradition has it that to “get on the step,” we maintain climb power through our target cruise altitude to, say, a couple hundred feet above it. Then, while still maintaining climb power, we gently push the nose over, slowly descending back to the target altitude. Once there, we set cruise power while the airplane maintains its slightly nose-low attitude, one supposedly minimizing drag and maximizing speed. We then sit back and enjoy the extra few knots, content in our superior airmanship as we motor past others not so enlightened or skillful. That’s the mythical “step.” While this procedure isn’t a bad one — it allows us to accelerate to cruising speed more quickly than might otherwise be the case — there’s no magic to it. And you can prove it on a quick test flight in, say, a Skyhawk. First, get on “the step” as described above. Use an intermediate altitude of, say, 5,500 feet msl. Set cruise power and adjust pitch trim for level flight. Engage altitude hold if so equipped. Wait 10 minutes and write down the indicated airspeed. Next, descend a couple thousand feet, say to 3,500, add climb power and level off at 5,500 as you reach it. Set cruise power and adjust pitch trim for level flight. Your airspeed initially will be lower than cruise, but it slowly will increase. Wait another 10 minutes. Again, write down the indicated airspeed. Presuming everything remains the same — aircraft weight, pitch trim, air density, power setting, etc. — the two airspeeds you’ve written down also will be the same. Myth Math I mentioned above that all good aviation myths may have some basis in fact, and “the step” doesn’t disappoint. Supposedly, the myth has its origins in flying’s earlier days — as with all good aviation stories — when airplanes were relatively underpowered and aerodynamically inefficient. Those early airplanes often had to cruise at an altitude near their service ceiling. Using a standard level-off technique, they’d stagger along in a slightly nose-high attitude and took a long time to accelerate to cruise speed, if they ever reached it at all. But by climbing above the desired altitude and then descending back to it, their crews could coax them to cruise speed more quickly. Thus was borne the myth of “the step.” It may also have something to do with seaplane operations, which were a solution when a large, smooth body of water offered a much longer “runway” than the land-based infrastructure of the day. With a seaplane, “getting on the step” refers to a balancing the airplane on a specific portion of the floats or hull, where hydrodynamic drag is minimized. Conveniently, there’s also Aerodynamics 101 to help us refute this myth. The increased drag from maintaining a nose-up attitude after a standard level-off retards acceleration to cruise speed. Deflecting the pitch control to maintain altitude at the lower speed slows us down even more. An airplane’s ability to accelerate to cruise speed involves additional math about the power available in excess of what’s required for level flight. The ideal for cruise flight would be zero-degree pitch-control deflection, minimizing drag and maximizing airspeed for a given power setting. That’s achievable, but requires paying some attention to the airplane’s centers of gravity and lift. More math. Less myth. Kung Fu Flying Recognizing all this, it makes perfect sense to climb slightly above a target altitude and then descend back to it while accelerating to cruise speed. But such a technique doesn’t expose some mystical, mythical aerodynamic kung fu built into your airplane, conjured only by your superior knowledge and skill. It’s just good airmanship. Some caveats apply, of course. For one, altitude deviations can be a serious matter, and it would be a very bad idea to exceed an expected or cleared altitude by 300 feet, especially when IFR. In everyday cross-country flying, climbing only 50 to 100 feet above a target cruise altitude should be more than enough when flown gently and the airplane is given time to accelerate. Altitude-hold capabilities greatly help us maintain maximum cruise speed when they’re available. At the end of the day, a given airplane’s ability to accelerate to its cruise speed after a traditional level-off depends greatly on available power. One with plenty of power available in excess of that required to maintain level flight, e.g., climb, obviously will accelerate more quickly. An airplane near its service ceiling may need some help. All a pilot is doing by descending an airplane back down to its cruise altitude — “getting on the step” — is providing some help. It’s as simple as that.
 -
 Aerodrome Forecast (TAF) A TAF is a coded statement of meteorological conditions expected at an aerodrome and within a radius of five nautical miles of the aerodrome reference point. Explanation of TAF Elements Identifier and Description TAF - Aerodrome Forecast TAF AMD - Amended Aerodrome Forecast TAF COR - Corrected Aerodrome Forecast TAF .. CNL - Cancels Aerodrome Forecast TAF .. NIL - Aerodrome Forecast will not be issued PROV TAF - Provisional Aerodrome Forecast Location The location is given by either an ICAO location indicator or an approved Airservices Australia abbreviation. Issue Time The issue time of the TAF is expressed in a six-figure group followed by the code letter Z, e.g. 202230Z, which gives an issue time of 2230 on the 20th day of the month UTC. Validity The period of validity is given in the format ddhh/ddhh, where dd is day of the month and hh is hour UTC, e.g. 2100/2206, which gives a 30 hour validity period from 0000 the 21st to 0600 on the 22nd UTC. Note that 00 is used to indicate periods of validity beginning at 0000 UTC; and 24 is used to indicate periods of validity ending at 2400 UTC. Wind The wind direction is given in degrees True, rounded to the nearest 10 degrees. A variable wind direction is given as VRB (used when the forecasting of a mean wind direction is not possible). The wind speed is given in knots (KT). The maximum wind gust is included, after the letter G, if it is expected to exceed the mean by 10 knots or more, e.g. a wind direction 280° True, with a mean speed of 20 knots, and a maximum gust of 30 knots, is given as 28020G30KT Visibility The horizontal visibility is given in metres in increments of 50 metres when visibility is forecast to be less than 800 metres; in increments of 100 metres when forecast to be 800 metres or more but less than 5,000 metres; and in increments of 1,000 metres when forecast to be 5,000 or more but less than 10,000 metres . Visibility is always given in a four figure group: eg 500 metres is given as 0500. Forecast visibilities of 10 kilometres or more are given as 9999. Visibility is not given when CAVOK is forecast. Weather Forecast weather is expressed using the following abbreviations: MI - shallow BC - patches PR - partial DR - drifting BL - blowing SH - showers FZ - freezing TS - thunderstorm DS - duststorm GS - small hail/snow pellets DZ - drizzle FG - fog RA - rain BR - mist GR - hail FU - smoke SN - snow HZ - haze SG - snow grains PO - dust devil DU - dust SQ - squall SA - sand FC - funnel cloud SS - sandstorm VA - volcanic ash IC - ice crystals PL - ice pellets Intensity is indicated for precipitation, blowing dust/sand/snow, duststorms and sandstorms. In these cases, the weather group is prefixed by - for light and + for heavy; moderate intensity has no prefix, e.g. +TSRA means thunderstorm with heavy rain; DZ means moderate drizzle; -RA means light rain. After a change group, if the weather ceases to be significant, the weather group is replaced by NSW (nil significant weather) or CAVOK if appropriate. Cloud Cloud information is given from the lowest to the highest layers in accordance with the following rule: 1st group: the lowest layer regardless of amount. 2nd group: the next layer covering more than 2 oktas. 3rd group: the next higher layer covering more than 4 oktas. Extra group for cumulonimbus and towering cumulus when forecast but not at any of the layer heights given above. Cloud amount is given using the following abbreviations: SKC - sky clear FEW - few (1 to 2 oktas) SCT - scattered (3 to 4 oktas) BKN - broken (5 to 7 oktas) OVC - overcast (8 oktas) NSC - nil significant cloud Cloud height is given as a three-figure group in hundreds of feet above the aerodrome, e.g. cloud at 700 feet above the aerodrome is shown as 007. Cloud type is identified only for cumulonimbus and towering cumulus, e.g. FEW030CB, SCT040TCU. CAVOK The abbreviation CAVOK (Ceiling and Visibility and weather OK) is used when the following conditions are forecast simultaneously: Visibility is 10 kilometres or more, No cloud below 5000 feet or the highest 25 nautical mile minimum sector altitude, whichever is the higher; and no cumulonimbus or towering cumulus at any height, No weather of significance to aviation, i.e. none of the weather listed in the weather table Significant Changes and Variations (FM, BECMG, INTER, TEMPO) Significant changes and variations will be included when the changes and variations are expected to satisfy the amendment criteria. It should be noted that these changes relate to improvements as well as deteriorations. The term FM is used when one set of prevailing weather conditions is expected to rapidly change to a different set of prevailing weather conditions. The indicator is the beginning of a self-contained forecast, with the new conditions applying until the end period of the forecast or until the commencement time of another FM or BECMG group. The term BECMG is used when one set of prevailing weather conditions is expected to gradually change to a different set of prevailing weather conditions. The indicator is the beginning of a self-contained forecast, with the new conditions applying until the end period of the forecast, or until the commencement time of another BECMG or FM group. Following any change group (FM or BECMG) there will be information on wind, visibility, weather and cloud; except when CAVOK is given or when fog is forecast. Following any change group (FM or BECMG) where there is nil significant weather forecast the abbreviation NSW is used. In some cases where the sky is forecast to be clear after a change group the abbreviation SKC is used. The terms TEMPO and INTER are used to indicate significant temporary or intermittent variations from the prevailing conditions previously given in the TAF. TEMPO is used for periods of 30 minutes or more but less than 60 minutes. INTER is used for periods less than 30 minutes. Change and variation groups (FM, BECMG, TEMPO, INTER) are not introduced until all information necessary to describe the initial forecast conditions of wind, visibility, weather and cloud have been given. Variation groups (TEMPO, INTER) follow at the end of all change groups (FM, BECMG) and before any PROB or TURB. PROB The term PROB[%] is used if the estimated probability of occurrence is 30 or 40 percent (probabilities of less than 30% are not given), and is only used with reference to thunderstorms or poor visibility (less than the alternate minimum) resulting from fog, mist, dust, smoke or sand. If the estimated probability of occurrence is greater than or equal to 50 percent, reference is made to the phenomenon in the forecast itself, not by the addition of a PROB. When using PROB with thunderstorms, INTER and TEMPO are also included whenever possible to indicate the probable duration. Where PROB is used without one of these, the likely period of occurrence will be deemed to be one hour or more. For example: PROB30 INTER 1205/1211 5000 -TSRA BKN040CB indicates a 30% probability of deteriorations of less than 30 minutes due to thunderstorms with light rain between 0500 and 1100 UTC on the 12th. PROB40 TEMPO 1102/1113 3000 TSRA BKN040CB indicates a 40% probability of deteriorations of 30 minutes or more but less than 60 minutes due to thunderstorms with moderate rain between 0200 and 1300 UTC on the 11th. PROB30 1005/1014 1000 +TSRA BKN040CB indicates a 30% probability of deteriorations of one hour or more due to thunderstorms with heavy rain between 0500 and 1400 UTC on the 10th. RMK RMK (remarks) precedes Turbulence (if forecast) and Temperatures and QNH Turbulence. Special reference is made in TAF to hazardous turbulence that may endanger aircraft or adversely affect their safe or economic operation. The TAF contains information on commencement time (FMddhhmm), the expected intensity (moderate [MOD] or severe [sEV]) and the vertical extent (BLW.... FT). TILLddhhmm is used to indicate the cessation of the turbulence when this is expected before the end of the TAF validity. Air Temperature Temperature, preceded by the letter T, is given in whole degrees celsius using two figures. If the temperature is below zero Celsius, the value is prefixed by the letter M (minus). In Australia, forecasts of air temperature are given at three-hourly intervals, for a maximum of nine hours, from the time of commencement of validity of the forecast. They are given for the times HH, HH+3, HH+6 and HH+9, where HH is the time of the commencement of the TAF validity. They are point forecasts for these times but are valid for, in the case of the first value, ninety minutes after the time point HH; and, for subsequent values, ninety minutes each side of the time point. QNH QNH, preceded by the letter Q, is given in whole hectopascals using four figures. In Australia, forecasts of QNH are given at three-hourly intervals, for a maximum of nine hours, from the time of commencement of validity of the forecast. They are given for the times HH, HH+3, HH+6 and HH+9, where HH is the time of the commencement of the TAF validity. They are point forecasts for these times but are valid for, in the case of the first value, ninety minutes after the time point HH; and, for subsequent values, ninety minutes each side of the time point. TAF Examples TAF YMAY 022230Z 0300/0312 35010KT CAVOK FM030800 31018KT 9999 SHRA BKN025 OVC100 INTER 0308/0312 31020G40KT 3000 +TSRA BKN010 SCT040CB RMK FM030600 MOD TURB BLW 5000FT T 23 24 28 33 Q 1012 1013 1014 1009 Decoded: TAF - Aerodrome Forecast YMAY - ICAO location indicator for Albury Airport 022230Z - TAF issued at 2230 on the 2nd day of the month UTC 0300/0312 - Validity period of TAF is from 0000 to 1200, on the 3rd day of the month UTC 35010KT - Wind will be from the north (350 degrees True) at 10 knots CAVOK - Cloud, visibility and weather ok FM030800 - Significant changes to the mean conditions are expected to commence from 0800 on the 3rd UTC, and to persist (at least) until the end of the forecast period Note that there will be intermittent variations to these new mean conditions (refer INTER below) 31018KT - Wind will be from the northwest (310 degrees True) at 18 knots 9999 - Visibility will be 10 kilometres or more SHRA - Weather will be moderate showers of rain BKN025 - Cloud will be broken (5 to 7 oktas) with base at 2500 feet above the aerodrome OVC100 - There will also be overcast cloud (8 oktas) with base at 10000 feet INTER 0308/0312 - There will be intermittent (periods of less than 30 minutes) variations to the previously given mean conditions. Period of INTER is 0800 to 1200 on the 3rd UTC 31020G40KT - Intermittently the wind will be from the northwest (310 degrees True) at 20 knots gusting to 40 knots 3000 - Visibility will be 3000 metres +TSRA - Weather will be thunderstorms with heavy rain BKN010 - Cloud will be broken (5 to 7 oktas) with base at 1000 feet above the aerodrome SCT040CB - There will also be 3 to 4 oktas of cumulonimbus cloud with base at 4000 feet RMK - Remarks section follows FM030600 MOD TURB BLW 5000FT - From 0600 on the 3rd UTC, expect moderate turbulence below 5000 feet T 23 24 28 33 - Forecast air temperatures at 00, 03, 06 and 09 UTC are 23, 24, 28 and 33 Q 1012 1013 1014 1009 - Forecast QNH at 00, 03, 06 and 09 UTC are 1012, 1013, 1014 and 1009. TAF COR YMLT 212240Z 2200/2218 31015G28KT 6000 -RA BKN010 OVC100 TEMPO 2209/2218 2000 +TSRA BKN005 SCT040CB RMK T 25 21 18 15 Q 1014 1013 1013 1011 Decoded: TAF - Aerodrome Forecast COR - This TAF is a correction to the previously issued TAF YMLT - ICAO Location Indicator for Launceston Airport 212240Z - TAF issued at 2240 on the 21st day of the month UTC 2200/2218 - Validity period of TAF is from 0000 until 1800 on the 22nd of the month UTC 31015G28KT - Mean wind is expected to be from 310 degrees True at 15 knots with gusts to 28 knots 6000 - Visibility will be 6000 metres -RA - Weather will be light rain BKN010 - Cloud will be broken (5 - 7 octas), with base at 1000 feet above the aerodrome OVC100 - There will also be overcast cloud, with base at 10,000 feet above the aerodrome TEMPO 2209/2218 - There will be temporary variations (periods of 30 to 60 minutes), to the previously given mean conditions, during the period 0900 to 1800 on the 22nd. 2000 - Visibility will be 2000 metres +TSRA - Weather will be thunderstorms with heavy rain showers BKN005 - There will be broken (5 to 7 oktas) cloud with base at 800 feet above the aerodrome SCT040CB - There will also be scattered (3 to 4 oktas) cumulonmbus cloud with base at 2000 feet above the aerodrome RMK - Remarks section follows T 25 21 18 15 - Forecast air temperatures at 06, 09, 12 and 15 UTC are 25, 21, 18 and 15 Q 1014 1013 1013 1011 - Forecast QNH at 06, 09, 12 and 15 UTC are 1014, 1013, 1013 and 1011 TAF AMD YMML 292330Z 3000/3106 14008KT 9999 NSW SCT030 FM301100 14003KT 3000 HZ BKN009 PROB40 3017/3023 0400 FG RMK T 14 15 17 14 Q 1016 1014 1013 1014 Decoded: TAF - Aerodrome Forecast AMD - This TAF amends the previously issued TAF YMML - ICAO location indicator for Melbourne Airport 292230Z - TAF issued at 2230 on the 29th day of the month UTC 3000/3106 - Validity period of TAF is from 0000 on the 30th until 0600 on the 31st UTC 14008KT - Mean wind is expected to be from the southeast (150 degrees True) at 8 knots 9999 - Visibility will be 10 kilometres or more NSW - There will be nil significant weather SCT030 - Cloud will be scattered (3 to 4 oktas), with base at 3000 feet above the aerodrome FM301100 - Significant new mean conditions are expected from 1100 on the 30th UTC; 14003KT - Mean wind is expected to be from 150 degrees True at 3 knots 3000 - Visibility will be 3 kilometres HZ - Weather will be haze BKN009 - Cloud will be broken (5 to 7 oktas), with base at 900 feet above the aerodrome PROB40 3017/3023 - There is a 40% probability of conditions being the following during the period 1700 to 2300 on the 30th: 0400 - Visibility of 400 metres FG - Fog RMK - Remarks section follows T 14 15 17 14 - Forecast air temperatures at 00, 06, 09 and 12 UTC are 14, 15, 17 and 14 Q 1016 1014 1013 1014 - Forecast QNH at 00, 06, 09 and 12 UTC are 1016, 1014, 1013 and 1014
 -
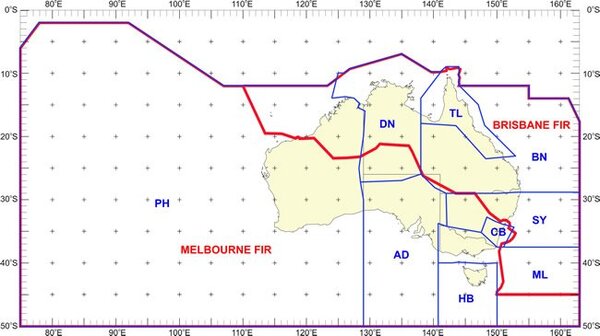 SIGMETs are issued to provide urgent advice to aircraft of actual or expected weather developments or trends that are potentially hazardous. SIGMETs are issued to advise of the occurrence or expected occurrence of the following phenomena: Code and Description OBSC TS - Obscured thunderstorm(s) EMBD TS - Frequent thunderstorm(s) SQL TS - Squall line thunderstorms OBSC TSGR - Obscured thunderstorm(s) with hail EMBD TSGR - Embedded thunderstorm(s) with hail FRQ TSGR - Frequent thunderstorm(s) with hail SQL TSGR - Squall line thunderstorms with hail TC - Tropical cyclone SEV TURB - Severe Turbulence SEV ICE - Severe icing SEV ICE FZRA - Severe icing due to freezing rain SEV MTW - Severe mountain wave HVY DS - Heavy duststorm HVY SS - Heavy sandstorm VA - Volcanic ash RDOACT CLD - Radioactive Cloud Pilots in command of aircraft encountering any of the above phenomena not notified by SIGMET advices must report details of the phenomena in an AIREP SPECIAL. SIGMET for thunderstorms are only issued when they are: obscured (OBSC) by haze or smoke embedded (EMBD) within cloud layers frequent (FRQ), i.e. with little or no separation between clouds and covering more than 75% of the area affected squall line (SQL) thunderstorms along a line of about 100 nautical miles or more in length, with little or no separation between clouds SIGMET for thunderstorms and tropical cyclones do not include reference to icing and turbulence as these are implied as occurring with thunderstorms and tropical cyclones. Responsibility for the issuance of SIGMET within Australian FIRs SIGMETs for volcanic ash are the responsibility of the Volcanic Ash Advisory Centre, Darwin. SIGMETs for tropical cyclones are the responsibility of the Tropical Cyclone Advisory Centres in Perth, Darwin and Brisbane. SIGMETs for turbulence and icing above FL185 are the responsibility of the Aviation Weather Centre, Melbourne. SIGMET for all other phenomenon are the responsibility of the Meteorological Watch Offices located in Perth, Darwin, Adelaide, Hobart, Melbourne, Sydney, Brisbane and Townsville. SIGMET Structure Bulletin Identification WCAU01 for SIGMET on tropical cyclones WVAU01 for SIGMET on volcanic ash cloud WSAU21 for SIGMET for other phenomena Originating Office (WMO Indicator) The World Meteorological Organisation (WMO) location indicators for Australian Meteorological Watch Offices are: APRM - Adelaide Regional Forecasting Centre APRF - Perth Regional Forecasting Centre ABRF - Brisbane Regional Forecasting Centre ASRF - Sydney Regional Forecasting Centre ADRM - Darwin Regional Forecasting Centre AMRF - Melbourne Regional Forecasting Centre AMHF - Hobart Regional Forecasting Centre ABTL - Townsville Meteorological Office AMMC - Melbourne Aviation Weather Centre Note: These differ from the ICAO indicators (beginning with Y) used elsewhere in the message. Issue Date/Time Issue date/time is given in UTC in the form DDHHMM, where DD is day of month, and HHMM is time in hours and minutes. Flight Information Region Gives the abbreviation for the FIR (YMMM or YBBB) in which the phenomenon is located. Identifier The message identifier is SIGMET. Daily Sequence Number The four-character sequence number consists of: a two-letter designator to indicate the general location of the event (as given in the two maps below), and a two-digit number, giving the sequence number of SIGMETs issued by the relevant office within the FIR (Brisbane or Melbourne) since 0000 UTC. The tropical cyclone and low-level SIGMET two-letter designators and their associated geographical extent are: The high-level (above FL185) icing and turbulence SIGMET two-letter designators and their general associated geographical extent are: Validity Period The validity period is given in the format DDHHMM/DDHHMM, where DD is the day of the month and HHMM is the time in hours and minutes UTC. Tropical cyclone and volcanic ash SIGMETs can have a validity of up to six hours. SIGMETs for other phenomena can be valid for up to four hours. Originating Office (ICAO Indicator) The International Civil Aviation Organization (ICAO) location indicators for Australian Meteorological Watch Offices are: YPRM - Adelaide Regional Forecasting Centre YPRF - Perth Regional Forecasting Centre YBRF - Brisbane Regional Forecasting Centre YSRF - Sydney Regional Forecasting Centre YPDM - Darwin Regional Forecasting Centre YMRF - Melbourne Regional Forecasting Centre YMHF - Hobart Regional Forecasting Centre YBTL - Townsville Meteorological Office YMMC - Melbourne Aviation Weather Centre Flight Information Region This gives the abbreviation and full name for the FIR in which the phenomenon is located. Meteorological Information This section includes: type of phenomenon observed or forecast location, both horizontal and vertical extents movement or expected movement expected change in intensity SIGMET for tropical cyclone and volcanic ash cloud include a forecast position for the end of the validity period message status Cancel SIGMET If during the validity period of a SIGMET, the phenomenon for which the SIGMET is no longer occurring or is no longer expected, the SIGMET is cancelled by issuing a SIGMET with the abbreviation CNL in lieu of meteorological information. SIGMET Status The status line indicates whether the SIGMET is: NEW - the SIGMET is for a new phenomenon. REV - the SIGMET reviews an earlier SIGMET for the phenomenon. CNL - cancels a current SIGMET. The following abbreviations are used in SIGMET: Code and Description A - Altitude ABV - Above APRX - Approximately BLW - Below CNL - Cancel DS - Dust storm EMBD - Embedded FIR - Flight Information Region FCST - Forecast FL - Flight level FRQ - Frequent FZRA - Freezing rain GR - Hail HVY - Heavy ICE - Icing INTSF - Intensifying LOC - Location MOV - Moving NC - No Change (intensity) OBS - Observed OBSC - Obscured RDOACT CLD - Radioactive cloud REV - Review SEV - Severe SQL - Squall line SS - Sand storm STNR - Stationary STS - Status TC - Tropical cyclone TS - Thunderstorm TURB - Turbulence VA - Volcanic ash WI - Within (area) WKN - Weakening (intensity) Z - Universal Time SIGMET Examples WSAU21 AMMC 180357 YMMM SIGMET MM01 VALID 180439/180839 YMMC- YMMM MELBOURNE FIR SEV TURB FCST WI S3200 E12800 - S3200 E13000 - S4700 E13600 - S4700 E13400 FL260/400 MOV E 25KT NC STS:NEW WSAU21 AMMC 180720 YMMM SIGMET MM02 VALID 180720/180839 YMMC- YMMM MELBOURNE FIR CNL SIGMET MM01 180439/180839 STS:CNL SIGMET MM01 180439/180839 WCAU01 APRF 180217 YMMM SIGMET PH01 VALID 180215/180815 YPRF- YMMM MELBOURNE FIR TC ILSA OBS AT 0000Z S1330 E11324 CB TOP FL500 WI 120NM OF CENTRE MOV WSW 17KT INTSF FCST 0815Z TC CENTRE S1418 E11036 STS:NEW WVAU01 ADRM 200100 YBBB SIGMET BT04 VALID 200100/200700 YPDM- YBBB BRISBANE FIR VA ERUPTION LOC S0416 E15212 VA CLD OBS AT 200100Z A100/180 APRX 120NM BY 40NM S1130 E14530 - S1330 E14900 - S1030 E15030 - S0830 E14700 - S1130 E14430 MOV SW 20KT FCST 0700Z VA CLD APRX S110 E144530 - S1230 E14930 - S1050 E15130 - S0800 E14700 - S1130 E14400 STS:REV SIGMET BT03 191900/200100
 -
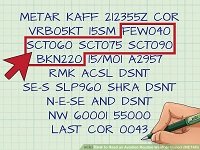 METAR/SPECI A METAR is a routine report of meteorological conditions at an aerodrome. A SPECI is a special report of meteorological conditions, issued when one or more elements meet specified criteria significant to aviation. SPECI is also used to identify reports of observations recorded ten minutes following an improvement (in visibility, weather or cloud) to above SPECI conditions. Location The location is indicated by either the ICAO (International Civil Aviation Organization) location indicator or another approved abbreviation. Date/Time The day of month and the time of the report is given in UTC (Coordinated Universal Time) using six figures followed by the letter Z. The first two digits are the day of the month; the following 4 digits are the time in hours and minutes, e.g. 291741Z (time of report is 1741 on the 29th of the month UTC). AUTO The abbreviation AUTO will be included when the report contains only automated observations. Surface Wind The wind direction is given in degrees true, rounded to the nearest 10 degrees. A variable wind direction is given as VRB. The wind speed, given in knots (KT), is the mean value over the sampling period which is normally ten minutes. The maximum wind speed during the sampling period is reported when it exceeds the mean speed by 10 knots or more. It is indicated by the letter G which is followed by the gust value, e.g. a wind direction of 280°, with a mean speed of 20 knots and a maximum gust of 31 knots, is given as 28020G31KT. Visibility The horizontal visibility is given in metres up to 9000 metres; with 9999 being used to indicate a visibility of 10 kilometres or greater. When the visibility is estimated manually (i.e. by an observer), two groups may be reported when the visibility is not the same in different directions. In these cases, the higher visibility will be given first, followed by the minimum visibility and its direction (using one of the eight points of the compass) from the observing station e.g. 9000 2000N. When visibility is given by an automated sensor (in fully AUTOmated reports), only one group is reported. The value is followed by the letters NDV (Nil Directional Variation) to indicate that, as there is only one visibility sensor in place, any directional variation in visibility that may exist cannot be detected. Weather Weather phenomena are reported using the codes listed in the tables: Code Weather Descriptor MI - Shallow BC - patches PR - partial DR - drifting BL - blowing SH - showers FZ - freezing TS - thunderstorm Code Weather Phenomena DZ - drizzle RA - rain GR - hail SN - snow SG - snow grains DU - dust SA - sand SS - sandstorm DS - dust storm GS - small hail/snow pellets PL - ice pellets FG - fog BR - mist FU - smoke HZ - haze PO - dust devil SQ - squall FC - funnel cloud VA - volcanic ash IC - ice crystals PL - ice pellets Intensity is indicated for precipitation, blowing dust/sand/snow, dust storm and sandstorm by appending: the prefix - for light, e.g. -DZ the prefix + for heavy, e.g. +RA no prefix for moderate, e.g. SHRA One or more codes may be grouped, e.g. +TSGR, -TSRASN NOTE When precipitation is reported with TS, the intensity indicator refers to the precipitation, e.g. -TSRA = thunderstorm with light rain. Well-developed dust/sand whirls (dust devils) and funnel clouds are reported using the indicator + An observation may provide an indication of weather in the vicinity of the aerodrome, i.e. between 8 and 16KM of the aerodrome reference point. In these cases, the weather code is prefixed with the abbreviation VC (vicinity), e.g. VCTS. Cloud Cloud information is reported from the lowest to the highest layers in accordance with the following rules: 1st group: the lowest layer regardless of amount. 2nd group: the next layer covering more than 2 oktas of the sky. 3rd group: the next higher layer covering more than 4 oktas of the sky. Extra groups: for cumulonimbus and/or towering cumulus clouds, whenever observed and not reported in any of the above. Cloud amount is described using the codes in the table: Code - Cloud Amount SKC - sky clear FEW - few (1 to 2 oktas) SCT - scattered (3 to 4 oktas) BKN - broken (5 to 7 oktas) OVC - overcast (8 oktas) NSC - nil significant cloud NCD* - nil cloud detected * NCD is reported (in fully automated reports only) when a cloud sensor detects nil cloud (a human observer will report SKC when the sky is clear. Cloud height is given as a three-figure group in hundreds of feet above the aerodrome elevation, e.g. cloud at 700 feet is shown as 007. Cloud type is identified only for cumulonimbus and towering cumulus, e.g. FEW030CB, SCT045TCU. When an individual layer is composed of cumulonimbus and towering cumulus with a common base, the cloud is reported as CB only. If the sky is obscured, due to, for example, bushfire smoke, human observers will report the vertical visibility (when it can be estimated) in lieu of cloud. It is reported with the prefix VV followed by the vertical visibility in hundreds of feet, e.g. the group VV003 reports an estimated vertical visibility of between 300 and 399 feet (values are rounded down to the next hundred foot increment). CAVOK The abbreviation CAVOK (Cloud and Visibility OK) is used when the following conditions are observed simultaneously: Visibility is 10 kilometres or more; No cloud below 5000 feet or below the highest 25NM minimum sector altitude, whichever is the higher, and no cumulonimbus and no towering cumulus; and No weather of significance to aviation, i.e. none of the weather phenomena listed in the weather tables above. Temperature Air temperature and dew point values are rounded to the nearest whole degree. Negative values are indicated by M (minus) before the numeral, e.g. 34/M04 Pressure (QNH) The QNH value is rounded down to the next whole hectopascal and is given using four figures prefixed by Q, e.g. 999.9 is given as Q0999 Supplementary Information Supplementary information is used to report: Recent Weather - significant weather observed since the last report but not at the time of observation is given after the prefix RE, e.g. RERA. Wind Shear - reports of wind shear experienced on take-off or landing are given after the indicator WS, e.g. WS RWY16. Remarks The Remarks section (indicated by RMK) may contain the following: Quantitative information on past rainfall is given in millimetres in the form RFRR.R/RRR.R or RFRR.R/RRR.R/RRR.R. The former, e.g. RF00.2/004.2, gives the rainfall recorded in the ten minutes prior to the observation time, followed by the rainfall recorded in the period since 0900 local time. The second format, e.g. RF00.2/003.0/004.2, gives the rainfall recorded in the ten minutes prior to the observation, followed by the rainfall in the sixty minutes prior to the observation, followed by the rainfall recorded in the period since 0900 local time. Information of operational significance not reported in the body of the message, for example: information about significant conditions (such as bushfires and distant thunderstorms) beyond the immediate vicinity of the aerodrome, any BKN or OVC low or middle cloud present at or above 5000 feet when CAVOK has been included in the body of the message, CLD:SKY MAY BE OBSC may be reported in fully automated reports when the ceilometer (cloud sensor) detects nil cloud and the visibility sensor estimates horizontal visibility as being less than 1000 metres Elements of report not available Where an element of a report is not available, solidi will be reported in lieu of the missing element, e.g. //// for visibility, // for weather and ////// for cloud. SPECI Criteria SPECI is used to identify reports of observations when conditions are below specified levels of visibility and cloud base; when certain weather phenomena are present; and when temperature, pressure or wind change by defined amounts (outlined in the table on the right). SPECI is also used to identify reports of observations recorded 10 minutes following an improvement in visibility, weather or cloud to METAR conditions. Element And Criterion Wind Direction - Changes of 30° or more, the mean speed before or after the change being 20KT or more Wind Speed - Changes of 10KT or more, the mean speed before or after the change being 30KT or more Wind Gust Gusts of 10KT or more above a mean speed of 15KT or more Gust exceeds the last reported gust by 10KT or more Visibility - When the horizontal visibility is below the aerodrome’s highest alternate minimum visibility* Weather - When any of the following begins, ends or changes in intensity: thunderstorm hailstorm mixed snow and rain freezing precipitation drifting snow fog (including shallow fog, fog patches and fog at a distance) dust storm sand storm squall funnel cloud moderate or heavy precipitation Cloud - When there is BKN or OVC cloud below the aerodrome's highest alternate minimum cloud base* Temperature - When the temperature changes by 5°C or more since last report Pressure - When the QNH changes by 2hPa or more since last report Other Upon receipt of advice of the existence of wind shear The incidence of any other phenomenon likely to be significant *Where no descent procedure is established for an aerodrome, the aerodrome’s alternate ceiling and visibility are 1500 feet and 8 kilometres respectively. METAR/SPECI Examples METAR YPPH 221130Z 28012G23KT 9000 -SHRA FEW005 BKN050 27/22 Q0999 RETS RMK RF00.6/003.4 DISTANT TS REPORT EXPLANATION METAR Routine meteorological observation YPPH ICAO location indicator for Perth Airport 221130Z Time of observation is 1130 on the 22nd of the month UTC 28012G23KT Wind from the west (280 degrees True) at 12 knots; gusting to 23 knots 9000 Visibility is 9 kilometres. -SHRA Present weather is light rain shower FEW005 There are 1 to 2 oktas of cloud with base at 500 feet BKN050 There are also 5 to 7 oktas of cloud with base at 5000 feet 27/22 The air temperature is 27°C; the dewpoint temperature is 22°C Q0999 The QNH is between 999 and 999.9 hectopascals RETS Recent weather was a thunderstorm RMK Remarks section follows RF00.6/003.4 0.6 mm of rain has fallen in the last 10 minutes; 3.4 mm has fallen since 0900 local time DISTANT TS Distant thunderstorm (greater than 16 kilometres from the aerodrome reference point) SPECI YSCB 171515Z AUTO 22015G25KT 9000NDV // NCD 13/09 Q1003 RMK RF00.8/003.0 REPORT EXPLANATION SPECI Special meteorological observation (for wind gust) YSCB ICAO location indicator for Canberra Airport 171515Z Time of observation is 1515 on the 17th of the month UTC AUTO This report is fully automated 22015G25KT Wind from the southwest (220 degrees True) at 15 knots, gusting to 25 knots 9000NDV Visibility is 9000 metres; from a single visibility sensor, therefore no directional variation (NDV) in visibility can be detected // Present weather is unavailable NCD Nil cloud has been detected (by ceilometer) 13/09 The air temperature is 13°C; the dewpoint temperature is 09°C OVC110 There are also 8 oktas of cloud with base at 11 000 feet Q1003 The QNH is between 1003 and 1003.9 hectopascals RMK Remarks section follows RF00.8/003.0 0.8 mm of rain has fallen in the last 10 minutes; 3.0 mm has fallen since 0900 local time
 -
 Area Forecasts For Operations At or Below 10,000 Feet The Area Forecast system is designed primarily to meet the needs of pilots of general aviation. There is an emphasis on plain language and brevity in a simple, easy to read format. The system provides for the routine issue of forecasts for designated areas (see map below) and the prompt issue of amendments when prescribed criteria are satisfied. More detail of the area forecast boundaries with place locations is contained in Airservices Australia's Planning Chart Australia (PCA). There may be variations in commencement of validity between different regions, and between those times when daylight saving is or is not operating. However the following principles apply: the standard validity period is twelve hours but this may vary from state to state. an area forecast covering daylight hours will be available as soon as practicable in the morning. area forecasts are not prepared for those times when air traffic volume is so low as not to justify routine issues. In these cases a route forecast will service any individual flights. area forecasts will generally be available a minimum of one hour before commencement of validity. Message Structure Message Identifier The forecast is identified as AREA FORECAST unless the forecast is an amendment in which case it will be denoted AMEND AREA FORECAST. In the case of amended area forecasts, all individual sections that are amended will be annotated with AMD preceding the section heading. Validity Period The validity period is written DDHHMM TO DDHHMM, where DD is the day of the month and HHMM is the time in hours and minutes UTC. Area Number The relevant forecast area is specified by an area forecast district number. These are given in more detail on the current Airservices Australia's Planning Chart Australia. Note that Areas 24, 87 and 88 are only designated for the purpose of Area QNH. Any flights in these areas can be provided with a route forecast. Overview The overview will highlight any conditions which may inhibit safe operations for pilots flying under visual flight rules, and will make reference, where necessary, to any spatial and temporal variations. It will assist the pilot in making the following types of decisions: Are the meteorological conditions Visual Meteorological Conditions (VMC), marginal, Instrument Flight Rules (IFR) or too poor for flying? Is it better to plan for a coastal or inland track? If bad weather is encountered, what is the contingency plan? Return? Change altitude? Change heading? Land immediately? Subdivisions Area forecasts may be divided into spatial, temporal or weather-related subdivisions. Spation subdivisions are given using PCA (Planning Chart Australia) or lat/lon coordinates Winds and Temperatures Upper level winds are given for 2000 (or 3000 in elevated regions), 5000, 7000, 10 000, 14 000 and 18 500 feet. The expected mean wind direction is given in three figures to the nearest ten degrees True, followed by a solidus (/), followed by the mean wind speed in two figures to the nearest five knots, 290/40. CALM and VRB05 (wind direction variable at 5 knots) are used when appropriate. A REMARKS section may be included below the WIND section to provide further information on winds. Upper level temperatures are given for 10 000, 14 000 and 18 500 feet. These are given in whole degrees Celsius, following the forecast of the upper wind for the level concerned. e.g. 290/40 PS08, 300/50 ZERO, 360/10 MS10. The abbreviation PS is used for positive temperatures, and MS (minus) is used for negative temperatures. Cloud The inclusion of cloud is restricted to: any CB or TCU. any cloud with a base at or below 5000 feet above the highest terrain in the area covered by the forecast. any cloud layer of more than 4/8 (broken or overcast) amount with base at or below 20 000 feet above MSL. any cloud associated with any forecast precipitation, moderate or severe icing and moderate or severe turbulence. Cloud amount is given using the following abbreviations: FEW - Few (1 to 2 oktas) SCT - Scattered (3 to 4 oktas) BKN - Broken (5 to 7 oktas) OVC - Overcast (8 oktas) ...except for cumulonimbus and towering cumulus, for which amount is described as: ISOL - Isolated OCNL - Occasional (well separated) FRQ - Frequent (little or no separation) EMBD - Embedded (in layers of other cloud) Cloud type is given using the following abbreviations: CU - Cumulus SC - Stratocumulus CB - Cumulonimbus TCU - Towering cumulus ST - Stratus AS - Altostratus AC - Altocumulus NS - Nimbostratus If subdivisions are used and one or more subdivisions have no cloud associated with it, the format used is NIL CLOUD. When CU and SC, or AC and AS, occur together at similar heights, they are combined, i.e. CU/SC or AC/AS. Cloud base and tops are given in feet above MSL (mean sea level). Weather Weather information relating to the layer below 21 000 feet above MSL is given following the word 'WEATHER'. If subdivisions are used and one or more subdivisions have no weather associated with it the format is, WEATHER A: NIL. Visibility Horizontal visibility is given in metres to the nearest 100 metres up to and including 5000 metres, and in whole kilometres above that value. Forecast visibilities of 50 metres or less are given as 'ZERO'. The forecast value is followed by the units used e.g. '8KM' or '1000M'. Significant variations of visibility are included. If the visibility is forecast to be above 10 kilometres throughout the area, the words 'UNRESTRICTED' or 'GOOD' are used. Vertical variations of horizontal visibility, which might prevent flight under VMC conditions, are significant. For example, information is supplied on the depth of layers affected by drizzle, haze and dust storms, and the levels of haze layers under inversions. Visibility variations with these phenomena is given. Freezing Level Freezing level is the height, in feet, above MSL of zero degrees Celsius. Reference is made to any variations in height greater than 1000 feet, and to the occurrence of more than one freezing level. Icing The icing section gives information on the expected occurrence of moderate or severe icing in cloud (including convective cloud), or precipitation, in the layer below 20 000 feet above MSL. The height above MSL of the bottom and top of the layer is given as, for example, MOD IN RA 5000/8000. When the layer of icing is expected to extend above 20 000 feet, descriptions such as MOD ABOVE 14000 are used. Turbulence This section provides information on moderate or severe turbulence including turbulence associated with convective cloud. The height above MSL of the bottom and top of any layer(s) is given as, for example, MOD IN CLOUD 12000/16000 When the turbulence is expected to extend to ground level, descriptions such as BELOW 8000 are used. When the turbulence is expected to be confined to clouds, descriptions such as MOD IN CLOUD BELOW 8000 are used. When the turbulence is expected to extend above 20 000 feet, descriptions such as SEV ABOVE 15000 are used. Critical Locations These are locations such as gaps in mountain ranges which are frequently used by general aviation aircraft. Currently, critical location forecasts are appended to Area Forecasts for Bowral and Mt Victoria (NSW) on AREA 21; Mt Victoria and Murrurundi (NSW) on AREA 20; and Kilmore Gap (Vic) on AREA 30. Critical location forecasts are written in a mixture of plain language and TAF format making reference as necessary to cloud, visibility and weather. CAVOK is used to indicate visibility greater than 10 KM, cloud ceiling above 5000 FT above ground level and nil significant weather. Remarks This section will include any relevant information not included elsewhere in the forecast. Abbreviations and Codes Used in Area Forecasts AC - Altocumulus AC/AS - Altocumulus and Altostratus with bases at the same level AS - Altostratus AMD - Amendment BKN - Broken CAVOK - Cloud and visibility and weather ok. CB - Cumulonimbus CU - Cumulus CU/SC - Cumulus and Stratocumulus with bases at the same level DZ - Drizzle EMBD - Embedded FEW - Few FG - Fog FM - From (only used in Critical Locations section) FRQ - Frequent GR - Hail GS - Small Hail INTER - Intermittent variations (only used in Critical section Locations) ISOL - Isolated MOD - Moderate NS - Nimbostratus OCNL - Occasional OVC - Overcast RA - Rain SC - Stratocumulus SCT - Scattered SEV - Severe SH - Shower SN - Snow ST - Stratus TCU - Towering Cumulus TEMPO - Temporary variations (only used in Critical Locations section) TS - Thunderstorm Z - Code for UTC (universal time) Example
 -
 Birth of a NOTAM NOTAM (Notice To Airmen) starts life as messages on the Aeronautical Fixed System (AFS). They are received centrally from originators within your country and from foreign NOTAM offices. Staff check and edit the NOTAM if necessary and they are then placed in the transmit queue for transmission to all NOTAM recipients. These include ATC offices, some airlines, briefing services etc. There is no central world-wide NOTAM database, databases are built up individually by users from the incoming message stream. ICAO NOTAM format The format of NOTAM is defined in Annex 15 to the International Convention on Civil Aviation. An explanation of the format can be found here. Here is a typical NOTAM and its decode. A1484/02 NOTAMN Q) EGTT/QMRXX/IV/NBO/A/000/999/5129N00028W005 A) EGLL B) 0208231540 C) 0210310500 EST E) RWY 09R/27L DUE WIP NO CENTRELINE, TDZ OR SALS LIGHTING AVBL Notam Decoder A1484/02 - one letter to indicate the Series, a 4-digit NOTAM number followed by a stroke and two digits to indicate the year. NOTAMN - Suffix N Indicates this is a new NOTAM. Other options are R for NOTAM replacing another or C for one cancelling another. Q) EGTT/QMRXX/IV/NBO/A/000/999/5129N00028W005 This is the "Q" or qualifier line, it always starts Q) and contains the following fields, each separated by a stroke. FIR (here EGTT, London FIR) NOTAM Code, a 5 letter code starting with Q, defined in Annexe 15. Here QMR indicates that it concerns a Runway. XX indicates that remaining detail is in Plain Language. In this particular case the text shows that certain runway lighting is unavailable. Strictly speaking under ICAO rules this should have appeared as separate NOTAM for each type of lighting. QLCAS is the code for centreline lighting u/s QLZAS is the code for Touch Down Zone lighting u/s and QLAAS is the code for Approach Lighting u/s (note in all cases AS indicates unserviceable). The use of QMRXX here is a sensible compromise that reduces the number of NOTAM from three to one. A full list of codes is included in ICAO document 8126 (Aeronautical Information Services Manual). IV - Indicates that this is significant for IFR and VFR traffic NBO - indicates for immediate attention of aircraft operators, for inclusion in PIB's and Operationally significant for IFR flights A - Indicates scope, here Aerodrome, others are E (en-route) or W (nav warning) 000/999 - lower and upper limits expressed as a flight level. In this case it has been left as the default as it is not applicable. 5129N00028W005 - Indicates the geographical centre and radius of influence, always this number of digits. In this case the radius is 5 n.m. A) EGLL - ICAO indicator of the aerodrome or FIR (London Heathrow) can include more than one FIR B) 0208231540 - Date/time group (UTC) when this NOTAM becomes effective C) 0210310500 EST - Date/time group (UTC) when the NOTAM ceases to be effective. Note "EST" means "estimated" (NOT Eastern Standard Time!). All NOTAM with EST remain in force until cancelled or replaced. E) RWY 09R/27L DUE WIP NO CENTRELINE, TDZ OR SALS LIGHTING AVBL - text of the notam using ICAO abbreviations. Decode of this is "Runway 09/27 due to work in progress no centreline, touchdown zone or simple approach lighting system available" Here's the whole thing again A1484/02 NOTAMN Q) EGTT/QMRXX/IV/NBO/A/000/999/5129N00028W005 A) EGLL B) 0208231540 C) 0210310500 EST E) RWY 09R/27L DUE WIP NO CENTRELINE, TDZ OR SALS LIGHTING AVBL and here's the same thing as it appears in the PIB produced by ANAIS AGA : FROM 02/08/23 15:40 TO 02/10/31 05:00 EST A1484/02 E)RWY 09R/27L DUE WIP NO CENTRELINE, TDZ OR SALS LIGHTING AVBL You can see that the Q line is omitted entirely, A) has been stripped out because it appears as the header to the section and B) and C) have been reformatted and placed in the first line. AGA has been derived from the Q Code "QMR" (see Annex 15) INTERNATIONAL NOTAM (Q) CODES This appendix is to be used to interpret the contents of coded international NOTAM's. A NOTAM code group contains five letters. The first letter is always the letter "Q'' to indicate a code abbreviation for use in the composition of NOTAM's. The second and third letters identify the subject being reported. (See Second and Third Letter Decode Tables). The fourth and fifth letters identify the status of operation of the subject being reported. (See Fourth and Fifth Letter Decode Tables). THE NOTAM CODE DECODE SECOND AND THIRD LETTERS AGA Lighting Facilities (L) Code Signification Uniform Abbreviated Phraseology LA Approach lighting system (specify runway and type) apch lgt LB Aerodrome beacon abn LC Runway center line lights (specify runway) rwy centreline lgt LD Landing direction indicator lights ldi lgt LE Runway edge lights (specify runway) rwy edge lgt LF Sequenced flashing lights (specify runway) sequenced flg lgt LH High intensity runway lights (specify runway) high intst rwy lgt LI Runway end identifier lights (specify runway) rwy end id lgt LJ Runway alignment indicator lights (specify runway) rwy alignment indicator lgt LK Category II components of approach lighting system (specify runway) category II components apch lgt LL Low intensity runway lights (specify runway) low intst rwy lgt LM Medium intensity runway lights (specify runway) medium intst rwy lgt LP Precision approach path indicator (PAPI) (specify runway) papi LR All landing area lighting facilities ldg area lgt fac LS Stopway lights (specify runway) swy lgt LT Threshold lights (specify runway) thr lgt LV Visual approach slope indicator system (specify type and runway) vasis LW Heliport lighting heliport lgt LX Taxiway centre line lights (specify taxiway) twy centreline lgt LY Taxiway edge lights (specify taxiway) twy edge lgt LZ Runway touchdown zone lights (specify runway) rwy tdz lgt THE NOTAM CODE DECODE SECOND AND THIRD LETTERS AGA Movement and Landing Area (M) Code Signification Uniform Abbreviated Phraseology MA Movement area mov area MB Bearing strength (specify part of landing area or movement area) bearing strength MC Clearway (specify runway) cwy MD Declared distances (specify runway) declared dist MG Taxiing guidance system tax guidance system MH Runway arresting gear (specify runway) rwy arst gear MK Parking area prkg area MM Daylight markings (specify threshold, centre line, etc.) day markings MN Apron apron MP Aircraft stands (specify) acft stand MR Runway (specify runway) rwy MS Stopway (specify runway) swy MT Threshold (specify runway) thr MU Runway turning bay (specify runway) rwy turning bay MW Strip (specify runway) strip MX Taxiway(s) (specify) twy THE NOTAM CODE DECODE SECOND AND THIRD LETTERS AGA Facilities and Services (F) Code Signification Uniform Abbreviated Phraseology FA Aerodrome ad FB Braking action measurement equipment (specify type) ba measurement eqpt FC Ceiling measurement equipment ceiling measurement eqpt FD Docking system (specify AGNIS, BOLDS, etc.) dckg system FF Fire fighting and rescue fire and rescue FG Ground movement control gnd mov ctl FH Helicopter alighting area/platform hel alighting area FL Landing direction indicator ldi FM Meteorological service (specify type) met FO Fog dispersal system fog dispersal FP Heliport heliport FS Snow removal equipment snow removal eqpt FT Transmissometer (specify runway and, where applicable, designator(s) of transmissometer(s)) transmissometer FU Fuel availability fuel avbl FW Wind direction indicator wdi FZ Customs cust THE NOTAM CODE DECODE SECOND AND THIRD LETTERS COM Communications and Radar Facilities (C) Code Signification Uniform Abbreviated Phraseology CA Air/ground (specify service and frequency) a/g fac CE En route surveillance radar rsr CG Ground controlled approach system (GCA) gca CL Selective calling system (SELCAL) selcal CM Surface movement radar smr CP Precision approach radar (PAR) (specify runway) par CR Surveillance radar element of precision approach radar system (specify wavelength) sre CS Secondary surveillance radar (SSR) ssr CT Terminal area surveillance radar (TAR) tar THE NOTAM CODE DECODE SECOND AND THIRD LETTERS COM Instrument and Microwave Landing System (I) Code Signification Uniform Abbreviated Phraseology ID DME associated with ILS ils dme IG Glide path (ILS) (specify runway) ils gp II Inner marker (ILS) (specify runway) ils im IL Localizer (ILS) (specify runway) ils liz IM Middle marker (ILS) (specify runway) ils mm IO Outer marker (ILS) (specify runway) ils om IS ILS Category I (specify runway) ils I IT ILS Category II (specify runway) ils II IU ILS Category III (specify runway) ils III IW Microwave landing system (MLS) (specify runway) mls IX Locator, outer (ILS) (specify runway) ils lo IY Locator, middle (ILS) (specify runway) ils lm THE NOTAM CODE DECODE SECOND AND THIRD LETTERS COM Terminal and En Route Navigation Facilities (N) Code Signification Uniform Abbreviated Phraseology NA All radio navigation facilities (except...) all rdo nav fac NB Nondirectional radio beacon ndb NC DECCA decca ND Distance measuring equipment (DME) dme NF Fan marker fan mkr NL Locator (specify identification) l NM VOR/DME vor/dme NN TACAN tacan NO OMEGA omega NT VORTAC vortac NV VOR vor NX Direction finding station (specify type and frequency) df THE NOTAM CODE DECODE SECOND AND THIRD LETTERS RAC Airspace Organization (A) Code Signification Uniform Abbreviated Phraseology AA Minimum altitude (specify en route/crossing/safe) mnm alt AC Class B, C, D, or E Surface Area ctr AD Air defense identification zone (ADIZ) adiz AE Control area (CTA) cta AF Flight information region (FIR) fir AH Upper control area (UTA) uta AL Minimum usable flight level mnm usable fl AN Area navigation route rnav route AO Oceanic control area (OCA) oca AP Reporting point (specify name or Coded designator) rep AR ATS route (specify) ats route AT Class B Airspace tma AU Upper flight information region (UIR) uir AV Upper advisory area (UDA) uda AX Intersection (INT) int AZ Aerodrome traffic zone (ATZ) atz THE NOTAM CODE DECODE SECOND AND THIRD LETTERS RAC Air Traffic and VOLMET Services (S) Code Signification Uniform Abbreviated Phraseology SA Automatic terminal information service (ATIS) atis SB ATS reporting office aro SC Area control centre (ACC) acc SE Flight information service (FIS) fis SF Aerodrome flight information service (AFIS) afis SL Flow control centre flow ctl centre SO Oceanic area control centre (OAC) oac SP Approach control service (APP) app SS Flight service station (FSS) fss ST Aerodrome control tower (TWR) twr SU Upper area control centre (UAC) uac SV VOLMET broadcast volmet SY Upper advisory service (specify) advisory ser THE NOTAM CODE DECODE SECOND AND THIRD LETTERS RAC Air Traffic Procedures (P) Code Signification Uniform Abbreviated Phraseology PA Standard instrument arrival (STAR) (specify route designator) star PB Standard VFR arrival std vfr arr PC Contingency procedures contingency proc PD Standard instrument departure (SID) (specify route designator) sid PE Standard VFR departure std vfr dep PF Flow control procedure flow ctl proc PH Holding procedure hldg proc PI Instrument approach procedure (specify type and runway) inst apch proc PL Obstacle clearance limit (specify procedure) ocl PK VFR approach procedure vfr apch proc PM Aerodrome operating minima (specify procedure and amended minimum) opr minima PN Noise operating restrictions noise opr restrictions PO Obstacle clearance altitude oca PP Obstacle clearance height och PR Radio failure procedure radio failure proc PT Transition altitude transition alt PU Missed approach procedure (specify runway) missed apch proc PX Minimum holding altitude (specify fix) mnm hldg alt PZ ADIZ procedure adiz proc THE NOTAM CODE DECODE SECOND AND THIRD LETTERS Navigation Warnings: Airspace Restrictions (R) Code Signification Uniform Abbreviated Phraseology RA Airspace reservation (specify) airspace reservation RD Danger area (specify national prefix and number) ..d.. RO Overflying of ... (specify) overflying RP Prohibited area (specify national prefix and number) ..p.. RR Restricted area (specify national prefix and number) ..r.. RT Temporary restricted area tempo restricted THE NOTAM CODE DECODE SECOND AND THIRD LETTERS Navigation Warnings: Warnings (W) Code Signification Uniform Abbreviated Phraseology WA Air display air display WB Aerobatics aerobatics WC Captive balloon or kite captive balloon or kite WD Demolition of explosives demolition of explosives WE Exercises (specify) exer WF Air refueling air refueling WG Glider flying glider flying WJ Banner/target towing banner/target towing WL Ascent of free balloon ascent of free balloon WM Missile, gun or rocket firing frng WP Parachute jumping exercise (PJE) pje WS Burning or blowing gas burning or blowing gas WT Mass movement of aircraft mass mov of acft WV Formation flight formation flt WZ model flying model flying THE NOTAM CODE DECODE SECOND AND THIRD LETTERS Other Information (O) Code Signification Uniform Abbreviated Phraseology OA Aeronautical information service ais OB Obstacle (specify details) obst OE Aircraft entry requirements acft entry rqmnts OL Obstacle lights on ... (specify) obst lgt OR Rescue coordination centre rcc THE NOTAM CODE DECODE FOURTH AND FIFTH LETTERS Availability (A) Code Signification Uniform Abbreviated Phraseology AC Withdrawn for maintenance withdrawn maint AD Available for daylight operation avbl day ops AF Flight checked and found reliable fltck okay AG Operating but ground checked only, awaiting flight check opr awaiting fltck AH Hours of service are now hr ser AK Resumed normal operations okay AM Military operations only mil ops only AN Available for night operation avbl night ops AO Operational opr AP Available, prior permission required avbl ppr AR Available on request avbl o/r AS Unserviceable u/s AU Not available (specify reason if appropriate) not avbl AW Completely withdrawn withdrawn AX Previously promulgated shutdown has been cancelled promulgated shutdown cnl THE NOTAM CODE DECODE FOURTH AND FIFTH LETTERS Changes (C) Code Signification Uniform Abbreviated Phraseology CA Activated act CC Completed cmpl CD Deactivated deactivated CE Erected erected CF Operating frequency(ies) changed to freq change CG Downgraded to downgraded to CH Changed changed CI Identification or radio call sign changed to ident change CL Realigned realigned CM Displaced displaced CO Operating opr CP Operating on reduced power opr reduced pwr CR Temporarily replaced by tempo rplcd by CS Installed installed CT On test, do not use on test, do not use THE NOTAM CODE DECODE FOURTH AND FIFTH LETTERS Hazard Conditions (H) Code Signification Uniform Abbreviated Phraseology HA Braking action is ... ba is 1)Poor 2)Medium/Poor 3)Medium 4)Medium/Good 5)Good HB Braking coefficient is ... (specify measurement device used) brkg coefficient is HC Covered by compacted snow to depth of cov compacted snow depth HD Covered by dry snow to a depth of cov dry snow depth HE Covered by water to a depth of cov water depth HF Totally free of snow and ice free of snow and ice HG Grass cutting in progress grass cutting HH Hazard due to (specify) hazard due HI Covered by ice cov ice HJ Launch planned ... (specify balloon flight identification or project Code name, launch site, planned period of launch(es)_date/time, expected climb direction, estimate time to pass 18,000 m (60,000 ft), together with estimated location) launch plan HK Migration in progress migration inpr HL Snow clearance completed snow clr cmpl HM Marked by marked by HN Covered by wet snow or slush to a depth of cov wet snow depth HO Obscured by snow obscured by snow HP Snow clearance in progress snow clr inpr HQ Operation cancelled ... (specify balloon flight identification or project Code name) opr cnl HR Standing water standing water HS Sanding in progress sanding HT Approach according to signal area only apch according signal area only HU Launch in progress ... (specify balloon flight identification or project Code name, launch site, date/time of launch(es), estimated time passing 18,000 m (60,000 ft), or reaching cruising level if at or below 18,000 m (60,000 ft), together with estimated location, estimated date/time of termination of the flight, and planned location of ground contact when applicable) launch inpr HV Work completed work cmpl HW Work in progress wip HX Concentration of birds bird concentration HY Snow banks exist (specify height) snow banks hgt HZ Covered by frozen ruts and ridges cov frozen ruts and ridges THE NOTAM CODE DECODE FOURTH AND FIFTH LETTERS Limitations (L) Code Signification Uniform Abbreviated Phraseology LA Operating on auxiliary power supply opr aux pwr LB Reserved for aircraft based therein reserved for acft based therein LC Closed clsd LD Unsafe unsafe LE Operating without auxiliary power supply opr without aux pwr LF Interference from interference from LG Operating without identification opr without ident LH Unserviceable for aircraft heavier than u/s acft heavier than LI Closed to IFR operations clsd ifr ops LK Operating as a fixed light opr as f lgt LL Usable for length of...and width of... usable length/width LN Closed to all night operations clsd night ops LP Prohibited to prohibited to LR Aircraft restricted to runways and taxiways acft restricted to rwy and twy LS Subject to interruption subj intrp LT Limited to limited to LV Closed to VFR operations clsd vfr ops LW Will take place will take place LX Operating but caution advised due to opr but caution due THE NOTAM CODE DECODE FOURTH AND FIFTH LETTERS Other (XX) Code Signification Uniform Abbreviated Phraseology XX Where 4th and 5th letter Code does not cover the situation, use XX and supplement by plain language (plain language following the NOTAM Code)
 -
 This FAA handbook provides knowledge for earning the Aviation Maintenance Technician certificate, General section. The FAA General test questions are drawn from this book (FAA-H-8083-30A). Available in the Downloads section right here on Recreational Flying
 -

Version 2018
19 downloads
This download forms a part of the John Brandon Flying Tutorials - Getting Started - 1.9 Owner-pilot maintenance of RA-Aus aircraft The Aviation Maintenance Technician Handbook – General was developed as one of a series of three handbooks for persons preparing for mechanic certification with airframe or powerplant ratings, or both. It is intended that this handbook will provide basic information on principles, fundamentals, and technical procedures in the subject matter areas common to both the airframe and powerplant ratings. Emphasis in this volume is on theory and methods of application. The handbook is designed to aid students enrolled in a formal course of instruction preparing for FAA certification as a maintenance technician, as well as for current technicians who wish to improve their knowledge. This volume contains information on mathematics, aircraft drawings, weight and balance, aircraft materials, processes and tools, physics, electricity, inspection, ground operations, and FAA regulations governing the certification and work of maintenance technicians. New to this volume is a section addressing how successful aviation maintenance technicians incorporate knowledge and awareness of ethics, professionalism, and human factors in the field. NOTE: this is a 60mb download as a .zip fileFree -
The first installment of John Brandon's Flying Tutorials titled "Getting Started" have been uploaded to the new Tutorials Section of the site. Overall John's tutorials contain: Getting Started Aviation meteorology Flight theory Flight planning & navigation VHF Radio communications Decreasing exposure to aerodynamic risk Coping with emergencies Airmanship and Safety Builders guide to safe aircraft materials Airmanship and safety: other online reading Powered recreational aviation legislation, CASA advisories and the enabling exemption orders. Airservices Australia's online information services Civil Aviation Safety Authority handbooks, guides and videos Australian Bureau of Meteorology weather services Technical handbooks Pilot handbooks I will progressively work my way through them all uploading each one for everyone to use as a reference and refresher to help keep everyone flying safer and more informed.
-
 Sport and recreational aviation is no longer purely the realm of dedicated minimum aircraft afficionados but has matured into an authoritative industry, well endowed with professional aviation business people and a number of recreational aeroplane manufacturers in regional Australia. These manufacturers currently produce most of the Australian-made factory fly-away aeroplanes — civil or military. In addition they, and other producers, supply aircraft kits for the many home-building enthusiasts — both in Australia and overseas. At the same time there are many RA-Aus members who are exercising their skills in designing and building their own recreational aircraft, or constructing them from commercially available plans. Leisure aviation also fostered the growth of the major existing Australian manufacturer of certificated aero-engines — Jabiru Aircraft. How the current status came about is best illustrated by reviewing the history of minimum aircraft and power-driven sport and recreational aviation in Australia. Please note: the following history is an ongoing compilation being put together from many sources; it was started in 2002, and from 2004 an annual survey was appended. I believe it is reasonably accurate but corrections — and additions — are sought and welcomed. The history generally covers only trikes and power-driven fixed-wing aeroplanes — with some mention of powered parachutes — but the 'power-assisted' sailplanes, motorised hang gliders and motorised paragliders are not included. The trikes administered by the Hang Gliding Federation of Australia and the gyroplanes of the Australian Sports Rotorcraft Association have little mention, solely due to the author's lack of knowledge; but I would be very happy to include more. 1.11.1 The 'flexwing' hang glider and weight-shift control trike enter the aviation scene 1891–1896 Otto Lilienthal designed and flew several weight-shift controlled hang gliders in Germany. He made perhaps 2000 flights between 1891 and his accidental death in 1896. He can properly be regarded as the father of hang-gliding and weight-shift control — which became so popular 70 years after his death. 1961 Practically all aircraft wing development since 1910 was associated with rigid wings but experiments by an American aeronautical engineer, Francis Rogallo (1912–2009), with a delta-shaped flexible wing — the Rogallo wing, which was patented in 1948 — culminated in NASA's Paraglider Research Vehicle project evaluating the flexible wing concept for suitability as a recovery vehicle for the Gemini spacecraft; among other uses in vehicle recovery. Several low-speed three-axis controlled light aircraft were built as part of the project — which was finally dropped in favour of parachute recovery. But the technology acquired helped kick-start the contemporary hang glider industry, and many foot-launched hang glider designs were developed around the world. 1963 An Australian — John Dickenson — had been working on wing designs for a tail-less kite to be towed behind the speed boats of the Grafton Water Ski Club. When shown a photograph of a Rogallo wing he decided to adapt the concept to his 'ski-wing' project. John designed a simple, flexible wing consisting of a pair of single-surface, plastic sheeting (as used for protecting banana bunches grown in the area) sails each with a leading-edge spar, joined at a centreline Douglas fir keel. An aluminium crossbar near the aerodynamic centre gave the frame some rigidity. A fixed, triangular trapeze (an 'A' frame control bar of metal tubing that is still widely used today) was attached to the crossbar, together with a freely suspended webbing harness for the pilot. The tether to the boat can be seen attached to the control bar of the A-frame. The forward motion for the kite was provided by the boat until the tether was released. Height and direction, relative to the boat, was controlled by shifting the pilot's body fore and aft and/or side to side (and thus the centre of gravity) relative to the fixed A-frame control bar, to change the kite's pitching and rolling moments; using the pendular weight-shift control system. Bill Moyes was captivated by the utility of the system and around 1967, using a Dickenson wing, he acquired the world altitude records for such vehicles. Bill Bennett was a witness to the records, riding in the aircraft that flew alongside to confirm altitude. John Dickenson flying the Mark 3 version of his wing. Grafton, Australia 1965. The Dickenson wing and the pendulum body support plus the wing control frame weight-shift system has developed into an aircraft design that has not only been used for perhaps 90% of all foot-launched hang gliders made since, it is also the basis from which the aircraft generally known as 'trikes' in Australia and the USA ('microlights' in Europe) have been developed. Unfortunately there has been little recognition, in Australia and internationally, of the enormous contribution made by John Dickenson's wing and the weight-shift control system (but see 1996 and 2006). A big advantage of the A-frame control bar is that the pilot has a direct feel for how the wing is flying — there are no intervening control rods, cables or pulleys connecting control surfaces to the pilot. 1969 Bill Moyes went to Europe with the barefoot water ski team for the world water ski championships in Copenhagen, and took a hang glider for demonstration. Bill Bennett moved to America and demonstrated the Dickenson wing to the USA by flying a tow-launched aircraft around the Statue of Liberty on Independence Day. Bill Bennett did much to promote hang-gliding, particularly in the United States; it is sad to report he died aged 73 on 7 October 2004 following engine failure after take-off in a trike at Lake Havasu City, Arizona, USA. For a while it looked as though self-launching, powered hang gliders with a wheeled undercarriage were likely to be the way to go, however the early 'paper-dart' type wings had a number of problems and many people around the world returned to a more conventional wing and tailplane/canard designs, some utilising the single-surface sailcloth covering of the hang glider. (The continuing development of those early tow-launched and the later foot-launched hang gliders went on to produce a strong national and international competitive hang gliding scene, even to the extent of fitting small, back-pack engine and propeller units to the hang glider pilot's harness — powered hang gliders. And, of course, the development of the weight-shift control trike continued — and still continues.) 1.11.2 The three-axis control, minimum aircraft years: 1974–1982 1974 – 75 Ronald Gilbert (Ron) Wheeler, a catamaran builder and hang glider builder of Sydney, Australia, fitted an 8 hp 180 cc Victa lawnmower engine to his Tweetie tapered wing, tailplane-equipped, hang glider and undertook the first flights of his Scout Mk1 in June 1975; starting production of this aircraft soon after. The Scout was the world's first commercially available powered 'minimum' aeroplane — semi-rigid wing similar in concept to a yacht sail. The aircraft now incorporated normal three-axis control (rather than weight-shift control) utilising rudder and elevator control surfaces for yaw and pitch, and wing warping for lateral roll. The early design was an extremely basic machine, a publication describing it as 'the ultimate in simple tube and Dacron design'; initially utilising standard yacht fittings from the local marine shop. The design incorporated a cambered, single-surface, sailcloth wing (rather than a full aerofoil wing), yacht mast tubing as the leading edge spar, and was easily transportable. This original Scout was underpowered but nevertheless, on a good day, it usually flew. The Skycraft Scout Mk2 was a factory-built minimum aircraft with an 11 hp, one-cylinder Pixie Major engine, empty weight 49 kg, maximum speed 42 knots and endurance about 40 minutes. The Scout started a new Australian industry. 1976 – 79 Ron Wheeler's persistent pursuit of the authorities to exempt minimum aircraft from the existing air navigation orders — and thus legalise the flight of his Skycraft Scout — influenced the Australian Department of Transport to issue (October 1976) an Air Navigation Order under which the minimum aircraft could legally be operated. Thus was created the world's first powered ultralight legislation. ANO 95.10 later CAO 95.10, legalised the manufacture and operation of the Scout and its many fellows, and paved the way for the most significant advance in Australian private flying since the aftermath of World War 2. However, there was no requirement for minimum aircraft to be registered, or for pilots to be licensed — although quite a number of people with general aviation licences were minimum aircraft enthusiasts — and there were no defined airworthiness, design or piloting standards; indeed most enthusiasts had to teach themselves how to fly. The Skycraft Scout (that sold for about A$1800) and the enabling legislation, fired people's imagination and commenced a revolution in Australian powered minimum aircraft aviation. Ron Wheeler alone sold 200 of his Scout Mk2 and then released the Mk3 pictured above with an 18 hp Robin engine (empty weight: 59 kg, stall speed: 18 knots and available with Wheeler-designed floats) and many other variations. Clubs sprang up in Australia, and the world, and all sorts of new design aeroplanes entered an expanding minimum aircraft market. Colin Winton, one of the many Australian enthusiasts, introduced his streamlined Grasshopper and later the Cricket, the first of a line of excellent aircraft from Col Winton and his son, Scott Winton. Gareth J Kimberley — RAAF and Qantas pilot — designed the very successful 1977 Sky Rider, a plans-built, three-axis aircraft with a single-surface sailcloth wing, conforming to ANO 95.10 and, in April 1978, founded the Minimum Aircraft Federation of Australia (MAFA) as the conduit through which the Department of Transport and part of the minimum aircraft community communicated. MAFA became the Minimum Aircraft Flyer's Association in 1982. Gareth published 'Fun flying! : a total guide to ultralights' in 1984. CAB Wasp: designed by Neville White in 1978 after purchasing a Scout which he found unsuitable. He built sixteen of the aluminium tube and sailcloth CAB Wasps. Neville — honoured as a Pioneer by RA-Aus in 2008 — is a member of the Holbrook Ultralight Club. Photo courtesy of Max Brown of the Australian Ultralight Aircraft Museum. For a description of the aircraft read an assignment (MS Word document) on the CAB Wasp that Max Brown wrote in 2009 as part of a Museum Practice course. Unfortunately the Australian Government regulations, though certainly enlightened for the times, restricted all flight operations to heights below 300 feet above ground level (agl) — to keep minimum aircraft operations below the 500 feet minimum operating height for general aviation aircraft. The aircraft were required to be single-seat, with a maximum empty weight of 115 kg, maximum empty-weight wing loading of 11 kilograms per square metre (2.25 pounds per square foot), maximum fuel load 15 kg, and were prohibited from flying within 300 metres of a public road or within 5 km of an airport. Basically the airframes were made from 50 or 60 metres of thin-walled aluminium tube and perhaps 35 square metres of sailcloth, and a lot of steel wire/cable. They were initially fitted with unreliable, under-powered, two-stroke engines — even chain-saw and mower engines — but quickly advanced to specifically designed engines with more capability. Such aeroplanes generally incorporated full three-axis control, but a few hybrid machines utilised a suspended, webbing pilot seat just for weight-shift pitch control. The 300 feet height restriction in the first edition of ANO 95.10 (slightly increased in 1985 to 500 feet); though reasonable at the time because of the lack of climb performance (some were difficult to get out of ground effect), was certainly not a pragmatic one, in the light of the subsequent (and unanticipated) rapid development in minimum aircraft capability. With their very light empty weight many aircraft had poor engine-off glide performance ratios with a heavy pilot on board — sometimes as low as 3:1; i.e. maximum wings level distance that could be flown, following engine failure at 300 feet, was 900 feet in nil wind conditions; a bit of a problem when you need a cleared area, with no livestock, quickly. Wind, manoeuvring flight and turbulence decreased that distance considerably. Also the first several hundred feet of the atmospheric friction layer are the most turbulent part of the lower atmosphere and particularly subject to wind shear events. And many of the pilots were self-taught. There was another aspect in that, although ANO 95.10 exempted the minimum aircraft movement from some provisions of the Air Navigation Regulations (now Civil Aviation Regulations), much of the regulations were still applicable. It seems that the authorities of the day may have turned a blind eye to minimum aircraft operations (perhaps believing that the movement would be a short-lived phenomenon) with undesirable results. The Australian Ballooning Federation (ABF) was formed in 1978 to administer recreational, adventure and competitive (FAI*) lighter-than-air private hot-air balloon flying. The Hang Gliding Federation of Australia [HGFA] started in 1973 as 'The Australasian Self-Soar Association' (TASSA) changing to HGFA in 1978 to provide one national body controlling all hang-gliding activities. HGFA now administers hang-gliding and paragliding (including powered variants with no more than 70 kg empty weight) and also powered, weight-shift control microlights/trikes. (In 2010 HGFA had 2300 members, 48 flight schools and 44 clubs located throughout Australia.) *Founded in 1905, FAI (Fédération Aéronautique Internationale) is the international governing body for air sports and aeronautical world records. Bill Moyes was awarded the FAI's 1979 Hang Gliding Diploma. This may be 'awarded every year to an individual who is considered to have made an outstanding contribution to the development of hang gliding by his or her initiative, work or leadership in flight achievement'. The Stolero: Steve Cohen's and Frank Bailey's 1978 design. Three-axis control with a mostly single-surface, wire-braced wing; later modification produced the Condor. Photo courtesy of the Australian Ultralight Aircraft Museum. 1.11.3 The AUF strides onto the stage: 1983–1984 1983 The Australian Ultralight Association was formed in 1982 and renamed the Australian Ultralight Federation during the Sports Aircraft Association of Australia's [SAAA] Easter 1983 convention at Mangalore. Although originally conceived as simply a peak honorary body for ultralight clubs — in much the same way as the Gliding Federation of Australia* was organised — it soon became apparent that ultralight fliers were not interested in this arrangement, probably because of the basically independent nature of ultralight aviation. Within 18 months some 700 persons had joined the new Federation, not via a club but as individual members. *Note: gliding began in Australia around 1929; the Gliding Federation of Australia [GFA] was formed in 1949, and initiated the concept of self-administration of sectors of aviation. Australian gliding became 'self-regulating' in 1953. The nature of gliding is very much a group activity rather than an independent operation of an individual pilot. Around this period it became evident to the Commonwealth Department of Aviation* [DoA had supplanted DoT] that these sport and recreational aircraft were here to stay and heavier, more complex ultralights would be developed; so something would have to be done to formalise the movement and do something about the very poor safety record. DoA cast about for someone to bite the bullet and accept ownership of the burgeoning ultralight movement that was developing from the minimum aircraft base. There had been a battle for some time over which single body would be the national representative of ultralight aviation in its dealings with the Department; there were several contenders but the Minister for Aviation recognised the AUF (rather than SAAA, the other major contender) as the national body. *Note: the primary function of the air regulations is to achieve safety in aviation. Under the Air Navigation Act and other legislation, DOA's regulatory function was the "formulation, implementation and oversight of operational standards and procedures for the safe conduct of flight operations". The Thruster Aircraft factory, at Kirrawee and later at Evans Head, commenced manufacture of single-seat Thrusters with 46 being built in 1983. The aircraft was a Steve Cohen development of his and Frank Bailey's 1977–1978 Stolero/Condor designs. 1984 The AUF received its Certificate of Incorporation and signed a Services Agreement with DoA to assist the Department to set, implement, monitor and enforce standards for ultralight aviation (comprising powered minimum aircraft with an empty weight exceeding 70 kg) including the establishment and maintenance of a pilot certification system, production of a training and operations manual and the issue of pilot instructor certificates, for which an annual 'Grant-in-Aid' would be provided to perform the administration work that otherwise would have to be done by the Department. Work proceeded on the necessary systems and procedures and the essential AUF Operations Manual, which was released in 1986. Also the formats for new air navigation orders were being developed to provide two-place ultralights for training purposes; ANO 95.55 was to be the operational standard, ANO 100.55 was to be the aircraft maintenance standard and ANO 101.55 was to be a full airworthiness certification standard for commercially manufactured ultralight aeroplanes. (ANO 100.55 was never tabled as its purpose would eventually be fulfilled by the AUF technical manual.) There was an expectation amongst builders of ANO 95.10 aircraft that a new ANO (95.22) would soon be released allowing a maximum aircraft empty weight of 150 kg instead of the 95.10 115 kg, consequently most aircraft being built weighed up to 150 kg. A dispensation was provided to the owners of the overweight aircraft allowing continuation of operation, but the introduction of ANO 95.55 was consequently delayed for several years. The effort that the early AUF volunteer office bearers contributed was incredible, inheriting this big pool of enthusiastic flyers, who in many cases, knew little about aviation and, anyway, didn't want to. Unfortunately, the accident rate was making people sit up and take notice. (The Bureau of Air Safety Investigation accident data for the period 1978–1986 indicated 77 accidents involving ultralights and causing 35 fatalities and 28 serious injuries.) It is easy to be critical of those early years, however we should not forget that all flight operations were legislated to be below 500 feet agl with the inherent danger of forced operations at very low heights (something now considered unthinkable). This was exacerbated by aircraft with extremely limited flight envelopes (for example, only a 15–20 knot (30–40 km/h) range between minimum and maximum controllable airspeeds) and with occasional stability problems. To compound the problem, it was still illegal to be taught how to fly in a two-seat ultralight and most would-be pilots had to teach themselves in their newly-built single-seat aircraft! The regulations were forcing ultralight aviation to operate in a regime where any sort of stall, not quickly recovered — because of a lack of supervised training in two-place aircraft — was almost certainly going to finish up as an accident. In general aviation training the recommended minimum height for practising stall recovery was then 3000 feet agl. About this time Frank Bailey, an aircraft production engineer, published his popular book on how to teach yourself to fly a minimum aircraft. The book explained all that was needed; from basic aerodynamics in simple terms to choosing a paddock from which to operate. The book cover indicates that the definition of a paddock was somewhat loose in those earlier days — the two B1-RD minimum aircraft are operating from a rather rough, dry creek bed; note that registration marks had not yet appeared. Photo courtesy of the Australian Ultralight Aircraft Museum, Holbrook, NSW. 1.11.4 Taking powered sport and recreational aviation in hand — training aircraft and flight schools: 1985–1986 1985 The AUF membership reaches 850. DoA promulgated ANO 95.25* as a second regulatory class covering single-place and two-place factory-built ultralights. This ANO was introduced as an interim means (until ANOs 95.55 and 101.55 were promulgated) for providing approval of two-seaters, built to a defined airworthiness and design standard, and to allow their use as commercial training aircraft — without full type certification — for the ANO 95.10 pilots. The ANO 95.10 regulatory class was still exempt from airworthiness or design specifications. This was a big step for Australian aviation generally and again a world first; but still an ultralight could not be flown at a height in excess of 500 feet agl. The legislation specified 370 kg maximum take-off weight [MTOW] inclusive of pilot and student weight; which was somewhat low as it was difficult to accommodate two people (at the standard mean weight of 77 kg each) plus around 25 kg of fuel in a stronger, thus heavier, airframe without exceeding MTOW – so it was later increased to 400 kg. A single-place 95.25 aircraft was limited to 290 kg MTOW. The reliability and availability of purpose-built two-stroke engines are improving, along with better engine and airframe performance. *Note: although the ANO 95.25 legislation was promulgated in March 1985, no aircraft had passed the certification package until March 1986. At January 1987 only two models of 2-seat training aircraft had been approved; the Gemini Thruster and the Hughes LightWing. The AUF received a $45 000 grant from DoA, covering a 3-year period, and was thereby enabled to set up training curricula; encourage the establishment of facilities for ultralight flight training, (both within the clubs and as commercial entities); nurture their continuing existence and maintain a safety watch over their operations and abilities. An ANO 95.10 amendment required that any person operating an ultralight be an AUF member. The approval of the AUF Operations Manual by DoA in effect issued an Air Operator's Certificate (AOC) to the AUF covering all the AUF approved flight training facilities (FTFs). (An AOC authorises an organisation to conduct specified aerial work operations, flight training, air charter operations or regular passenger transport operations.) DoA devolved the task of assessing, approving and subsequently auditing each flight training facility, against the provisions of the Operations Manual, upon the AUF Operations Manager. Around this time ANO 95.10 was changed to exclude commercially manufactured aircraft. This effectively stopped the factory manufacture of the single-place minimum aircraft, except for home-building from factory-supplied kits, and changed the concept of Australian ultralight aviation. 1986 Having completed a formal ultralight flight training course, AUF Pilot Certificate no. 1 was issued in March to Bill Dinsmore, the first AUF Operations Manager and the author of the initial Operations Manual. The AUF aircraft register was established and the first aircraft issued with an ANO 95.25 type acceptance certificate — the Thruster Gemini two-seat trainer prototype — was registered as 25-0001 in early 1986. (Note: Thruster 25-0001 was still flying in 2007 but under another registration number though there was a campaign underway to restore the 20-year old aircraft to its original and historical registration that had been usurped by another aircraft, but the principal leader of the campaign — Tony Hayes (the inaugural holder of the RA-Aus Meritorious Service Award) — died in 2009.) By 1986 Thrusters had already been demonstrated overseas at the Paris Air Show and at Oshkosh, USA with export already underway in 1985. With the authority of ANO 95.25 backing it, export really got going the following year and an Australian-owned subsidiary Thruster factory opened in the UK. The process led to the construction of over 700 Thrusters in many models with versions still entering the market in 2001. 1.11.5 HORSCOTS reinforces the AUF administration of ultralight aviation and introduces international design standards: 1987–1989 1987 The AUF membership is now 1150. In January the HORSCOTS (House of Representatives Standing Committee On Transport Safety) 'Report on Sports Aviation Safety' (8.5 MB pdf file) confirmed that Ultralight Aviation should continue to be administered by the AUF, recommended that height ceilings should be raised, affirmed the requirement for two-place trainers and mandated that all factory-built or kit-built three-axis ultralights accord with the new design and certification standard, ANO 101.55, being developed for aircraft up to 450 kg MTOW and subsequently promulgated in January 1988. HORSCOTS directed the Authority that funds be made available to the AUF to assist the Authority to set and monitor standards for ultralight aeroplanes and operations. There was no funding provided for the mandatory functions performed to administer the aircraft register, the pilot and instructor certification systems and the appointment of Chief Flying Instructors. The report also recommended that 'legislation be changed to legalise spin/stall training for ultralights and that spin/stall training in 2-seat aircraft be incorporated into the flight training syllabus of student pilots'. The HORSCOTS report introduced the term 'Light Sports Aircraft' (note the plural) to describe aircraft now known as 'sports and recreational aircraft'. 1988 ANO 95.10 was amended to allow an 150 kg empty weight and 290 kg maximum take-off weight. All the ANO designations were then changed to CAOs; i.e. Civil Aviation Orders when the Civil Aviation Act 1988 was introduced, establishing the Civil Aviation Authority from the DoA. However, as can be seen in this extract, the Act did not devolve upon CAA, or subsequently CASA, any function relating to the on-going development, or indeed the survival, of civil aviation – in any of its forms. There is no Australian government authority with any function relating to such matters with respect to recreational aviation. In the USA the Federal Aviation Administration includes the words "to foster and support all forms of aviation" in its mission statement. However CAA (and later CASA) have done much, through legislation and attitude, to encourage the building (and maintenance) of 'experimental' ultralights by individuals and of 'type certificated' ultralights by commercial enterprises; and to devolve the management of ultralight affairs to the AUF/RA-Aus. By 2002 it was obvious that together AUF/RA-Aus and CAA/CASA had put in place one of the best, if not the best, system of very light aircraft training in the world. Bantam B22S. The original B22 was designed and manufactured in New Zealand around 1987; production of the CAO 101.55 certified Bantam B22S training aircraft commenced in 1995. Photo of 24-3221 courtesy of Max Brown of the Australian Ultralight Aircraft Museum. 1.11.6 Introduction of non-training two-seaters: 1990–1992 1990 The AUF membership is now 2400. CAO 95.32 was released in February as an operational standard providing exemption — for weight-shift controlled aeroplanes (to be registered with the AUF or HGFA) and powered parachutes (to be registered with the AUF) — from some provisions of the Civil Aviation Regulations. CAO 95.55 was released in August as an operational standard providing exemption (for certain single-engine ultralight aeroplanes to be registered with the AUF) from some provisions of the Civil Aviation Regulations. The CAO 95.55 aeroplanes were factory-built or amateur kit-built (ABAA) 450 kg MTOW two-seat aircraft built to the design standards and certification requirements of CAO 101.28 or the previously mentioned CAO 101.55. (ANO/CAO 101.28 was introduced in 1976 to aid amateur building of SAAA aircraft.) A CAO 101.55 factory built ultralight could be registered as a general aviation aircraft, if fitted with a certified four-stroke engine, navcom equipment and additional instrumentation. CAO 95.25 was then cancelled but did not prohibit the continuing manufacture of the 6 or 7 types already accepted under CAO 95.25. The maximum altitude for flight operations was increased to 5000 feet amsl (or 2000 feet agl over high terrain) and at last specified a minimum operating height of 500 feet agl – except when taking-off or landing. Around this time, after several years negotiation, the AUF, particularly represented by John Baker*, was successful in amending CAO 95.10 to allow construction of single-seat aircraft from approved commercial kits. This gave more people access to ultralighting who had neither the time nor skills to design and build their own aircraft or build from plans. Aviation took another step toward being more accessible to more people. With the wide introduction of the 95.25 two-seat trainers, and formalised training, the safety record turned the corner for the better. (And has been steadily improving ever since: the average annual fatality rate during 1996 – 2000, per 1000 registered ultralights, was only 10% of the rate in the years preceding HORSCOT.) *John Baker was the Airworthiness (now Technical) Manager from about 1984 to 1994 and it was his efforts that produced the first edition of the Technical Manual in 1993. John's day job was as Wing Commander John Baker, RAAF, officer commanding the RAAF's Aircraft Research and Development Unit. 1991 The Jabiru Aircraft Company, of Bundaberg, Queensland, that was formed in 1988 to develop a fibreglass-reinforced epoxy polymer fabricated ultralight, received type certification under CAO101.55 for their Jabiru LSA 55 two-seat 'light sports aircraft' ultralight. The aircraft was then available as a factory 'fly-away' or as a kit for home-builders. This ultralight aircraft proved to be so successful that it is now (written in 2003) popular with general aviation flight schools, who otherwise have to be content with continuing to operate very old Cessna and Piper training aircraft, or spend extremely large sums for a new aircraft coming from the now severely curtailed production lines in USA. Around this time Aerochute Industries of Melbourne — following release of their single-place parawing aircraft in 1990 — introduced their highly successful two-place powered parachute, that went on to dominate the Australian market for such aircraft. 1.11.7 The consolidation years: 1993–1997 1993 The AUF membership is now 3300. The AUF campaign for further increases in aircraft weight resulted in an increase to 480 kg MTOW for cabin-type two-seat trainers, allowing opportunity for the heavier four-stroke engines and an advance in reliability with such engines. Two-stroke engines, particularly those from Bombardier-Rotax, had now evolved to be viable power plants, but still prone to stoppages without any warning signs. An innovative Jabiru Aircraft r&d program produced the light-weight Jabiru 1600 cc, 60 hp, four-cylinder, four-stroke engine to replace an imported engine. Jabiru '1600' powered aircraft were manufactured from 1993 to 1996, when a 2200 cc 80 hp version went into production. (Jabiru later introduced a 3300 cc six-cylinder engine version.) 1994 The AUF has now been in existence for 11 years. The following extract from the Department of Transport and Regional Services' 'Digest of Statistics, 1994' recognises the contribution of the AUF to Australian Aviation. "The ultralight movement represents a return to the minimum aircraft, or 'grass roots' concept of powered flight. In October 1976 the Australian Government, through the then Department of Transport, introduced the world's first legislation covering the operation of ultralight aircraft. The Australian Ultralight Federation was incorporated in 1984 to oversight the operation of ultralight flying activities. The initial restrictive legislation has since been progressively relaxed, to the extent that ultralight aircraft can now compete directly with 'conventional' aircraft in some aspects of the leisure flying and training markets. The popularity of the sport has led to a thriving and innovative Australian light aircraft manufacturing industry. Although no statistics are available for the earlier years, it is noteworthy that the industry has grown from virtually zero in 1976 to one involving more than 1100 aircraft flying nearly 73 000 hours in 1994." 1995 –1996 Additional safety was achieved when CAO 95.55 issue 2 allowed radio-equipped ultralights to operate above 5000 feet when "flying over an area of land, or water, the condition and location of which is such that, during the flight, the aeroplane would be unable to land with a reasonable expectation of avoiding injury to persons on board the aeroplane." Airborne Windsports Pty Ltd, of Redhead NSW, received their CAA Certificate of Approval for manufacture of aeroplanes. The company first set up operations in 1983 as a hang glider training school. In the early 1990s, Airborne designed and produced the first of what later proved to be a highly successful — both nationally and internationally — range of powered, weight-shift trikes, the Airborne Edge. Most of the company's early production was registered with HGFA, probably due to their exposure to HGFA members as hang glider tugs; the first AUF registration was recorded in 1992. The Civil Aviation Safety Authority (CASA) was created in July 1995 by splitting the Civil Aviation Authority into two parts — CASA and Airservices Australia (AsA). CASA was assigned the function of conducting the safety regulation of civil air operations in Australian territory. (It is interesting to note that later (2003) CASA was provided with a new Charter Letter setting out strategic directions for the organisation which included this paragraph: "The Government's vision for CASA is of a firm but fair regulator which focuses on core safety related functions in a way that ensures that industry meets its safety obligations, but at the same time permits development and growth in Australian aviation." This goes some way to redressing the shortcoming mentioned earlier that there is no Australian government authority with any responsibility relating to to the on-going development, or indeed the survival, of civil aviation – in any of its forms.) In 1996 John Dickenson was awarded the Medal of the Order of Australia 'In recognition of service to flying, through the invention of the 'Delta Ski Wing' and to the development of hang-gliding, paragliding and the microlite aeroplane'. There was little growth in AUF membership during 1993 through 1997; new members joining matched normal attrition so total membership remained stagnant at around 3600 voting members. 1.11.8 Amateur-built (experimental) regulations establish a new platform for growth: 1998–2000 1998 CAO 95.55 was expanded to allow a category of 'Amateur-built (Experimental)' and allowing an increase to 544 kg MTOW for two-seat aircraft to cater for newer, more reliable, four-stroke engines; more robust airframe design; a less demanding nosewheel rather than tailwheel configuration, thus providing more consistently safe landings; and an increased fuel capacity providing a longer and safer airborne endurance plus the ability to take a friend along for the ride. Consequently the number of new single-place aeroplanes entering the AUF Register started to decline while the number of two-place machines increased at a fast pace. Each advance of MTOW, negotiated between the AUF and CAA/CASA over the years, while still restricting the seating capacity to pilot and one passenger, has made for a range of safer, stronger Australian-manufactured aeroplanes that appeal – in terms of the hip pocket and reliability and ease of handling – to a much wider recreational community, and thus encourages interest in Australian sport and recreational aviation and revives growth, while still preserving the minimum aircraft concept on which the AUF was founded. 1999 In a low period in CASA/AUF relations, lobbying by the association caused the Senate to disallow tabled changes to CAO 95.55 that would have been detrimental to the members. 1.11.9 The AUF enters its third decade and becomes RA-Aus: 2001–2004 2001 Membership increased to 4500. CASA issued NPRM 0115SS which proposed that each AUF flight training facility must hold an Air Operator's Certificate (Sport Aviation), appoint a Chief Pilot and be audited periodically by CASA on an hourly charge plus travel basis. The costs involved and the problems associated with the FTFs being supervised by two organisations made untenable the positions of the (necessarily smaller) schools in regional areas. After a struggle the proposed changes were not implemented. Number of AUF registered ultralights, by category, 1993 to 2001 (Fiscal Year) Year CAO 95.10 CAO 95.25 CAO 95.55 CAO 101.55 CAO 95.55 CAO 101.28 'chutes trikes sub-total exc. 95-10 total Commercially built Amateur built Weight shift 1993 586 345 .. 89 .. 34 31 13 512 1,098 1994 519 355 .. 118 .. 48 46 14 581 1,100 1995 501 364 .. 151 .. 72 64 14 665 1,166 1996 494 379 .. 167 .. 93 71 18 728 1,222 1997 469 385 .. 196 .. 114 67 23 785 1,254 1998 470 388 .. 209 .. 139 74 25 835 1,305 1999 458 386 10 214 88 136 69 36 939 1,397 2000 439 366 44 227 186 135 79 46 1,083 1,522 2001 398 332 65 209 286 131 76 47 1,146 1,544 2004 AUF registered aircraft are formally accorded Australian nationality under the terms of the Chicago Convention on international civil aviation; which is relevant in ensuring that RA-Aus aircraft are not discriminated against by Australian aerodrome operators. Previously AUF aircraft were more or less legally 'stateless'. The change also closed a loophole in the application of the civil aviation regulations to RA-Aus aircraft. The twenty one years that the AUF has been in existence has seen a major expansion in the types of aircraft on the AUF Register, but still at the heart of the light aircraft movement in Australia – as elsewhere – are those amateur builders who assemble their aircraft at home from a factory-supplied kit; or fabricate it from basic plans. Or those really dedicated individuals who build and fly their own designs. Such aircraft first registered in the CAO 95.10 category — the low-momentum ultralight aeroplanes — are still the heart of ultralight aviation even though they now represent less than 15% of registrations. Trikes from Airborne Australia and powered parachutes from Aerochute Industries are still maintaining a significant share of new aircraft registrations. Airborne received their CASA Type Certificate and Production Certificate for the Airborne XT range. However the availability of a wide range of structurally stronger ( thus heavier) and faster commercially-engineered aircraft (some of which may also be registered with CASA as general aviation aircraft); equipped with engines of much greater reliability and capable of travelling longer distances (even non-stop from Australia to New Zealand), is encouraging many more people — of all ages — to take up flying. A surprising number of new members are middle-aged persons who have always thought they would like to fly and now, being relatively free of family commitments and work pressures have reduced somewhat, are realising that ambition. So, over 21 years ultralight aviation and the highly successful AUF grew, from a few hundred somewhat intrepid and usually self-taught aviators, to a more general — and rather more cautious — membership of 5300 with the number of aircraft on the register in October 2004 nearly doubling the 1994 register. To reflect this broadening of the ultralight aviation community, in April 2004, the Australian Ultralight Federation changed its name to Recreational Aviation Australia Incorporated (RA-Aus). All this from the humble beginnings of towed Dickenson kites and the Wheeler Scout, through 21 years of the AUF to an era of safe, affordable recreational aviation. It is interesting to note that on 1 September 2004 the United States Federal Aviation Administration introduced the Sport Pilot Certificate (and the Light Sport Aircraft category) for recreational and sport aviation that, if you didn't know better, might be thought to be very much modelled on the RA-Aus Pilot Certificate and the CAO 95.55 concept. RA-Aus is continuing to work with CASA on the introduction of new and simpler regulations. 1.11.10 The remarkable RA-Aus growth takes off: 2005–2009 2005 The success of the Association is the best thing that has happened to private powered flying in Australia since World War 2. Due to the dedication and diligence of the staff and board members, in 2005 the Association was well positioned to build on that success. The year concluded with several noteworthy milestones occurring in December. The number of current RA-Aus flight schools passed 100, the current paid-up membership reached 5996 (12% increase in 12 months), the Jabiru Aircraft Company delivered the 1000th aircraft in its Jabiru range — to an FTF at Swan Hill, Victoria. The work for the enabling legislation for light sport aircraft [LSA] categories to be added to CAO 95.55 and CAO 95.32 was completed and, commencing from 7 January 2006, RA-Aus registration of LSA aircraft with the maximum weight of 600 kg for landplanes and 650 kg for seaplanes was then allowed. LSA applies equally to general aviation and recreational aviation so that the boundary between these two powered aviation communities is becoming increasingly indistinct and suggests that the numbers of GA flight schools also opting for RA-Aus FTF accreditation will increase. The Association purchased Canberra office premises to provide better staff facilities and room for expansion. 2006 John Dickenson was awarded the 2006 Fédération Aéronautique Internationale Hang Gliding Diploma. The citation reads: 'John Dickenson invented the modern hang glider at Grafton, Australia. It was flown on 8 September 1963. John built scale models to determine design concepts, until a full sized glider was towed behind a speedboat. He incorporated the control bar into the airframe by designing the A-frame to distribute flight [loads?], refining this further when he invented the pendulum weight-shift control system. John developed the piloting techniques, and taught all the early pilots, including Hang Gliding pioneers Bill Moyes and Bill Bennett, to fly the wing. John Dickenson's invention has been copied by every manufacturer globally, with few minor changes for over a decade'. While Australian general aviation still appeared to drift in the doldrums, Recreational Aviation Australia continued to forge ahead. Membership at 31 December 2006 was 6946, up 16% from the 5996 at 31 December 2005, the highest increase achieved between 1990 and 2010. The number of RA-Aus approved flight training facilities increased by 13% during 2006, totalling 113 at 31 December. During the year 348 new registrations and re-registrations were added to the RA-Aus aircraft register. Trikes — mostly from Airborne Australia — represented 15% of new registrations and powered parachutes — all from Aerochute Industries of Melbourne — represented 10% which indicates the annual growth rate for those categories is somewhat higher than the three-axis category. RA-Aus fees and charges were increased for the first time in nine years — apart from the GST impost. The 2006 year saw the 20th anniversary of the issue of the first AUF Pilot Certificate. Regulatory environment CASA extended operations in Class E VMC airspace to RA-Aus Pilot Certificate holders. On 21 December 2006 CASA published NPRM 0603OS, the notice of proposed rule making relating to the pending introduction of the long debated CASR Part 103 'Sport and Recreational Aviation Operations', that will make redundant the current exemption CAOs under which sport aviation operates. CASA had a target implementation date of first quarter 2007 for issue of the NPRM for the related CASR Part 149 that will define the role of recreational aviation administration organisations. 2007 The year brought, to recreational aviation, a mixed bag of continuing progress and major disappointment. Foremost was the RA-Aus safety record, which for the first 10 months was disappointing enough in that 2007 was shaping up to be just another average year rather than an improvement, but the occurrence of three fatal accidents during the last six weeks of the year brought about a distressing reversal in the safety record. There were eight fatal accidents in 2007 in which eight pilots and five passengers died. In addition there were two other accidents where occupants were severely injured. Passengers died in nearly two-thirds of the fatal accidents, whereas the recent history has been a passenger fatality in one-third of the fatal accidents. Growth in RA-Aus numbers Voting membership at 31 December 2007 was just on 7800, up 12% from 2006. A total of 402 flying instructors, senior instructors and CFIs are included in the membership figure. The number of RA-Aus approved flight training facilities increased by 13% during 2007, totalling 128 at December 31. In addition, there were about 10 satellite FTFs controlled by the CFI at a 'parent' location until a permanent onsite CFI is available. During the past three years the FTF growth rate has been healthy and consistent. Part of the growth is derived from general aviation flying schools opting for association with RA-Aus thus expanding their potential market. RA-Aus aircraft register During the year 346 new registrations and re-registrations were added to the aircraft register. CASA's aircraft register is appoaching 13 000 aircraft. Regulatory environment The long-awaited legislation for CASR Part 103 was not promulgated as hoped. Eleven years had elapsed since work on this Part and Part 149 started in 1996 — obviously the mills of regulatory change grind very slowly when associated with Australian recreational aviation. However in July 2007 CASA did publish another notice of proposed rule making NPRM 0704OS, relating to the introduction of CASR Part 149 'Sport and Recreational Aviation Administration Organisations'. This NPRM was the second related to Part 149, the previous notice of proposed rule making — NPRM 9805RP — was published in 1998 but never got anywhere. 2008 The year was very rewarding in terms of the primary goal — safe flying. There was only one fatal accident in an RA-Aus registered aircraft during the year — sadly both occupants died. There were no accidents where long-term injuries were sustained. Since the AUF/RA-Aus was established in 1983 there has been one other year (1996) where only one fatal accident occurred. Ordinary membership at 31 December 2008 was 8440. So, considering the 145% increase in membership since 1996, 2008 was the safest RA-Aus flying year ever. The average annual number of RA-Aus fatal accidents for the five-year period 2004–2008 is 4.5 — about the same as the 1999–2003 period. Past history shows that 87% of RA-Aus accidents involve — or are directly attributed to — critical decisional errors or human factor (HF) related events. Elimination of such events might be regarded as the last frontier to be conquered in the quest for fatality-free operations. HF training of the instructor population commenced in 2007 and, by end 2008, over 70% of instructors had completed a human factors related course. HF training was added to the RA-Aus Pilot Certificate training syllabus with the introduction of a revised Operations Manual. Consequently, from August 2008 all new pilots study HF in their training. All existing Pilot Certificate holders were required to complete an HF course, or an examination, by August 2010. RA-Aus aircraft register During the year 312 new registrations and re-registrations were added to the aircraft register, with a number of older aircraft dropping out, bringing the total to 2805 aircraft at December 31, 2008. State Full registration Provisional registration 90-day suspension Total Qld 704 23 26 753 NSW + ACT 706 26 16 744 Vic 624 20 17 661 Tas 79 1 2 82 SA 263 6 5 274 WA 224 10 2 236 NT 50 0 5 55 Total 2650 82 73 2805 Note: RA-Aus provisional registration applies to completed home-builts that have not yet flown the 40 hours required for full registration. The 90-day suspension category applies to aircraft where the annual fee is up to 90 days overdue. After the 90 days grace period the registration entry is cancelled. The ratio of voting members to registered aircraft has hovered around 2.5:1 for some years but at the end of 2008 it had drifted up to 3:1. The average annual hours flown (in RA-Aus aircraft), currently reported by Pilot Certificate holders, has reduced a little to 32 hours; perhaps indicating that the average RA-Aus aircraft, including the training and club-owned fleet, flies about 100 hours per year. Growth in RA-Aus numbers Membership at 31 December 2008 is 8440, up 8% from the 7800 at 31 December 2007. The distribution of membership is: Queensland — 2139 (25%) New South Wales and the ACT — 2291 (27%) Victoria — 2093 (25%) South Australia — 927 (11%) Western Australia — 523 (6%) Tasmania — 278 (3%) Northern Territory — 119 (1.5%) Members currently overseas — 58 (0.5%) The number of RA-Aus approved flight training facilities increased by 9% during 2008, totalling 139 at 31 December. That total excludes about 15 satellite FTFs currently operating under the control of a parent FTF. Regulatory environment The non-promulgation of CASR Parts 103 and 149 remains a major disappointment. To curtail some of the effects, RA-Aus requested changes to the old exemption CAOs — 95.55, 95.32 and 95.10 for the introduction of: Entry to controlled airspace (with CASA requiring Class 2 medicals) Flight over water to come in line with GA requirements (not for powered 'chutes) Flight above 5000 feet approved in line with GA Entry to active restricted areas (dependent on conditional status) Consequently CASA established Project OS 08/13 'Early implementation of certain proposed CASR Part 103 standards via CAO'. It was expected that these changes could eventuate in 2009. 2009 The year was very disappointing in terms of the RA-Aus primary goal — safe flying. It started very well; there were no fatal accidents in the first seven months and it looked like the RA-Aus human factors training programs were starting to produce the required results. Then there were four fatal accidents between August and December. Two of the accidents involved trikes, one of which was an unregistered aircraft. A passenger also died in one of the trike accidents. In addition, there was a fifth accident where an RA-Aus three-axis Pilot Certificate holder died in a trike registered with HGFA. So, a year that started with a lot of promise — following the gains made in 2008 — ended very badly. In effect, maintaining the historical average annual number of 4.5 fatal accidents. Growth in RA-Aus numbers Although there was no evident growth in safety effectiveness; throughout 2009 there was very healthy growth in membership, flight training facilities and recreational aviation clubs. At 31 December 2009 there were 9186 ordinary members; reflecting a net increase in numbers of 746 during the year. There was a net increase of 3936 members (or 77%) since the end of 2004. The increase reported is the sum of new members less the normal turnover of the existing membership during the period, so the number of new members added would considerably exceed the net increase reported. The number of RA-Aus approved and independently operating flight training facilities increased by 15 (10%) during 2009, totalling 154 at 31 December. That total excludes eight satellite FTFs currently operating under the control of a parent FTF. The number of known clubs associated with powered recreational aviation now totals around 106; again, a healthy increase during 2009. RA-Aus aircraft register Economic conditions seem to have affected the number of new aircraft registrations and the number of registration cancellations. The number of aircraft on the RA-Aus register at the end of 2009 was 2955; an increase of only 2% during the year. Regulatory environment The continuing non-promulgation of CASR Part 103 and CASR Part 149 is somewhat frustrating. This is exacerbated by CASA's October 2009 decision not to proceed with Project CS 06/01 'Proposed MTOW [750 kg] increase for aircraft operating under CAO 95.55'. As reported in 2008 CASA, at RA-Aus urging, established Project OS 08/13 'Early implementation of certain proposed CASR Part 103 standards via CAO'. Promulgation of that has also stalled in the legislative drafting; except that, in July 2009, the Director of Aviation Safety decided to maintain the current policy of entry into controlled airspace requiring a CASA Pilot Licence. 1.11.11 RA-Aus growth begins to slacken: 2010–20?? 2010 There were three fatal accidents in RA-Aus registered aircraft during the year — sadly two passengers and two pilots died. The total number of fatal accidents in RA-Aus registered aircraft during 2008, 2009 and 2010 was eight or 2.7 fatal accidents per annum, an improvement on the average for 2004 to 2007 of 5.5 fatal accidents per annum. Considering the difference in average membership, and thus hours flown in the two periods, this provides a positive indication that the human factors training introduced in 2007 is taking effect. Growth in RA-Aus numbers The total ordinary membership at the end of 2010 — including non-voting juniors — was 9674; a net increase of only 488 members (or 5.3%) during the year. The reduction in rate of growth is due to an increase of about 350 persons (to roughly 1500) in the annual non-renewing numbers rather than to any reduction in the rate of recruitment. The annual intake of new members has been increasing slowly during recent years but, at the same time, the number of ordinary members not renewing membership has been increasing at a faster rate. A high and increasing member turnover, or perhaps poor early retention, is not a good sign. During 2005, 2006 and 2007 the total ordinary membership increased by an average of 830 persons (13% p.a.) each year. During 2008 the increase was 8% (640 persons) and 2009 was 9.5% (798 persons). During 2010 the increase dropped to 488 persons (5%) so the annual rate of membership increase peaked in 2006 at 16% and has been receding since then, though RA-Aus states that membership is expected to reach 10 000 ordinary members by December 2011. The total membership figure may start to decrease within a few years which may be a problem for the organisation's financing. The number of RA-Aus approved flight training facilities increased by 10% during 2010, totalling, at year end, about 170 schools operating from 190 locations. However a total of 454 flying instructors, senior instructors and CFIs are now engaged in flight training which represents a modest increase of 13% during the past three years. State Instructors Senior Instructors Chief Flying Instructors Total Qld 31 48 36 115 NSW+ ACT 40 52 44 136 Vic 22 47 29 98 Tas 2 4 6 12 SA 8 21 14 43 WA 4 20 16 40 NT 1 5 4 10 Total 108 197 149 454 RA-Aus aircraft register The number of aircraft on the RA-Aus register increased by 261 aircraft (9%) during the 13 months since 31 December 2009. There were 350 new registrations or re-registrations in 2006, 342 in 2007, 315 in 2008, 247 in 2009 and 285 in 2010. During the last four years there has been a 11 percentage point shift away from home-builts (now 42% of total aircraft) towards increasingly complex factory-built aircraft. This has resulted in a substantial increase in the market value of the RA-Aus flight line — currently estimated at $115 million. This increase in market value is a worry as it restricts member acquisition of their own aircraft, which is reflected in the changing ratio of total members to total aircraft in the fleet. The lack of low price factory-built aircraft and kits is a negative factor. In the factory-built category, powered 'chutes and trikes continue to maintain their popularity amongst association members. Fifty per cent of the new aircraft added to the register came from the three larger Australian manufacturers; Jabiru added 84 aircraft (28%) — 13 of which were kit-built, Airborne added 44 trikes (15%) and Aerochute added 20 powered parachutes (7%). Airborne also supplies trikes to HGFA members so their total share of the Australian market is much higher than indicated by the RA-Aus registrations. Airborne is quite a success story, it has now manufactured some 2100 trikes, roughly equally distributed between local and international markets. (Note: the company's registered name is 'Airborne Windsports Pty Ltd', its name for marketing purposes was 'Airborne Australia' for some time, but now prefers to be identified as 'Airborne'. The ratio of total members to registered aircraft hovered around 2.5:1 for some years but it has been drifting up during the last few years and is now 3.0:1. However, the ratio of Pilot Certificate holders with endorsements to registered aircraft is probably more meaningful; this is currently 2.0:1. Regulatory environment CASA's Project OS 08/13 'Early implementation of certain proposed CASR Part 103 standards via CAO' has still not come to fruition but is expected in 2011, hopefully providing revised exemption CAOs incorporating the following changes: MTOW for landplanes (except low momentum ultralights) to be the lower of the aircraft's design or certificated MTOW or 600 kg. Flight over water rules relaxed. Flight below 10 000 feet approved. 2011 The year started very badly with two fatal accidents in January and continued in that vein throughout the year to total six fatal accidents. The death toll was eight — five certificated pilots, one student pilot under instruction and two passengers. There was also one ' collision with terrain' accident which did involve people on the ground and could have been horrific, but fortunately there were no serious injuries. The total fatal accidents for the five years 2007–2011 was 22 (4.4 per year) with 31 deaths. Recreational aviators are not improving quickly enough, see 'Decreasing your exposure to risk'. The chart below is the annual record of a 5-yearly average of the number of fatal accidents. Growth in RA-Aus numbers The total ordinary membership at 31 January 2012 — including 31 non-voting junior members — was 10 008; a net increase of only 334 or 3.5% from January 2011. The corresponding membership increase in 2010 over 2009 was 5%, 2009 over 2008 was 9.5%; 2008 over 2007 was 8%. The increase reported is the sum of new members enrolled (1956 in 2011) less the turnover of the existing membership during the period; that latter turnover was very high during 2011 totalling 1580 persons representing 16% of the membership at the beginning of 2011. Many of the persons who allow their membership to lapse will renew it in the following year, or later, after the circumstances that forced them to stop flying have improved. Such renewals of lapsed membership are not included as new members in the year of renewal. Some trend lines are added to this record of total membership (those with voting rights) from 1985 to the end of 2011. As you can see a period of stagnant growth existed during the five years 1994 through 1998. However, the 1998 introduction of the 'Amateur-built (Experimental)' category to CAO 95.55, fuelled an increasing interest in very light aeroplanes that resulted in six years (1999 through 2004) of moderate but sustained growth, where RA-Aus membership ultimately reached a seemingly critical mass of 5000 members. (The growth rate in the 1999-2004 period was similar to that in the 1988 though 1993 period.) The next five years, 2005 through 2009, saw a phenomenal expansion that increased membership by 77% to 9000. However this increase of 4000 members was not matched by a corresponding increase in aircraft ownership — the RA-Aus register increased by only 700 aircraft or 31% during the same five years. The 2010-2011 period shows a definite slowdown in the rate of membership growth, 5% in 2010 and 3.5% during 2011. At the end of 2011 about 66% of the membership did not own an aircraft — perhaps the highest proportion ever — so the current high cost of hiring, for possibly 66% of the members, no doubt makes a significant contribution to the circumstances prompting non-renewal of membership. RA-Aus aircraft register The number of aircraft on the register increased by 198 aircraft (6% increase) during the 12 months since 31 January 2011, 246 were added and 48 dropped off. The swing away from home-builts (now 42% of total aircraft) towards increasingly complex (and rather expensive) factory-built aircraft seems to have stabilised during the past three years. The market value of the RA-Aus flight line is currently estimated at $125 million with an average unit value around $36 500. Total on register 3414 3216 2955 2912 Category prefix Number & % of total at 31 January 2012 Number & % of total at 31 January 2011 Number & % of total at December 2009 % of total at December 2007 % of total at June 2006 10- 226 – 7% 234 – 7% 250 – 8% 12% 13% 19- 1092 – 32% 1024 – 32% 926 – 31% 32% 35% 28- 103 – 3% 104 – 3% 104 – 3.5% 4% 5% Home-built 1421 – 42% 1362 – 42% 1280 – 43% 48% 53% 32- 501 – 14.5% 458 – 14% 433 – 15% 14% 12% 24- 1026 – 30% 912 – 28% 741 – 25% 18% 12% 25- 263 – 7.5% 271 – 8% 290 – 10% 11% 10% 55- 203 – 6% 213 – 7% 211 – 7% 8% 10% Factory-built 1993 – 58% 1854 – 58% 1675 – 57% 52% 47% Regulatory environment The CASR Part 103* compliant exemption CAOs were issued in April: CAO 95.4 GFA gliders/motor gliders. CAO 95.8 HGFA hang gliders/paragliders plus powered variants. CAO 95.10 RA-Aus/HGFA low-momentum ultralights. CAO 95.12 ASRA gyroplanes. CAO 95.12.1 ASRA LSA gyroplanes. CAO 95.32 HGFA/RA-Aus weight shift controlled aeroplanes and powered parachutes. CAO 95.54 ABF hot-air balloons and airships. CAO 95.55 RA-Aus ultralight aeroplanes. For further information, see 'An overview of the legislative framework enabling powered recreational aviation'. *CASR Part 103 and Part 149 seem to have disappeared from view; however, in March 2011 the Director of Aviation Safety [CASA's chief] announced that CASA's recreational and sport aviation regulatory functions have been moved from the Standards Division to the Office of the Director of Aviation Safety, reporting to the Associate Director of Aviation Safety. Hopefully this will result in more decision making being directed toward the long overdue promulgation of CASR Part 103 'Sport and Recreational Aviation Operations' and Part 149 'Sport and Recreational Aviation Administration Organisations'. The long history of the proposed Part 103 and Part 149 legislation perhaps reveals a reason for the Director to now assume close oversight. The first notices of proposed rule making [NPRM] relating to Parts 103 and 149 were published 13 years ago (about two years after initial industry discussions) as NPRM 9808RP and NPRM 9805RP. These were subsequently followed, in 2000, by a set of rules drafted by the Attorney General's Department as another NPRM, which was promptly withdrawn by the then Director of CASA. Six years later, in December 2006, CASA published NPRM 0603OS, the current proposal relating to Part 103 followed, in July 2007, by NPRM 0704OS, the third proposal relating to Part 149. 2012 There were three fatal accidents in the first half-year but none during the remainder, two of the accidents involved trikes. The death toll was five — two pilots and a passenger in the trikes, an instructor and a pilot-under-instruction in a Piper Sport. The 5-year moving average accident rate is now 3.6 per annum, an improvement on the moving average 12 months ago when it stood at 4.6 per annum. The reason for the decrease in the 5-year moving average is that 2007 — which was the worst year since 1986 — dropped out of the series and 2008 — which was the best year ever — remained in the 5-year series. The 4-year (2009 through 2012) average is 4.2 fatal accidents per annum, so the 2009-2012 improvement was rather small and indications for 2013 are very bad at the time of writing (28 February 2013). There were turbulent periods in 2012 for some associated with RA-Aus: A corporate audit by CASA's sport aviation office late in 2011 revealed major shortcomings in the process for acceptance of LSA aircraft. Some of the documentation required, under the Technical Manual section 7.5.1, was missing from those aircraft files sampled in the audit, leading auditors to the conclusion that some LSA aircraft could be flying without a valid Certificate of Airworthiness. The auditors raised a Safety Alert which is a request for immediate corrective action. At the end of November 2011 RA-Aus sent letters to 136 owners of LSA aircraft effectively grounding those aircraft until missing documentation was received. A number of aircraft from a few Australian manufacturers had their registration prefix changed from 24- (LSA) to 19- (Experimental) because of non-compliance with the ASTM standards. One kit aircraft type was grounded because the type was not manufactured in an ICAO contracting State. At December 2012 there were still some outstanding matters relating to non-LSA registration documentation which was also delaying a large number of renewals. There were significant staff losses which placed a heavy burden on the office in attempting to cope with the losses of skills and experience while having the additional work load occasioned by the urgent need to correct the problems identified by the audit. This added to the delays in processing normal registration renewals. Three Board members resigned before the expiry of their elected term, some quite early in their first term. Growth in RA-Aus numbers The total ordinary membership at 2 January 2013 was 9906; a net decrease of 102 (1%) during the year. During 2011 there was a net increase of 334 or 3.5%, the corresponding membership increase in 2010 over 2009 was 5%, 2009 over 2008 was 9.5%; 2008 over 2007 was 8%. The change reported is the sum of new members enrolled less the turnover of the existing membership during the period, 2012 was the first year in which a membership decrease occurred since 1995. This is not unexpected — see the 2010 'growth in numbers' survey. RA-Aus aircraft register The number of aircraft on the register decreased slightly from 3414 at 31 January 2012 to 3368 on 2 January 2013. Though the change in itself may not be significant, it is the first year since 1993 that the number of aircraft has decreased. However it may be that there has been some erroneous statistical reporting due to the problems the staff have with registration renewals. Regulatory environment CASA will introduce their Recreational Pilot Licence 1 September 2014. This will authorise a person over 16 years of age to pilot a single-engine aircraft that has a maximum certificated take-off weight of not more than 1500 kg, by day under the visual flight rules if the aircraft is engaged in a private operation. The aircraft must be listed on the Australian civil aircraft register, not an RAAO aircraft register. The Australian private vehicle driver licence medical conditions apply. Persons on board is generally limited to one passenger plus the pilot. General aviation aircraft maintenance rules still apply of course. For more information see CASR Part 61 recreational pilot licence regulations 61.460 to 61.500, at pages 98 to 101 or the CASA RPL information brochure. This concludes the 'Joining sport and recreational aviation' series STRICT COPYRIGHT JOHN BRANDON AND RECREATIONAL FLYING (.com)